Biostabilization and Transport of Cohesive
Sediment Deposits in the Three Gorges
Reservoir
Hongwei Fang1, Mehdi Fazeli1,2, Wei Cheng1, Lei Huang1*, Hongying Hu3
1Department of Hydraulic Engineering, State Key Laboratory of Hydro-science and Engineering, Tsinghua University, Beijing, China,2Department of Civil Engineering, Yasouj University, Yasouj, Iran,3School of Environment, Tsinghua University, Beijing, China
Abstract
Cohesive sediment deposits in the Three Gorges Reservoir, China, were used to investi-gate physical and geochemical properties, biofilm mass, and erosion and deposition char-acteristics. Biofilm cultivation was performed in a recirculating flume for three different periods (5, 10 and 15 days) under ambient temperature and with sufficient nutrients supply. Three groups of size-fractionated sediment were sequentially used, including 0–0.02 mm,
0.02–0.05 mm and 0.05–0.10 mm. Desired conditions for erosion and deposition were
designed by managing high bed shear stress at the narrow part of upstream flume and low shear stress at the wide part of downstream flume. Biostabilization and transport character-istics of the biofilm coated sediment (bio-sediment) were strongly influenced by the cultiva-tion period, and the results were compared with clean sediment. The bio-sediment was more resistant to erosion, and the mean shear stress was increased by factors of 2.65, 2.73 and 5.01 for sediment with 5, 10 and 15 days of biofilm growth compared with clean sedi-ment, resulting in less sediment being eroded from the bed. Simultaneously, the settling velocity was smaller for bio-sediment due to higher organic content and porosity (i.e., lower density). Additionally, there was a smaller probability of deposition for sediment with a lon-ger cultivation period after erosion, resulting in more retention time in aquatic systems. These results will benefit water management in natural rivers.
Introduction
In aquatic systems many contaminants of concern are associated with and transported by cohesive sediment [1]. Biostabilization and transport of cohesive sediment are critical to the aquatic environment and bed morphology. Sediments in a trophic water column provide excel-lent substrata for microorganism colonization [2–4]. The secretion of metabolic products (e.g., extracellular polymeric substances, EPS) causes the formation and growth of biofilm on the sediment surfaces [5,6]. Biofilm is a complex matrix of living microorganisms and their meta-bolic products. Here, sediment particles coated with biofilm are defined as bio-sediment to dis-tinguish them from clean sediment.
OPEN ACCESS
Citation:Fang H, Fazeli M, Cheng W, Huang L, Hu H (2015) Biostabilization and Transport of Cohesive Sediment Deposits in the Three Gorges Reservoir. PLoS ONE 10(11): e0142673. doi:10.1371/journal. pone.0142673
Editor:Yanguang Chen, Peking UIniversity, CHINA
Received:May 31, 2015
Accepted:October 26, 2015
Published:November 11, 2015
Copyright:© 2015 Fang et al. This is an open access article distributed under the terms of the Creative Commons Attribution License, which permits unrestricted use, distribution, and reproduction in any medium, provided the original author and source are credited.
Data Availability Statement:All relevant data are within the paper.
Funding:This study was supported by the National Natural Science Foundation of China (No. 51139003 and 11372161). The funders had no role in study design, data collection and analysis, decision to publish, or preparation of the manuscript.
The development of biofilm can influence the sediment properties (e.g., size gradation, mor-phology, density and stability) and their transport processes [7,8], as well as affect sediment associated contaminant transport [9]. Field investigations have shown that biofilm contributes a major part of the cohesiveness of sediments [10] and influences the sediment dynamics through binding fine-grained sediment, changing water content, and increasing organic con-tent, etc. [11,12]. Thus, biofilm growth could significantly enhance biostabilization, with bio-film-infused bed sediments requiring more energy for erosion relative to clean sediment. Studies on biogenic sediment stabilization were first carried out in marine systems [11,13–16], followed by some recent studies in freshwater systems (i.e., streams and lakes) [12,17–19]. However, the biofilm effects on biostabilization and transport of cohesive sediment in reser-voirs have rarely been reported.
In recent decades, a great number of reservoirs have been built in China, significantly affect-ing the sediment fluxes and causaffect-ing profound and irreversible changes to river system func-tions [20,21]. Most reservoirs, such as the Three Gorges Reservoir (TGR), employ the strategy of storing clear water and discharging turbid water to control sedimentation and maintain capacity [22]. In non-flood seasons, the water level is kept at the normal pool level. Thus, the flow slows down, resulting in a significant accumulation of both sediment and nutrients at the bed surface [23], which increases the biofilm formation and growth rate. Biofilm can permeate void spaces and promote inter-particle linkages, and the resultant increased level of attachment within and between deposited flocs can lead to increased bed stability [12]. When the reservoir discharges turbid water in flood seasons, the bio-sediment is eroded into the overlying water, causing many serious aquatic environment problems in the reservoir [24]. Therefore, knowl-edge of the biostabilization and transport of bio-sediment is essential for the operation of the TGR.
In this study, flume experiments were designed to enhance our understanding of the biost-abilization and transport of bio-sediment in reservoirs. Biofilm cultivation was performed in the flume for different periods, and the biofilm formation and growth were then characterized. Subsequently, the sediment was eroded under certain hydrodynamic conditions. The bio-film effects on the biostabilization and transport of the bio-sediment were effectively investi-gated through addressing the erosion process (e.g., incipient velocity and bed shear stress), suspended sediment concentration (SSC) distribution, and the deposition process (e.g., varia-tion of size gradavaria-tion and settling behavior), etc. These results will provide valuable references for the operation of the TGR.
Materials and Methods
Ethics statement
No specific permissions were required for sampling activities in these locations. We confirmed that these field studies did not involve endangered or protected species.
Study area and sample collection
collected from the TGR. Surface deposits of fine sediment were collected with a plastic scoop, immediately refrigerated at 4°C and then transported within one week to the laboratory of Tsinghua University, Beijing, where they were studied using a recirculating flume.
Experiment design
Flume setup. A flume with an overall length of 14 m and a width of 0.5 m was modified to
provide the desired conditions for both erosion and deposition [23], as shown inFig 1. A con-stant width of 0.16 m was maintained in the upstream channel betweenx= 0 m andx= 6 m (wherexis the distance from the flume inlet). In the region 6 m<x<8 m, the channel width
was extended from 0.16 m to 0.5 m. Downstream of the expansion region, the channel had a constant width of 0.5 m. Moreover, the flume had a slope of 0.0025, and the experiment water was recirculated within the flume by a pump system [23]. The experiment was designed to observe sediment erosion in the upstream channel and deposition in the downstream channel. In particular, a flow damper was arranged in the front of the flume to trap the recirculated sus-pended load, and a regulation gate was deployed at the end of the flume for flow condition con-trol (Fig 1).
Biofilm cultivation. Sediment samples were placed in the upstream channel of the flume
(i.e., the region from 1 m to 5 m), as shown by the gray bar inFig 1A. It is evident that fine sedi-ment is conducive to biofilm attachsedi-ment, whereas coarse sedisedi-ment contains less biofilm. Here, three groups of size-fractionated sediment, including 0–0.02 mm, 0.02–0.05 mm and 0.05–0.10 mm, were sequentially used to consider the effects of sediment size on biostabilization. It is important to keep in mind that sediment with a size of 0–0.10 mm is the main component of deposits in the TGR. Then, two ends of the region from 1 m to 5 m were closed and an appro-priate amount of river water was added to a depth of approximately 6 cm for biofilm
cultivation.
To promote biofilm growth, nutrients were added into the river water to ensure a relatively high trophic level. The nutrient solution compositions were proposed by Wu et al. [27] and optimized by Zhao [28] as: glucose (C6H12O6)—0.5 g/L, potassium dihydrogen phosphate
(KH2PO4)—0.05 g/L, sodium bicarbonate (NaHCO3)—1.0 g/L, anhydrous magnesium sulfate
(MgSO4)—0.05 g/L, ammonium chloride (NH4Cl)—0.1 g/L, and calcium chloride (CaCl2)—
0.015 g/L. Biofilm growth was performed for three growth periods (5, 10 and 15 days) under
Fig 1. (a) Top view and (b) longitudinal view of the recirculating flume, including an upstream channel (0 m<x<6 m), an expansion region (6 m<
x<8 m) and a downstream channel (8 m<x<14 m).The sediment is shown by the gray bar from 1 m to 5 m.
ambient temperature, with an average value of approximately 19.6°C. The experiment water was refreshed everyday using a siphon tube to replenish the nutrients.
Erosion experiment. A bio-sediment bed was formed in the upstream channel of the
flume. After biofilm growth of 5, 10 or 15 days, the whole flume was slowly filled with experi-ment water to a depth of 10 cm to avoid disturbing the bio-sediexperi-ment bed. Then, the pump sys-tem started working, and the discharge was gradually increased by the control syssys-tem to observe the incipient motion of bio-sediment. A new bio-sediment bed was formed from the erosion of bio-sediment in the upstream channel of the flume and the deposition in the down-stream channel. As described above, the erosion experiments involved three groups of size-fractionated sediment, and three different cultivation periods, that is, totally nine experiment scenarios were carried out. Simultaneously, the erosion experiment of clean sediment (i.e., bio-film growth of 0 day) was also performed for comparison.
During the experiment, water samples were taken for sediment concentration analysis using a specifically designed instrument [23]. The time interval between each sampling was approxi-mately 15 min. Note that the first sampling was implemented right after detecting suspended sediment, i.e., just a few minutes after the incipient motion of bio-sediment. For each sampling, water samples were collected every 2 m along the flume. The sediment concentration was mea-sured using a photoelectric sediment concentration meter (CYS-III, Nanjing Hydraulic Research Institute, China). Moreover, the bed morphology was measured using the MASA-TOYO electronic profile indicator (EPI, Japan), with an interval of 10 cm along the axis of the flume and eight discrete points in each section. Morphology was measured twice for each experiment, i.e., initial bed surface (at the beginning of the erosion experiment) and final bed surface (a few hours after terminating the experiment), as an indicator of overall erosion condi-tions. Moreover, measurements of the hydrodynamic parameters, including discharge, water level and flow velocity, were implemented during the experiment.
Sediment samples analyses
Physical and geochemical properties. Cohesive sediment samples were collected from
TGR and submitted for physical and geochemical analysis. The grain size distribution was determined using a laser scattering particle size distribution analyzer (LA-920, HORIBA). The mineral composition was evaluated via the X-ray powder diffraction method using a Philips X’pert PW3040-PRD diffractometer with a Cu X-ray source operated at 40 kV and 50 mA. The concentrations of major elements (including N, O, Na, Mg, Al, Si, P, S, Cl, K, Ca, Fe and Cu) were determined via X-ray fluorescence spectrometry, and certified reference materials USGS GXR-1, GXR-2, GXR-4 and GXR-6 were analyzed at the beginning and the end of each batch of samples.
Microscopy observation. Environmental scanning electron microscopy (ESEM), which
Biofilm mass. Biofilm is an amorphous complex matrix comprising living microorgan-isms (e.g., bacteria, microalgae and fungi) and their metabolic products (e.g., EPS). The sedi-ment loss on ignition (LOI) is a traditional and convenient measure of organic content [30,31] that can be regarded as an indirect estimation of biofilm mass. Here, bio-sediment samples gathered from the flume were first dried at 105°C, and then the LOIs were determined using a Muffle furnace at 550°C for 8 h. The amount of biofilm mass was expressed as the mass of organic matter per gram of sediment (mg/g).
Results and Discussion
Biofilm formation and analysis
Physical and geochemical properties. The geochemical properties and mineral
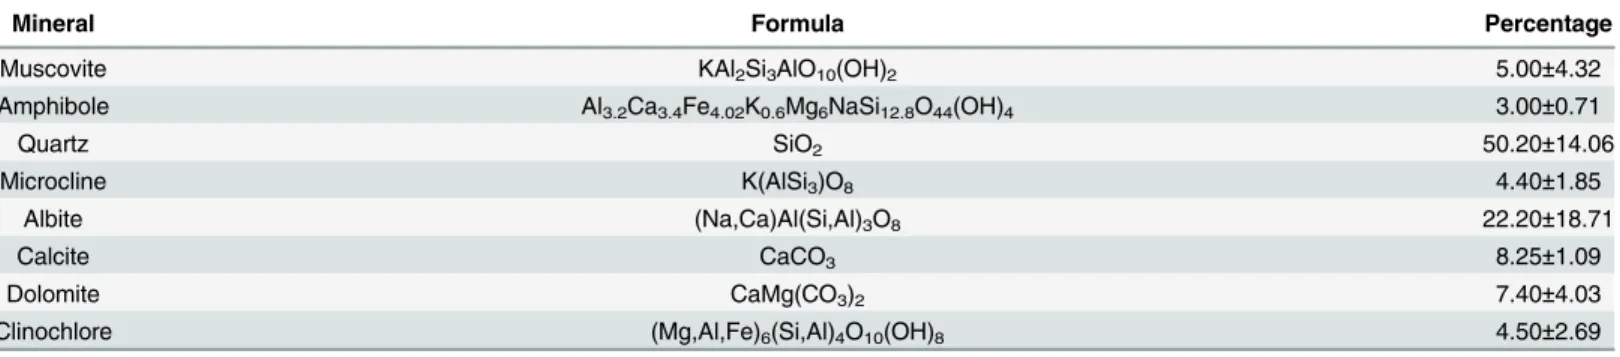
composi-tion of the initial sediment will influence biofilm formacomposi-tion by affecting sediment properties. The mineral composition of the cohesive sediment deposits in the TGR are shown inTable 1. It was found that quartz accounted for the largest percentage (50%), followed by albite (22%), while only a small percentage of the clay minerals (i.e., 5% muscovite and 5% clinochlore) was observed. Thus, sediment is an assemblage of minerals, potentially resulting in complicated morphology and surface charge distribution [32,33], which are beneficial for microorganism attachment and biofilm formation. Moreover, the major element composition of the sediment sample is presented inTable 2, including the mass percentage and atomicity percentage. It was observed that O, Si and N were the major elements composing the sediment sample, totally accounting for more than 95.5% of the sediment. Moreover, approximately 2.5% of Al and Fe (i.e., corresponding to the Fe/Al (hydr)oxides), which were critical to the nutrients and con-taminants adsorption, were observed.
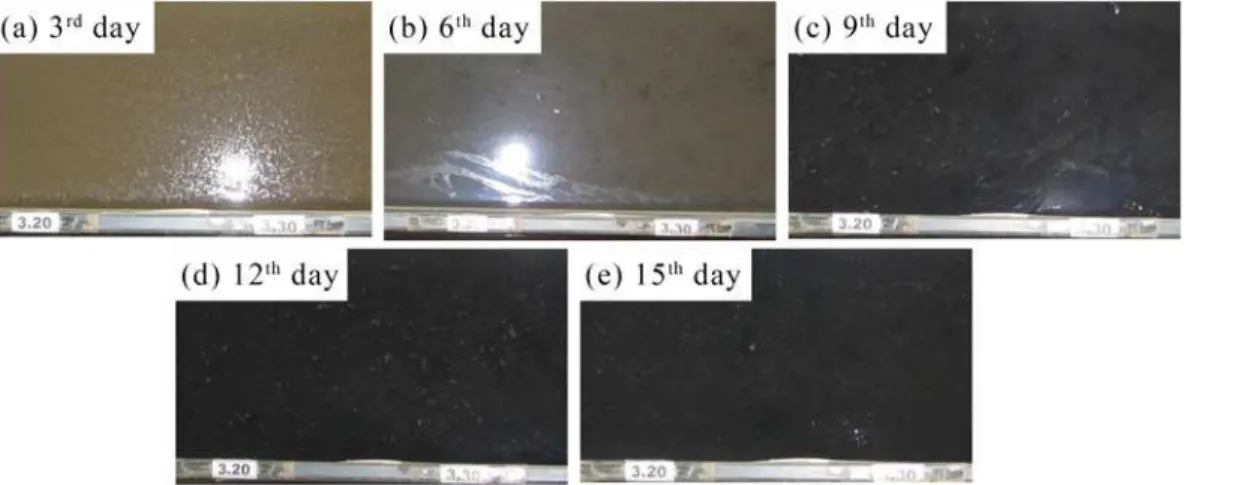
Biofilm formation. Photographs of the biofilm growth with the cultivation period are
shown inFig 2, where images (a)-(e) correspond to cultivation periods of 3, 6, 9, 12 and 15
Table 1. Mineral composition of cohesive sediment deposits in the TGR (%).
Mineral Formula Percentage
Muscovite KAl2Si3AlO10(OH)2 5.00±4.32
Amphibole Al3.2Ca3.4Fe4.02K0.6Mg6NaSi12.8O44(OH)4 3.00±0.71
Quartz SiO2 50.20±14.06
Microcline K(AlSi3)O8 4.40±1.85
Albite (Na,Ca)Al(Si,Al)3O8 22.20±18.71
Calcite CaCO3 8.25±1.09
Dolomite CaMg(CO3)2 7.40±4.03
Clinochlore (Mg,Al,Fe)6(Si,Al)4O10(OH)8 4.50±2.69
doi:10.1371/journal.pone.0142673.t001
Table 2. Major element composition of cohesive sediment deposits in the TGR (%).
Element Mass percentage Atomicity percentage Element Mass percentage Atomicity percentage
N 5.53±0.70 7.77±0.97 S 0.17±0.24 0.10±0.14
O 51.18±4.19 62.89±3.62 Cl 0.13±0.10 0.07±0.06
Na 0.30±0.21 0.26±0.19 K 0.65±0.27 0.33±0.14
Mg 0.71±0.19 0.58±0.17 Ca 0.64±0.10 0.31±0.05
Al 2.46±0.92 1.80±0.69 Fe 2.27±0.83 0.80±0.31
Si 35.38±2.98 24.89±2.66 Cu 0.58±0.42 0.18±0.13
P 0.01±0.00 0.01±0.00
days, respectively. The images inFig 2clearly show that cultivation period obviously affects the quality and quantity of biofilm growth. As shown inFig 2A, no biofilm formation was observed before the 5th day, and then biofilm growth occurred gradually. The biofilm growth started with points of apparent dark color (Fig 2B) and overspread to the entire cultivation region after the 9th day (Fig 2C). Hereafter, the apparent dark color of the biofilm had few changes (Fig 2C–2E), while changes in the odor and thickness of the biofilm continued until the last day. As with the biofilm formation, a thin layer of foam-like materials developed on the water surface.
After 15 days of biofilm growth, a mature biofilm was formed on the bed surface. ESEM was then used to observe the morphology of the bio-sediment, as shown inFig 3. First, the bio-sedi-ment was observed using the environbio-sedi-mental mode with a relative humidity of 100%. The real ultrastructure of samples could be directly observed without damaging the architecture. There-after, each sample was tested using the high vacuum mode together with the clean sediment. These ESEM images showed more organic coatings and inter-particle linkages for the bio-sedi-ment relative to the clean sedibio-sedi-ment; thus, the biofilm-infused bed sedibio-sedi-ment required more
Fig 2. Typical photographs of the biofilm growth with the corresponding cultivation period.The number in each image represents the cultivation period, i.e., images (a)-(e) correspond to cultivation periods of 3, 6, 9, 12 and 15 days, respectively.
doi:10.1371/journal.pone.0142673.g002
Fig 3. Environmental scanning electron microscopy photos of sediment samples after 15 days of biofilm growth.(a) Environmental mode, (b) high vacuum mode using the dried sample after environmental mode, (c) high vacuum mode using the clean sediment, (d) foam, which developed on the water surface during cultivation.
energy to undergo erosion. It seemed that the foam-like materials (Fig 3D) facilitated biofilm formation via partial deposition on the bed surface.
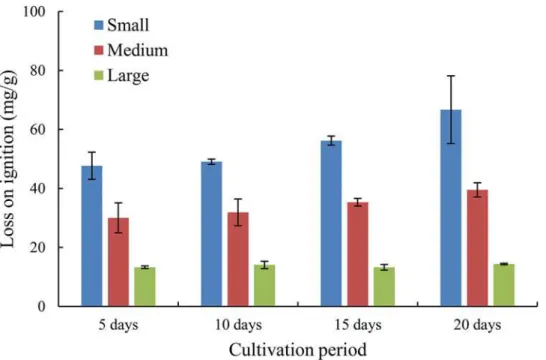
Biofilm mass. A simple estimate of the biofilm growth on the bed surface, expressed as
mass of organic matter per gram of sediment (LOI), is shown inFig 4, including three size-frac-tionated sediments, i.e., small (0–0.02 mm), medium (0.02–0.05 mm), and large (0.05–0.10 mm). Fine sediment had an overall higher level of organic content relative to coarse sediment (i.e., the average values were 54.90, 34.18 and 13.74 mg/g for the small, medium and large sizes, respectively), which was consistent with the intuitive feeling. For each group of size-fraction-ated sediments, the values of LOI increased with increasing cultivation period, especially after 10 days of biofilm growth, implying the significant effects of cultivation period on biostabiliza-tion. Considering the increasing rate, one may deduce that the effect of cultivation period on LOI is more intense for small sediments, while relatively weaker effects may exist for medium and large sediments. After 20 days of biofilm growth, the LOI values reached 66.67, 39.50 and 14.36 mg/g for the small, medium and large sizes, respectively. In view of the intensive biofilm growth, i.e., a more significant impact on biostabilization, the following analyses were mostly focused on the small sediments group (0–0.02 mm).
Biostabilization and transport of bio-sediment
Biofilm erosion process. For bio-sediment, an additional adhesive force acts on the
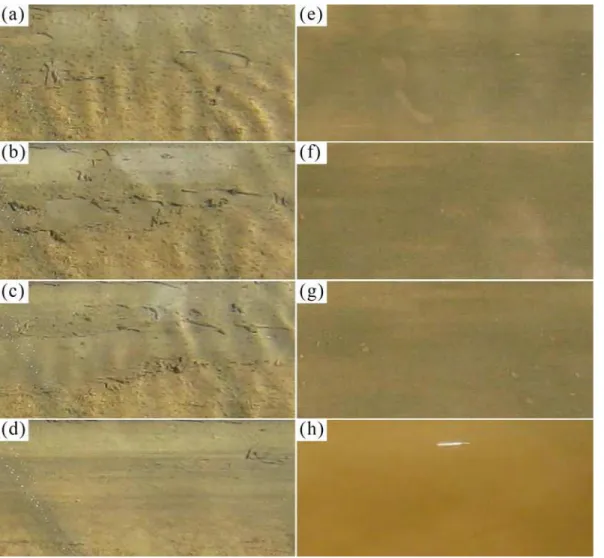
sedi-ment particles through biofilm growth, resulting in a different erosion behavior relative to clean sediment.Fig 5shows some sequential images of biofilm detachment and the subsequent erosion of the underlying sediment, with a cultivation period of 5 days. Note that these images belong to three groups, i.e.,Fig 5A–5D, 5E–5G and 5H, with a time interval of 20 s between adjacent images in each group, while 30 min between different groups. The whole period lasted approximately 1 h. Biofilm acted as a mat on the bed surface and began to erode before the underlying sediment. As shown inFig 5A–5D, biofilm erosion started with the occurrence of
Fig 4. Relations between loss on ignition (LOI) and cultivation period for three groups of size-fractionated sediment: small (0–0.02 mm), medium (0.02–0.05 mm) and large (0.05–0.10 mm).
small fractures, followed by rolling up upon itself and then detaching completely. Thereafter, flocculated particles were eroded with increasing bed shear stress, and their saltation and slid-ing motions motivated the underlyslid-ing sediment to suspend.Fig 5E–5Gshows some bio-sedi-ment sliding on the bed, and a large amount of sedibio-sedi-ment was suspended inFig 5H. The change in color from dark to yellowish brown in these photos was probably a sign of clean sediment erosion, implying that the biofilm only developed in the surface layer.
Several studies have demonstrated that biostabilization can significantly increase the energy required to erode sediment [12,13], i.e., a higher bed shear stress to reach a threshold of bio-sediment motion. Thus, a quantitative method to determine the incipient velocity of bio-sedi-ment is needed. In our previous work [34], a predictive formula for the incipient mean velocity of bio-sediment was established, simultaneously considering the cohesive force between sedi-ment particles and the adhesive force generated by biofilm, i.e.,
U2 c
gD¼
gs g
g 6:25þ41:6
H Ha
þ 111þ740H Ha
Had D2 þ
AðtÞ
gD ð1Þ
Fig 5. Sequential images displaying the erosion process of bio-sediment, i.e., from the destruction of the biofilm mat to the suspension of lower layers.The entire time interval (a-h) is nearly one hour. The images belong to three time groups: a-d, e-g and h. The time interval between adjacent images of each group is 20 s, and it is 30 min between different groups.
whereUcis the incipient mean velocity in the section (cm/s);gis the acceleration of gravity
(cm/s2);Dis the particle diameter (cm);γandγsare the bulk density of water and sediment,
respectively (g/s2/cm2);His the water depth (cm);Hais the head of water, equivalent to the
atmospheric pressure (cm);δis the diameter of a water molecule (= 3×10⁻⁸cm). The
parame-terA(t), which represents the biofilm effects, is a function of the cultivation periodt(in weeks) and particle diameterD, expressed as
AðtÞ ¼18:6D 0:503
te1 0:355t
ð2Þ
Thus, both the properties of biofilm (i.e., cultivation periodt) and sediment particles (i.e., parti-cle diameterD) were considered in Eq (1).
The incipient velocitiesUcfor bio-sediment with a cultivation period of 5, 10 and 15 days
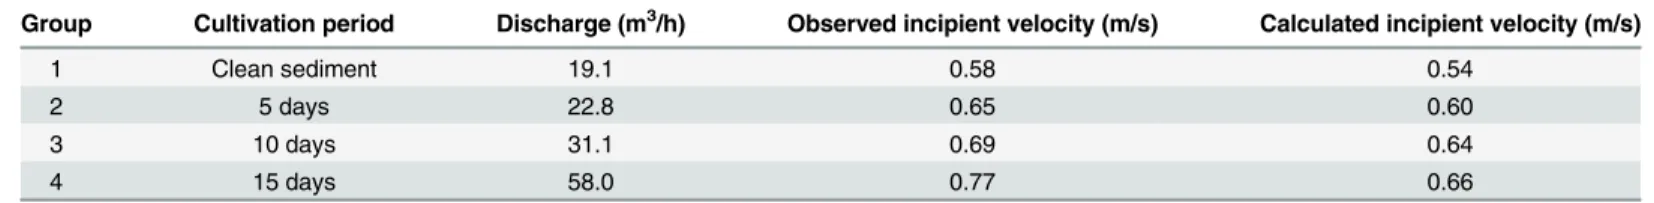
were calculated atx= 2.4 m and compared with the clean sediment, as shown inTable 3. More-over, the observed values were also presented, corresponding to the first sampling that was implemented right after detecting suspended sediment. Thus, it was estimated that the
observedUcwas slightly larger than the calculated value. Overall, the calculated incipient
veloc-ities were comparable to the observed values. Moreover, greater incipient velocveloc-ities were observed for the bio-sediment relative to the clean sediment, implying an increase of resistance to erosion due to biofilm growth. The incipient velocity increased with increasing cultivation period, i.e., the bio-sediment with the cultivation period of 15 days had the largestUc, followed
by 10 days of biofilm growth and then 5 days. Thus, less erosion was expected for bio-sediment
Table 3. Comparison between the calculated and observed incipient velocities atx= 2.4 m for different experiments.
Group Cultivation period Discharge (m3/h) Observed incipient velocity (m/s) Calculated incipient velocity (m/s)
1 Clean sediment 19.1 0.58 0.54
2 5 days 22.8 0.65 0.60
3 10 days 31.1 0.69 0.64
4 15 days 58.0 0.77 0.66
doi:10.1371/journal.pone.0142673.t003
Fig 6. Erosion maps of bio-sediment based on the morphology measurement in the region from 1 m to 5 m.Different colors represent different erosion depths; (a) clean sediment, (b) 5 days, (c) 10 days and (d) 15 days of biofilm growth.
with a longer cultivation period.Fig 6shows the erosion maps based on the measured mor-phology, representing the overall erosion conditions. It was evident that less bio-sediment was eroded after the flume ran for a longer cultivation period. Statistics showed that approximately 73.8%, 68.3%, 28.2% and 14.8% of the total sediment was eroded for experiments using sedi-ment with cultivation periods of 0, 5, 10 and 15 days, respectively.
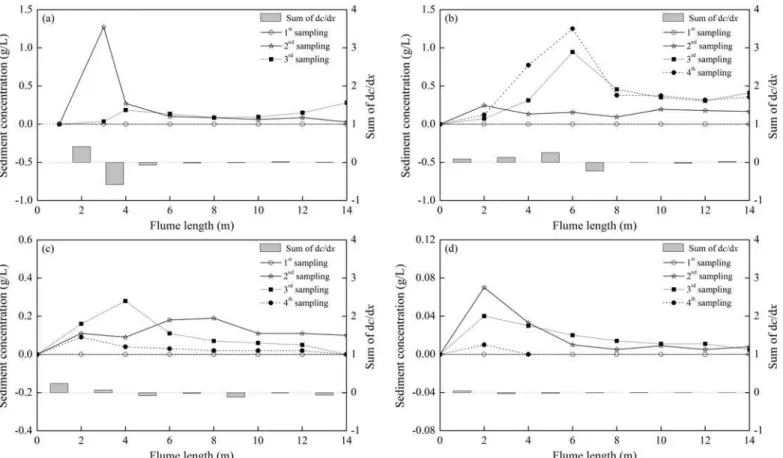
Bio-sediment transport. The temporal and spatial variations of sediment concentration
(denoted asc) for different cultivation periods (0, 5, 10 and 15 days) are shown inFig 7. The sediment concentrations were modified according to the value atx= 0 m. In each image, the curves correspond to four different samplings, expressed by hollow circles and stars and solid squares and circles, respectively. Overall, a shared trend was observed for different cultivation periods, i.e., a peak sediment concentration was observed in the upstream channel of the flume where erosion occurred, and then it decreased along the flume due to deposition. Considering the effects of biofilm growth on the maximum SSC,Fig 7revealed that clean sediment had a maximum value of approximately 1.3 g/L, followed by 5, 10 and 15 days of biofilm growth with values of 1.25 g/L, 0.3 g/L and 0.07 g/L, i.e., a decrease of 1.5%, 78% and 94.5% compared to clean sediment, respectively. More adhesive force due to biofilm growth represented greater biostabilization, simultaneously resulting in smaller suspended sediment concentrations. To quantify the ascending or descending manner of a specified curve, its slope could be calculated. The summation of all such slopes at each length interval represented the net sediment erosion (i.e., sum of dc/dx>0) or deposition (i.e., sum of dc/dx<0). Similarly, it was found that the Fig 7. The temporal and spatial variations of sediment concentration for different cultivation periods.(a) Clean sediment, (b) 5 days, (c) 10 days and (d) 15 days of biofilm growth. In each image, the sediment concentrations are modified according to the value atx= 0 m, and the sum of dc/dxrepresents the
net sediment erosion (positive) or deposition (negative) between two adjacent sections.
maximum positive value of the sum of dc/dxwas related to clean sediment, followed by 5, 10 and 15 days of biofilm growth. Because the sum of dc/dxidentified the intensity of erosion, greater positive values represented more sediment erosion.
The bed shear stress associated with skin friction, which is responsible for the entrainment of sediment into suspension, could be expressed asτ=γRb,sSf, whereRb,sis the hydraulic radius
of the bed region associated with skin friction andSfrepresents the energy slope.Rb,swas
calcu-lated using the method described by Viparelli et al. [35]. Here,τErandτDerepresent the bed
shear stresses in the erosion and deposition regions, i.e.,x= 4.0 m and 12.0 m of the flume length, respectively. Moreover,ΔcEr=cmax-cinlet(i.e., a positive value) denotes the change of
sediment concentration in the erosion region, whileΔcDe=coutlet-cmax(i.e., a negative value)
represents the change in the deposition region. Subscriptsinlet,outletandmaxrepresent the beginning, the end and the location of maximum concentration along the flume length, respectively.
Fig 8shows the calculated bed shear stress and the change of sediment concentration for dif-ferent cultivation periods. TheX-axis represents the time during the erosion experiment. A largerτErwas observed for the sediment with a longer cultivation period. For example, a shear
stress of approximately 2 Pa was needed for sediment with 10 and 15 days of biofilm growth (Fig 8C and 8D), while less than 1 Pa was needed for clean sediment and 5 days of biofilm growth (Fig 8A and 8B). Statistics showed that there was an increase of a factor of 2.65, 2.73 and 5.01 of the mean shear stress for sediment with 5, 10 and 15 days of biofilm growth
Fig 8. Calculated shear stress and the change of sediment concentration for different cultivation periods.(a) Clean sediment, (b) 5 days, (c) 10 days and (d) 15 days of biofilm growth.ΔcErandΔcDespecify the concentration changes in the erosion and deposition regions, respectively.
compared with clean sediment. As stated in the literatures, shear stresses of 0–0.4 Pa and 0.4–
1.0 Pa were derived for 14 days of biofilm growth by Stone et al. [1] and Watanabe et al. [36], respectively, while here, a shear stress of 1.3–2.2 Pa was calculated for 15 days of biofilm growth (Fig 8D). These discrepancies were probably caused by the specific cultivation conditions in this study, e.g., the addition of nutrients in the experiment water, and the day by day replenish-ment of nutrients, leading to a deeper and stronger biofilm growth. It was verified that parts of the biofilm still remained unchanged after the flume ran.
Meanwhile, it was apparent that more time was needed for the erosion of sediment with a longer cultivation period. As shown inFig 8, the total erosion time for clean sediment and 5 days of biofilm growth was less than 1 h, while approximately 2 h was needed for sediment with 10 and 15 days of biofilm growth. Similarly, the absolute values ofΔcErandΔcDewere
much larger for clean sediment and 5 days of biofilm growth, i.e., more than 1 g/L at some spe-cific time, while less than 0.2 g/L was observed for sediment with 10 and 15 days of biofilm growth. All of these results illustrated that the stronger biofilm growth due to a longer cultiva-tion period enhanced the biostabilizacultiva-tion, which significantly increased the energy required for sediment erosion and resulted in a greater resistance to erosion.
Variation of size gradation and settling analysis. The grain size distribution of deposited
sediment (i.e., the eroded flocs) was compared to the initial clean sediment inFig 9, indicating the effects of biofilm growth on sediment size. Here, the results for a cultivation period of 15 days were presented. A clean sediment sample was taken from the initial bed (before biofilm growth) atx= 2.4 m, while deposited sediment samples were gathered from successive posi-tions atx= 7.0, 8.0, 10.0, 12.0 and 14.0 m after the flume ran. Comparing the characteristic par-ticle sizes, it was evident that deposited sediment had a larger size relative to clean sediment, i.e., at least 65% and 150% increase of the median size and maximum size, respectively. How-ever, these measured sediment sizes were still smaller than the expected values for bio-sediment predicted by Shang et al. [8], which could be partly due to the destruction of flocculated struc-ture before deposition. Although the sediment size increased significantly during the biofilm
Fig 9. Size gradation curves of the initial clean sediment (a) and the deposited sediment atx= 7.0, 8.0, 10.0, 12.0 and 14.0 m (b-f) for the erosion
experiment of 15 days of biofilm growth.
growth, it decreased gradually due to the flow turbulence after being eroded from the bed sur-face. Furthermore, the median sizes of 0.026, 0.018, 0.018, 0.014 and 0.015 mm were observed for deposited sediment samples atx= 7.0, 8.0, 10.0, 12.0 and 14.0 m, respectively, i.e., larger bio-sediment deposited first, followed by smaller ones.
Approximately 42.4%, 33.6%, 10.2% and 2.2% of the total sediment deposited in the flume for experiments using sediment with cultivation periods of 0, 5, 10 and 15 days, respectively, while approximately 73.8%, 68.3%, 28.2% and 14.8% of the total sediment was eroded, as described in the section ofBiofilm erosion process. We defined a settling rate as the ratio between the amounts of deposition and erosion. Then, the derived settling rates of clean sedi-ment and bio-sedisedi-ment cultivated for 5, 10 and 15 days were 57.4%, 49.2%, 36.2% and 14.9%, respectively, implying a smaller probability of deposition for sediment with a longer cultivation period once eroded, which was likely related to the characteristics of eroded flocs. Generally, bio-sediment that eroded into the water column formed flocs with high organic content and porosity, as well as low density, resulting in small settling velocities. Thus, bio-sediment with a longer cultivation period could remain in the water column for a longer period of time despite its greater resistance to erosion, i.e., a challenge for water management. These results were con-sistent with the conclusions reported by Stone et al. [1] and Shang et al. [8].
Implications for water management
In aquatic systems, many contaminants of concern are associated with and transported by cohesive sediment [1]. The present study showed that biofilm growth on the sediment surface could enhance the biostabilization, significantly increasing the energy required for sediment erosion, and could affect sediment-associated contaminant transport. In flood seasons, the water level of the TGR is kept at a normal pool level of 175 m with a water depth of approxi-mately 100 m, resulting in a significant accumulation of both sediment and nutrients at the bed surface [23] and providing favorable conditions for biofilm formation and growth. Kuang et al. [37] studied the phytoplankton in the TGR during the period before and after impoundment and reported that the species richness and cell densities of algae were considerably increased after the operation of the TGR. In flood seasons, the bio-sediment will be eroded into the over-lying water due to the increase of flow velocity. Flume experiments showed that bio-sediment with a longer cultivation period had a smaller probability of deposition after erosion due to the higher organic content and porosity (i.e., lower density). Therefore, bio-sediment will remain in the water column for a long time once the incipient velocityUcis exceeded, i.e., a potential
challenge for water management of the TGR.
Conclusions
1. Biofilm mass increased with increasing cultivation period, and a greater increasing rate was observed for fine sediment relative to coarse sediment. ESEM images showed more organic coatings and inter-particle linkages for the bio-sediment relative to clean sediment, which could significantly increase the energy required to erode sediment.
2. Biofilm growth significantly enhanced the biostabilization, i.e., a longer cultivation period resulted in a greater resistance to erosion. Larger shear stresses were observed for the erosion of sediment with longer biofilm growth periods, i.e., a 2.65-, 2.73- and 5.01-fold increase of the mean shear stress for sediment with 5, 10 and 15 days of biofilm growth compared to clean sed-iment. Correspondingly, the clean sediment had the maximum value of the SSC (i.e., the most sediment erosion), followed by sediment that was cultivated for 5, 10 and 15 days.
cultivation period had a lower settling velocity, resulting in more retention time in aquatic sys-tems after erosion.
Acknowledgments
The authors wish to thank Prof. Fu R.S. for his helpful comments, Mr Pang D.M. and Mrs Zhan X.L. for their technical supports during the flume experiments and Mr Xu G. for prepar-ing sediment.
Author Contributions
Conceived and designed the experiments: HWF MF. Performed the experiments: MF WC LH. Analyzed the data: MF WC LH. Contributed reagents/materials/analysis tools: HWF LH. Wrote the paper: HWF MF LH HYH.
References
1. Stone M, Emelko MB, Droppo IG, Silins U. Biostabilization and erodibility of cohesive sediment depos-its in wildfire-affected streams. Water Res. 2011; 45: 521–534. doi:10.1016/j.watres.2010.09.016
PMID:20970822
2. Neu TR. Biofilms and microbial mats. In: Krumbein WE, Paterson DM, Stal LJ, editors. Biostabilization. Oldenburg: Oldenburg University Press; 1994.
3. Fang HW, Chen MH, Chen ZH. Surface characteristics and modelling of environmental sediment. Bei-jing: Science Press; 2009.
4. Fang HW, Chen MH, Chen ZH, Zhao HM, He GJ. Effects of sediment particle morphology on adsorp-tion of phosphorus elements. Int J Sediment Res. 2013; 28: 246–253.
5. Wingender J, Neu T, Flemming HC. Microbial Extracellular Polymeric Substances: Characterization, Structure, and function. Berlin: Springer-Heidelberg; 1999.
6. Flemming HC, Wingender J. The biofilm matrix. Nat Rev Microbiol. 2010; 8: 623–633. doi:10.1038/ nrmicro2415PMID:20676145
7. Gibbs RJ. Effect of natural organic coatings on the coagulation of particles. Environ Sci Technol. 1983; 17: 237–240. doi:10.1021/es00110a011PMID:22304641
8. Shang QQ, Fang HW, Zhao HM, He GJ, Cui ZH. Biofilm effects on size gradation, drag coefficient and settling velocity of sediment particles. Int J Sediment Res. 2014; 29: 471–480.
9. Headley JV, Gandrass J, Kuballa J, Peru K, Gong Y. Rates of sorption and partitioning of contaminants in river biofilm. Environ Sci Technol. 1998; 32: 3968–3973.
10. Black KS, Tolhurst TJ, Paterson DM, Hagerthey SE. Working with natural cohesive sediments. J Hydraul Eng-ASCE. 2002; 128: 2–8.
11. De Brouwer JFC, Wolfstein K, Ruddy GK, Jones TER, Stal LJ. Biogenic stabilization of intertidal sedi-ments: the importance of extracellular polymeric substances produced by benthic diatoms. Microb Ecol. 2005; 49: 501–512. PMID:16052376
12. Gerbersdorf SU, Jancke T, Westrich B, Paterson DM. Microbial stabilization of riverine sediments by extracellular polymeric substances. Geobiology. 2008; 6: 57–69. doi:10.1111/j.1472-4669.2007. 00120.xPMID:18380886
13. Amos CL, Bergamasco A, Umgiesser G, Cappucci S, Clouthier D, DeNat C. The stability of tidal flats in the Venice Lagoon–the results of in situ measurements using two benthic, annular flumes. J Marine Syst. 2004; 51: 211–241.
14. Sutherland TF, Amos CL, Grant J. The effect of buoyant biofilms on the erodibility of sublittoral sedi-ments of a temperate microtidal estuary. Limnol Oceanogr. 1998; 43: 225–235.
15. Underwood GJ, Paterson DM. The importance of extracellular carbohydrate production by marine epi-pelic diatoms. Adv Botanical Res. 2003; 40: 183–240.
16. Friend PL, Ciavola P, Cappucci S, Santos R. Biodependent bed parameters as a proxy tool for sedi-ment stability in mixed habitat intertidal areas. Coastal Shelf Res. 2003; 23: 1899–1917.
18. Droppo IG, Amos CL. Structure, stability and transformation of contaminated lacustrine surface fine-grained laminae. J Sediment Res. 2001; 71: 717–726.
19. Droppo IG. Biofilm structure and bed stability of five contrasting freshwater sediments. Marine Freshwa-ter Res. 2009; 60: 690–699.
20. Fang HW, Wang GQ. Three-dimensional mathematical model of suspended-sediment transport. J Hydraul Eng-ASCE. 2000; 126: 578–592.
21. Samaras AG, Koutitas CG. Modeling the impact of climate change on sediment transport and morphol-ogy in coupled watershed-coast systems: A case study using an integrated approach. Int J Sediment Res. 2014; 29: 305–315.
22. Liu C, Sui JY, He Y, Hirshfield F. Changes in runoff and sediment load from major Chinese rivers to the Pacific Ocean over the period 1955–2010. Int J Sediment Res. 2013; 28: 486–495.
23. Huang L, Fang HW, Fazeli M, Chen YS, He GJ, Chen DY. Mobility of phosphorus induced by sediment resuspension in the Three Gorges Reservoir by flume experiment. Chemosphere. 2015; 134: 374– 379. doi:10.1016/j.chemosphere.2015.05.009PMID:25978560
24. Yao QZ, Yu ZG, Chen HT, Liu PX, Mi TZ. Phosphorus transport and speciation in the Changjiang (Yangtze River) system. Appl Geochem. 2009; 24: 2186–2194.
25. Fang HW, Rodi W. Three-dimensional calculations of flow and suspended sediment transport in the neighborhood of the dam for the Three Gorges Project (TGP) reservoir in the Yangtze River. J Hydraul Res. 2003; 41: 379–394.
26. Liu Y, Yao HY, Huang CY. Assessing the effect of air-drying and storage on microbial biomass and community structure in paddy soils. Plant Soil. 2009; 317: 213–221.
27. Wu ZC, Huang YY, Chen HQ, Zhang SF, Mai SH. The chemical species present and their effects on zeolite granules in zeolite-activated sludge system. Environ Pollut Control. 2005; 27: 177–180. 28. Zhao HM. Experiment on particle's surface morphology after biofilm vegetating. The 33rd IAHR
Con-gress: Water Engineering for a Sustainable Environment; 2009; Vancouver, Canada.
29. Zhao HM, Fang HW, Chen MH. Floc architecture of bioflocculation sediment by ESEM and CLSM. Scanning. 2011; 33: 437–445. doi:10.1002/sca.20247PMID:21660993
30. Grabowski RC, Droppo IG, Wharton G. Erodibility of cohesive sediment: The importance of sediment properties. Earth-Sci Rev. 2011; 105: 101–120.
31. Hagadorn JW, Mcdowell C. Microbial influence on erosion, grain transport and bedform genesis in sandy substrates under unidirectional flow. Sedimentology. 2012; 59: 795–808.
32. Chen MH, Fang HW, Huang L. Surface charge distribution and its impact on interactions between sedi-ment particles. Ocean Dynam. 2013; 63: 1113–1121.
33. Fang HW, Chen MH, Chen ZH, Zhao HM, He GJ. Simulation of sediment particle surface morphology and element distribution by the concept of mathematical sand. J Hydro-Environ Res. 2014; 8: 186– 193.
34. Fang HW, Shang QQ, Chen MH, He GJ. Changes in the critical erosion velocity for sediment colonized by biofilm. Sedimentology. 2014; 61: 648–659.
35. Viparelli E, Solari L, Hill KM. Downstream lightening and upward heavying: Experiments with sediments differing in density. Sedimentology. 2015; 62: 1384–1407.
36. Watanabe R, Yamasaki K, Kusuda T. Experimental study on the effect of biofilm for bed mud erosion in annular flume. Proceeding of the 4th International Conference on Scour and Erosion; 2008; Tokyo, Japan.