Vol-7, Special Issue-Number2-April, 2016, pp1009-1017 http://www.bipublication.com Case Report
Evaluation of correlation relationship between standard penetration test and
shear wave velocity at Persian Gulf industrial town
Alireza Akbari1,* and Adel Asakereh2
1MSc Student of Geotechnical Engineering,
Department of Civil Engineering, Hormozgan University, Hormozgan, Iran.
2Assistant Professor, Department of Civil Engineering,
Hormozgan University, Hormozgan, Iran,
Corresponding author, E-mail addresses: [email protected]
ABSTRACT
Variation in shear wave velocity with depth is among important essential parameters in geotechnical analyses and investigations including assessment of site reaction and site classification with respect to dynamic designs. Among the indirect methods, is determination of shear wave velocity using the Standard Penetration Test (SPT) number, which using the results obtained from it one could extract many strength parameters of the soil such as the soil friction angle, un-drained shear strength, bearing capacity, modulus of elasticity, liquefaction etc. also this test is relatively inexpensive and straightforward. In this article, like studies performed by other researchers, by conducting field experiments at Persian Gulf industrial town, a correlation relationship is derived between the standard penetration number and the shear wave velocity. The obtained results showed that the soil layers at the area were CL, ML and SM with an average compaction. Variation of shear wave velocity was in the range 100-183 m/s and variation of the standard penetration number was in the range of 10-35 blows at 0-40 m depth. The obtained relationship between shear wave velocity and standard penetration number is a direct relationship which by increase in the SPT number, the shear wave velocity increases, too. Also the results and obtained relationship has a good compatibility with the results obtained by other researchers.
Key words: shear wave velocity, Correlation relationship, soil depth, Persian Gulf.
1. INTRODUCTION
In geotechnical engineering, many soil parameters including the stiffness and strength of the soil, relative density, bearing capacity and soil internal friction angle are related to the standard penetration test number (N-SPT). SPT is the necessary test in most important projects in Iran. At the same time when geological exploration is not cost effective in some projects, using the SPT results one could determine the needed parameters. This issue has motivated many researchers to seek a relationship between shear wave velocity and other physical features of soil, especially the standard penetration number in
and SPT. The empirical relations concerning these two parameters are functions of the soil type, density, soil water content, age and geological history, fine grain percentage, quality of tests, the way the test is performed and the equipment used. The relationships could be different with respect to the ground nature and the soil type, hence for each area a relationship specific to that area should be used for prediction of shear wave velocity. So in this project, the relationship between shear wave velocity and standard penetration number is investigated with respect to the alluvial deposits of the Persian Gulf industrial town, where the data and information from the geotechnical studies, such as the SPT results for 8 boreholes with a 25 m depth are used. Also in one of the boreholes, the results of the Down-hole seismic tests for measurement of compressive and shear waves have been used. The aim of this research is to present an empirical relationship between standard penetration number and shear wave velocity also estimation of shear wave velocity in an indirect method from the SPT data. This study is based on presenting an empirical and acceptable relationship for initial estimation of the specific shear wave velocity.
1-1 Standard Penetration Test (SPT)
Standard penetration test (SPT) is an in-situ dynamic penetration test, and a parameter
necessary to be determined in most civil projects. In geotechnical engineering, many soil parameters including the stiffness and strength of soil, relative density, compaction rate, and cohesion and soil internal friction angle are related to the N-SPT. It should be mentioned that due to limitation in accurate access to all soil parameters, the relationships are just approximations [1, 2]. Using SPT as a tool for assessment of liquefaction potential was discussed for the first time after extensive destructions cause by liquefaction during the destructive earthquakes of the year 1964 i.e. the Good Friday Earthquake in Alaska with a magnitude of 8 and the Niigata Earthquake in Japan with a magnitude of 7.5 [3]. SPT was performed according to the ASTM D 1586 standard [4]. The test uses a split-barrel sampler which is driven into the ground at the bottom of a bore hole by blows from a standard hammer with a mass of 63.5 kg falling through a distance of 760 mm. the sample tube is driven 15 cm into the ground and then the number of blows needed for the tube to penetrate each 15cm up to a depth of 45cm is recorded. The N-SPT is the sum of the number of blows required for the second and third 15 cm of penetration which is the basis of measurement of granular soils compaction or stiffness of the fine grained soils. In Fig. 1 a view of the SPT setup and method of performing the
test are illustrated.
1-2 Shear wave velocity
Accurate estimation of shear wave velocity of subsurface layers has many applications in various engineering branches including geology, geotechnics, structural and earthquake engineering. In many classification procedure, concerning the site effects, use has been made of the average shear wave velocity at upper 30 m depth, also the empirical relations between
and site amplification have been presented [5,6]. For determining the subsurface layers specifications, different methods such as subsurface, Down-hole, SCPT, reflection method and the spectral analysis of surface waves have been implemented.
Among indirect methods of determining shear wave velocity, is the use of SPT field test results. Through various diagrams and tables, many physical properties of soil could be extracted knowing the Standard Penetration number (N). This test is relatively inexpensive and straightforward and could be performed even for small size projects.
In this research shear wave velocity is determined through Down-hole seismography method using the ABEM RAS 24 seismograph, according to the ASTM D7400 standard. In this method using a seismic source (explosion or hammer blow) in a specified point of the ground, the seismic P or S waves or both are produced and the seismic waves are received by the receiver in the borehole [7]. To begin the test in the first stage, the wave receivers in the borehole and at the ground level are installed in a specified level and then the seismic waves are received, then in the second stage with respect to the conditions and the objectives of project, the receiver is transferred to a lower depth and by repeating the procedures stated above, the seismic waves are received again. By repeating this process, finally we reach the desired final depth [8]. In this way the travel time between source and receiver is recorded and then using the wave's travel time, the seismic wave velocity is determined (Fig. 2)
2- DISCUSSION AND INVESTIGATION
There are many relationships for estimation of shear wave velocity from the N-SPT in the literature. Some of these relationships are proportional to type of the soil material including sand silt and clay, while some other are related to the depth, percentage of fine grain and/or modified penetration resistance. Generally, most of the relationships presented in the literature are in the form , where A, and B, are
constant coefficients which are estimated from the statistical methods and regression of the available
data set. In Table 1, some of the proposed relationships by researches, concerning relation between N-SPT and for various soils including
clay, silt and sand are shown in brief. Up to now many empirical correlations have been presented concerning shear wave velocity and N-SPT by native and foreign researchers. A large number of these relationships are derived for a specific soil of an area and are based on limited experiments; a few of the most common correlations are presented in Table 1 [9, 10, 11, 12, 13, 14, 15].
Table (1) Empirical correlation between N and
Correlation between Vs and N Soil Type ID Authers All Soils A
Anbazhagan and Sitharam (2006)
All Soils E Dikmen (2009) Sand F Dikmen (2009) Silt G Dikmen (2009) All Soils K Fujiwara (1972) All Soils T
Hasancebi and Ulusay (2006)
All Soils Z Imai (1977) Sand AA Imai (1977) Clay AB Imai (1977) All Soils AU
Kiku et al (2001)
Sand BO Shibata (1970) All Soils BP Shibata (1970)
In continuation, the results and empirical relationships between shear wave velocity and N-SPT are presented for Persian Gulf Industrial town, and the results are assessed and compared to the results obtained by other researchers.
2-1 Study area: Location of Persian Gulf industrial town is very distinctive in that it is close to the large industries such as Hormozegan Steel
Co., Persian Gulf Special Economic Zone, Iran Shipbuilding & Offshore Industries Complex Co. and Shahid Rejaee and Bahonar ports (Fig. 3).
Fig. (3) Location of industrial town of Persian Gulf
2-2 performing filed tests
In order to assess the compaction condition of subsurface layers and determination of their strength properties and stiffness, the Impact Test and SPT were performed at 1.5m depth. The results of standard penetration test showed that the granular soil at the boreholes of the project, up to a depth of 10 m, had a loose to average relative compaction and at other depths of excavation had
a dense to very dense relative compaction. In order to complete the geological information and necessity of assessing dynamic parameters of the layers, Down-hole seismic tests were performed at BH-8 borehole, using the compaction and shear waves. The results obtained from the shear and compressive wave velocity tests are given in Table 2
Table (2) Average shear wave velocity at borehole location
soil class D (soft soil). In this code a shear wave velocity larger than 750 m/s corresponds to the rock type soil, and an average shear wave velocity greater than 1500 m/s corresponds to the hard- rock type soil.
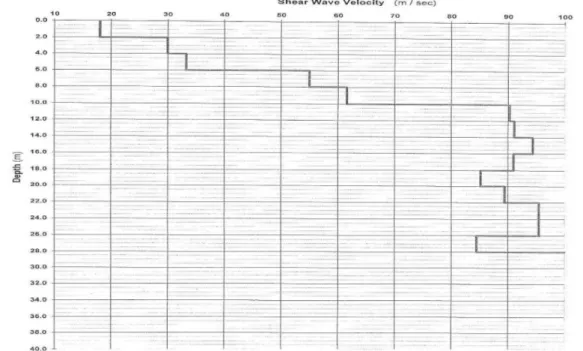
Fig. (4) Variation of shear wave velocity with depth
2-3 Determination of correlation expression
Considering borehole No.8, the results from shear wave velocity and standard penetration tests are investigated and finally the data corresponding to this borehole is used for the purpose of comparison and presenting the relationships. In
Table 3, the characteristics of subsurface soil layers are shown for borehole No. 8 and as is seen the types of soil layers in this area are composed of silt, sand and a little bit clay which lacks cohesion, having an average to low compaction.
Table(3) Type and characteristics of soil for borehole No. 8
BH-8 Descrioption
Soil type
Depth
Cohessionless and dense SM
0-1
Adhesion and firm CL
1-2
Adhesion and firm CL
2-4
Adhesion and medium density ML
4-6
Adhesion and medium density ML
6-10
Adhesion and medium density SM
10-12
Adhesion and firm CL
12-16
Adhesion and medium density ML
16-18
Adhesion and medium density ML
19-20
Adhesion and firm CL
20-28
Adhesion and medium density ML
28-32
Adhesion and medium density SM
32-40
3. RESULTS
y = 0.0323x2.0039
0
5
10
15
20
25
30
35
40
45
0 10 20 30 40
D
e
p
th
N spt
Fig. (5) Variation of standard penetration number with depth
According to the obtained results for borehole No. 8, the relationship between shear wave velocity and standard penetration number is a direct one so that by increase in N-SPT, the shear wave velocity also increases. Considering that the average shear wave velocity also has been measured during the field tests, the results corresponding to the average shear wave velocity against N-SPT are shown in Fig. 6
Fig.(6) Variation of shear wave velocity against standard penetration number
Regarding that the soil of the area is generally in the form of sand and silt or a mixture of both and among them, in some layers, there are clayey soils with cohesion and relatively stiff consistency, the soil of the area could be defined as fine grained sandy silt lacking cohesion and with an average relative compaction. And finally the relationship obtained for this type of soil is presented as expression 1.
(1)
3.1 Comparison between the obtained results and other research studies
Fig. (7) Comparing different empirical relations between V_S and N
4. CONCLUSION
- In this article, an empirical relationship is presented between standard penetration number and shear wave velocity. This research is based on presenting an approximate and acceptable relationship for initial estimation of shear wave velocity. In this study use has been made of the measured data from the area of Persian Gulf industrial town of, located in Bandar Abbas, and the following results could be stated here:
- With increase in depth, the value of standard penetration number increases, in other words by increase in depth, the compaction and other strength properties of soil have increased. According to the results from borehole No. 8, it is observed that the relationship between shear wave celocity and N-SPT is a direct one and by increase in N-SPT the shear wave velocity increases, too. - Regarding that the soil of the area is generally in the form of sand and silt or a mixture of both and among them, in some layers, there are clayey soils with cohesion and relatively stiff consistency, the soil of the area could be defined as fine grained sandy silt lacking cohesion and with an average relative compaction. And finally the relationship obtained for this type of soil could be given in the following form:
5. REFERENCES
[1] Management and Planning Organization of Iran, 2001, instructions Standard Penetration
Test (SPT) in geotechnical studies, "National Standard No. 8446. Iran
[2] Das, Braja. M., 1941, Principles of Geotechnical Engineering, "the translation of Shapur Tahvny, volumes I and II, published by the Institute of Pars-law, Fifth Edition, Tehran. [3] Seed, H. B. (1979), “Soil Liquefaction and
Cyclic Mobility Evaluation for Level Ground During Earthquake,” Journal of Geotechnical Engineering, ASCE, 105(2), pp. 201-255. [4] ASTM D1586-11, Standard Test Method for
Standard Penetration Test (SPT) and Split-Barrel Sampling of Soils, ASTM International, West Conshohocken, PA, 2011
[5] Borcherdt, R.D., 1994. Estimates of site dependent response spectra for design (methodology and justification). Earthquake Spectra 10 (4), 617-654
[6] Dobry, R., Borcherdt, R.D., Crouse, C.B., Idriss, I.M., Joyner, W.B., Martin, G.R., Power, M.S., Rinne, E.E., Seed, R.B., 2000. New site coefficient and site classification system used in recent building code provisions. Earthquake Spectra 16 (1), 41-67.
[7] ASTM D7400. (2008)”Standard Test Method for down hole Seismic Testing”.
[8] ISRM. (1988)” Suggested Methods for Seismic Testing Within and Between Borreholes”,International Journal of Rock Mechanics and Mining Sciences & Geomechanics, Abstracts,25:449-472.
and the results of standard penetration test (SPT) for soils of Iran. Proceedings of the Fifth National Congress of Civil Engineering, Ferdowsi University of Mashhad.
[10] Anbazhagan, P & Sitharam, T.G. (2006), “Evaluation of Dynamic Properties and Ground Profiles UsingMASW: Correlation Between N60 s and,” 13th Symposium on Earthquake Engineering, Indian Institute of Technology, Roorkee.
[11 ] Baziar, M.H. et al. (1998), “The Relation of Shear Wave Velocity and SPT for Soils in Iran,” 11 ThEuropean Conference on Earthquake Engineering, Balkema, Rotterdam. [ 12] Bowles, J.E. (1996), “Foundation Analysis
and Design,” 5Edn, McGraw-Hill Book Company, New York.
[13] Scott, J.B. et al. (2010), “Shear Wave Velocity as a Statistical Function of Standard Penetration Test Resistance and Vertical Effective Stress at Caltrans Bridge Sites,”
Pacific Earthquake Engineering Research Centre, University of California.
[1 4] Sy, A. et al. (1995), “BPT-SPT Correlations for Evaluation of Liquefaction Resistance In GravellySoils,” Session on Dynamic Properties of Gravelly Soils, ASCE National Convention, San Diego, California.