Vol-7, Special Issue-Number5-July, 2016, pp399-406 http://www.bipublication.com
Research Article
The Effect of Site Conditions on Characteristics of
Seismic Design in Behbahan
Amirreza Bahrebar, Moslem momni asl and Farzane barati
Young Researchers and Elide Club,
Yasuj Branch, Islamic Azad University. Yasuj, Iran
Abstract
Iran is one of the world's seismically active countries so that it experiences many small to medium earthquakes annually and a large earthquake every ten years. Due to seismotectonic conditions and special geographical and climatic position, Iran has the potential to create numerous severe earthquakes. Therefore, seismicity studies and seismic zonation of seismic zones of the country are necessary. In this article, the effect of local site conditions on the characteristics of seismic design in Behbahan will be examined. After analyzing the seismic hazard for Behbahan through deterministic and statistical methods and preparing the necessary geotechnical models based on available data, the ground response will be analyzed for different parts of the city based on four inputs and acceleration level estimated for bedrock through the equivalent linear method and by means of Deep Soil program. Finally, through the analysis of the obtained results, the seismic profiles of the ground surface for different parts of the city will be presented.
Keywords: site conditions, seismic microzonation, ground response, resonance spectrum, site period
1. INTRODUCTION
Site conditions affect the seismic properties of the bedrock and with respect to the properties of soil layers and the region geology, seismic parameters on the ground surface will change. Observation of the past devastating earthquakes indicates that topography, bedrock origin, origin and geometry of sedimentary soils are the factors that greatly influence the vibration amplitude of bedrock. Site conditions are those local factors that like a filter have aggravating or mitigating effect on the vibrations of bedrock in each area and can also affect the acceleration, velocity, displacement, and
also the dominant period of earthquake
significantly [1]. When the natural frequency of the structures and the content of ground surface vibration frequency are close to each other, the site conditions will have augmenting effects. Therefore, in seismic areas, seismic studies and
seismic hazard zoning are essential and highly important for the site safety. Through seismic zoning, the homogenous and similar areas will be identified in terms of selected parameters and by calculating the earthquake parameters in the ground surface such as acceleration and period it is possible to determine the kind of structures that the site is safe for their construction. Since Behbahan is located around the active faults and folding and considering the reported historical earthquakes and the instrumentally recorded ones, it has high seismic potential. This research has been carried out in order to determine the safety of structures site and to help the designers build earthquake-resistant structures in Behbahan. 2. Ground Response Analysis Methods
called the ground response analysis [2].Thus; the ground response problem will in fact change to determining the response of the soil mass to the motion of stone bed beneath it. The vibration of a flexible environment is not instantaneously felt in other point, so that some time is needed to feel the effects of vibration in other points. The vibration impacts are felt through the waves that propagate. The propagation of theses waves depends on the stiffness and damping characteristics of the
environment. Geological and geotechnical
materials are considered as the environment and their dynamic response to dynamic and temporal loads such as earthquakes, explosions, and vibrations resulting from traffic will be based on the wave propagation problems. Ground response analysis can be done by one, two, and three-dimensional modeling. These methods are different in terms of their ability to model the geometry of problem and wave or their assumption to model ground response as well as the analytical method they use to solve motion equations [3]. One-dimensional ground response analysis is useful for horizontal sites or low-slope sites in which the boundaries between layers are parallel, but inclined and non-linear surfaces of ground, heavy and hard structures, buried structures or walls and tunnels all need
two-dimensional and even sometimes
three-dimensional analysis [4]. Considering the non-linear behavior of soil, each one of one- two- and three-dimensional methods can be modeled as equivalent linear and non-linear ones. Among these methods, the equivalent linear method is more acceptable and popular among the engineers due to its relative simplicity and its familiar and simple parameters [2].
2.1. Preferred Method for Analysis
In this study, one-dimensional equivalent linear method has been used for the ground response analysis. In this approach which is based on the viscoelastic behavior of soil, along with the changes of soil properties, stepwise linear analysis is repeated until the solution to problem is obtained within the strains compatibility[5]. The
software which is used (Deep Soil) is based on the direct and continuous solution of the waves
propagation equation which computes the
responses of one system consisting of
homogenous and viscoelastic layers against the shear waves. Equivalent liner model which is just an approximation of real nonlinear behavior of soil works within the domain of frequency [6]. In order to describe the soil behavior in equivalent linear analysis, the shear modulus and damping coefficient which are called the equivalent linear parameters of materials are used. Parameters of shear modulus and damping coefficient for each layer of the soil are constant during the ground shaking [3, 7] and are determined based on the produced strain in each layer. The required parameters for the equivalent linear analysis in this software include the shear wave velocity and the specific gravity of the soil profile of the analyzed site, bedrock depth, changes curve of shear modulus and damping coefficient based on the strain, maximum acceleration of stone bed and different accelerograms of the earthquake.
3. Soil Profile of the Analyzed Site and Determining the Bedrock Location
In order to analyze the wave propagation and the effect of alluvium during the earthquake the features such as the type of layers, thickness of layers, density, shear wave velocity, groundwater level, and bedrock location should be determined for each site. Due to available limitations particularly the financial issues, it was not possible to make new logs in the studied area and in order to get information about the geotechnical condition of the studied region the results of laboratory or filed tests conducted in the area were collected from the geotechnical reports of public and private institutions such as the studies
conducted on different projects like the
Behbahan so that more precise information could be obtained about the soil layers profiles. Therefore, the data obtained from geotechnical studies are used to analyze the soil layers response during the earthquake. In this research about 16
geotechnical logs and wells have been
investigated and the logs are of different types up to the depth of 20 m. The map of geotechnical logs is displayed in Figure (1). The data obtained from Geology Organization and Oil Company refer to the fine-grained soil in Behbahan and it can be concluded that the soil of Behbahan below the depth of 20 m is clay with low plasticity
properties (PI = 10) and density of 1.95 (
s= 1.95g/cm3). Of course, for the analysis of each log for the depths of 20 m and below, it has been tried to estimate SPT number to determine the shear wave velocity based on the upper layers of the log. Since the density (specific weight) has no significant effect on the analysis of layers, the soil density at depths below 20 m was considered to be
the constant amount of 1.95 (
s=1.95). Theinformation obtained from geological maps and other sources indicate that the thickness of alluvial sediments in Behbahan is 250 t0 350 m. in the
conducted analyses for calculating the
acceleration of design, different depths of 250, 300, and 350 m were assumed for ach log. In order to determine the shear wave velocity, 26 empirical relationships have been used. The relationships determine the shear wave velocity depending on the availability of one or several
kinds of information such as SPT number, layer depth, type of geological texture, and type of soil. In order to prepare the map of seismic hazard zoning in Behbahan by means of Deep Soil program and equivalent linear method, only geotechnical parameters of density and shear wave velocity are required which were separately specified for each log. An example of geotechnical characteristics of one of the logs is displayed in Table (1). With regard to fouraccelerograms of different earthquakes and
Figure (1): The location map of representative logs
various thicknesses of soil as 250, 300, and 350 m, 12 analyses for each log and ultimately 192 analyses for 16 available logs were carried out. According to the obtained information in those analyses, the bedrock in Behbahan is assumed to be rigid.
Table (1): Characteristics of one of the logs
Soil type Velocity
(m/s) SPT
depth Soil
type Velocity
(m/s) SPT
depth
CL
CL
CL CL CL 438.7
461.9
480.9 497.3 511.7 530.8 552.7 567.1 588.4 606.9 50
50
50 50 50 50 50 50 50 50 70
90
110 130 150 180 220 250 300 350
GC-GM
CL CL C 115.6
221.9
262.4 236.2 283.8 293.8 305.8 342.8 370.2 410.8 13
13
50 50 50 50 50 50 50 50 0
2
3.2. Changes Curve of Shear Modulus and Damping Ratio Based on Strain
The curve of shear modulus and damping ratio of soil based on strain has been presented in Deep Soil program by different researchers for various types of soil. Shear modulus and damping of soils depend on effective plasticity and limiting pressure. Shear modulus of soils with high plasticity is more similar in the cyclic strain amplitude than the shear modulus of soils with low plasticity and the damping of soils with high plasticity is less similar in the cyclic strain amplitude than the damping of soils with low plasticity. The changing behavior of shear modulus and mapping of soils with strain can be observed in Figure (2). In present study, the curve of shear modulus and damping ratio with strain presented in Deep Soil program by Vuctic and Dobry for clay soil with PI of 0 to 15% and the curve of reduction of modulus and damping ratio with strain presented by Sid and Edris for coarse soil with moderate gravel have been used.
Figure (2):Shear modulus and damping changes based on strain for soils with different plasticit
3.3. Seismic Hazard Analysis
With respect to nonlinear behavior of soil and different responses under various accelerations, suitable accelerations had to be selected for analysis. Thus, the seismic hazard for the city of Behbahan was estimated through analytical and statistical methods. A comprehensive study was conducted on the seismotectonic of the desired area and the major and minor faults and their seismicity were identified based on the length of faults and the data of historical and 20th century earthquakes. In order to determine the seismic
coefficient of the area, Gutenberg-Richter
equation was extracted. The equation for the earthquakes in the past 200 years and as far as the radius of 250 km from Behbahan was determined as the following [8].
(1) 3 < M < 6.5
s
c
M
LogN
5
.
8567
0
.
8216
In this equation, Nc is the cumulative frequency of earthquakes and Ms is the surface magnitude of the earthquakes.
faults and by using attenuation relations and the functions of final values. According to the conducted studies in Behbahan, for the useful life of 100 years and the risk of 10% and the return period of 950 years, the probable peak acceleration for Behbahan bedrock was estimated to be 0.35 g and the analysis was performed accordingly [8].
3.4. Accelerogram
With respect to the complex behavior of the Earth and soil under various final accelerograms, an accelerogram should be used which has the seismic characteristics of the studied area in terms of frequency content, maximum amplitude of oscillations, and duration of ground shaking [9]. The most ideal mode is to use accelerograms which are obtained in the desired area. Since no accelerogram is available from the floor stone of the area, the accelerograms associated with similar
earthquakes were inevitably used. Four
accelerograms related to the earthquakes of Gilroy (recommended by Deep Soil program), Loma Prieta record, Coyote Gilroy record, and Coaling record which were nearly similar to the accelerogram of the studied area were used which were scaled based on the peak acceleration of
max
a
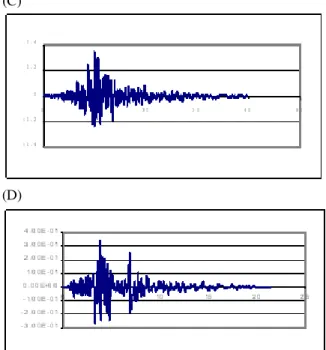
= 0.35g. Figure (3) shows the time history ofacclerograms after correction for 0.35g. (A)
(B)
(C)
(D)
Figure (3): Accelerograms used in the research, (a) Giloryaccelerogram, (b) Coyote Giloryaccelerogram, (c) Coaling accelerogram, (d) Loma Prietaaccelerogram
4. Ground Response Analysis Results
Table (2): Peak ground acceleration and site period for various log (soil sickness of 300 m)
(
Peak Ground Acceleration (P.G.A.) ُ
Site Time Period, Ts (Sec) LOG
number GILR COYO COAL LOMA GILR COYO COAL LOMA AVE
29 / 0 25 / 0 27 / 0 28 / 0 34 / 0 70 / 3 94 / 2 70 / 2 94 / 2 1 24 / 0 25 / 0 27 / 0 28 / 0 34 / 0 70 / 3 94 / 2 70 / 2 94 / 2 2 22 / 0 18 / 0 22 / 0 22 / 0 26 / 0 17 / 4 13 / 3 13 / 3 23 / 3 3 20 / 0 18 / 0 17 / 0 22 / 0 23 / 0 55 / 4 45 / 3 45 / 3 57 / 3 4 26 / 0 21 / 0 25 / 0 26 / 0 31 / 0 17 / 4 13 / 3 13 / 3 57 / 3 5 21 / 0 18 / 0 18 / 0 23 / 0 25 / 0 55 / 4 45 / 3 45 / 3 57 / 3 6 21 / 0 18 / 0 18 / 0 23 / 0 25 / 0 55 / 4 45 / 3 45 / 3 57 / 3 7 21 / 0 18 / 0 18 / 0 22 / 0 26 / 0 55 / 4 45 / 3 45 / 3 57 / 3 8 24 / 0 18 / 0 24 / 0 23 / 0 30 / 0 55 / 4 45 / 3 45 / 3 57 / 3 9 20 / 0 18 / 0 17 / 0 22 / 0 23 / 0 55 / 4 45 / 3 45 / 3 57 / 3 10 20 / 0 18 / 0 18 / 0 22 / 0 23 / 0 55 / 4 45 / 3 45 / 3 57 / 3 11 21 / 0 18 / 0 18 / 0 22 / 0 25 / 0 55 / 4 45 / 3 45 / 3 57 / 3 12 21 / 0 18 / 0 18 / 0 23 / 0 26 / 0 55 / 4 45 / 3 45 / 3 57 / 3 13 20 / 0 18 / 0 17 / 0 22 / 0 23 / 0 55 / 4 45 / 3 45 / 3 57 / 3 14 19 / 0 18 / 0 16 / 0 20 / 0 23 / 0 00 / 5 17 / 4 70 / 3 17 / 4 15 19 / 0 18 / 0 16 / 0 20 / 0 23 / 0 00 / 5 17 / 4 70 / 3 17 / 4 16
Comparison of features and tables in general shows that as the soil properties remain constant and its depth increases, the rate of peak ground accelerations decreases and for all specified points, the peak ground acceleration is less than the peak bedrock acceleration and the high thickness of alluvium and the fine-grained soil causes the attenuation behavior of alluvium. It can be observed through the review of features that the changes amplitude of peak ground acceleration (PGA)is in the range of 0.18g to 0.31g and the changes trend of peak acceleration is north-south and the northern area and a region in the east of Behbahan had the highest rate of accelerations. The review of the results of Table (2) and comparison of level curves based on period show that as the alluvium thickness increases, the rates of the periods increase, too. The periods are ranged from 2.4 to 5 s and they have northern-southern increasing trend. The highest rate of period belongs to southeast and southwest of Behbahan and the lowest rate of period is seen in the north of the region which is consistent with the same areas with the peak acceleration. Feature (4) shows the peak identical-acceleration lines based on the mean of peak accelerations resulting from 4 earthquakes and feature (5) displays the identical-period lines of the site based on the mean of
periods resulting from 4 earthquakes for the soil thickness of 300 m in Behbahan.
5. Acceleration Response Spectra, Resonance Spectra, and changes profile of Peak Acceleration and Depth
profile of peak acceleration and depth are respectively displayed in Features (6), (7), and (8).
Figure (6): An example of acceleration response spectrum obtained from waves propagation analysis in Behbahan for Log No.1
Figure (7): An example of amplification Spectrum obtained from waves propagation analysis in
Figure (8): An example of changes profile of peak acceleration and depth in Behbahan for Log No. 1
6. CONCLUSION
This research was carried out in order to determine the effect of the conditions of site soil on seismic characteristics of bedrock in Behbahan. First of all, the region had to be investigated in terms of seismicity and the probability of the occurrence of severe earthquakes in the future. Therefore, the data related to the earthquakes of 1803 to 2003 within the radius of 250 km from Behbahan were collected and the active faults within the range of 100 km from Behbahan were identified and earthquake-fault hazard analysis was performed thorough deterministic and probabilistic methods and based on various damping relations, Gutenberg-Richter function, time distribution functions, and functions of final values for the city of Behbahan, the seismic characteristics of the bedrock such as the return period, magnitude, and probable peak acceleration for the return periods of 25, 50, and 100 years and the risks of 64, 37, 10, and 5% were estimated. After calculating the peak acceleration of Bedrock in Behbahan, the data related to geology and soil layers were collected from the geotechnical reports of public and private institutions such as the studies conducted on different projects like the construction of residential buildings, determining groundwater level, etc,.Due to lack of deep geotechnical logs, it has been attempted to make use of other available information in the depths of the soil layers such as the studies conducted by oil companies that were located around the city of Behbahan, so that more precise information could be obtained about the soil layers profiles. The data were analyzed by means of an equivalent liner analysis method and Deep Soil software and acceleration response spectrum, amplification spectrum, changes of peak acceleration and depth and zoning maps were prepared based on peak ground acceleration and site period.
comparison of features and tables shows that the changes amplitude of peak ground acceleration (PGA)is in the range of 0.18g to 0.31g and the changes trend of peak acceleration is north-south and as the soil properties remain constant and its depth increases, the rate of peak ground accelerations decreases and for all the logs, the peak ground acceleration is less than the peak bedrock acceleration and the high thickness of alluvium and the fine-grained soil causes the attenuation behavior of alluvium. Moreover, thick and soft sediments of the soil transfer greater ratio of longer periods into ground surface and as the depth increases, the periods increase, too. According to the obtained
Figure (5): Site period lines in Behbahan based on the mean of periods resulting from four earthquakes for the soil thickness of 300 m.
results it is recommended to build taller buildings in northern regions and shorter buildings in southern regions. Finally, it is recommended to develop buildings with shorter heights towards the south in Behbahan.
REFERENCES
1. Hatef, N., Bazyar, M.H. (2003). The effect of site factors on changing the nature of probable earthquake in Yasuj. Proceedings of the Sixth International Congress on Civil Engineering, Isfahan, Iran, May9-12, p. 234-239.
2. Keshavarz, A., Tabaroki, M. (2009).
Application of distributed computations in
potential analyses of ground response.
Proceedings of theEighth International
Congresson Civil Engineering, Shiraz, Iran, May 11-13.
3. Kwok, A.O.L, Stewart, J.P., Hashash, Y.M.A.,
Matasovic, N., Pyke., Wang, Z. and Yang, Z., (2007), Use of Exact Solutions of Wave
Propagation Problems to Guide
Implementation of Nonlinear Seismic Ground Response Analysis Procedures, Journal of
Geotechnical and Geoenvironmental
Engineering, ASCE, 133(11), pp. 1385-98.
4. Kramer S. Geotechnical Earthquake
Engineering, Prentice Hall, Upper Saddle River, New Jersey, 1996.
5. Mir Mohammad Hosseini, S.M., Safar Zadeh,
M. (1996). Micro-zoning southeastern Tehran against seismic waves amplification.
6. Robinson, D., Dhu, T., Venkatesan, S., Lam,
N., Wilson, J. and Jones, A., Site Respons Analysis – A Comparison of Methods and Scales, University of Melbourne
7. Aki, K, (1988), "Local Site Effects on Strong Ground Motion" ,Earthquak Engineering & Soil Dynamic.
8. Bazyar, M.H., Zahermand, S. (2010). The
effect of site conditions on Characteristics of seismic design in Tabriz by means of structural waves analysis and preparing design spectra.
Proceedings of theInternational
Congressonlightening and Earthquake, Jihad Daneshgahi of Kerman, Iran, April, 21-22.
9. Haeri, S.M., Haji Aliloo, M. (1995). The effect
of site conditions on characteristics of seismic design by means of structural waves analysis and preparing design spectra. Proceedings of theFourth International CongressonCivil Engineering, Isfahan, Second Volume, Soil
and Foundation, Sharif University of
Technology.
10.Youssef M. A. Hashash, (2009), Department of
Civil and Environmental Engineering,
University of lllinois at Urbana-Champaign, 89pp.
11.Architectural Institute of Japan (ALJ), (1993) Earthquake Motion and Ground Condition.
12.Seed H.B, Idriss, and Kiefer, F. W (1969)