ACPD
7, 15853–15872, 2007Discriminating raining from non-raining clouds at
mid-latitudes
B. Thies et al.
Title Page
Abstract Introduction
Conclusions References
Tables Figures
◭ ◮
◭ ◮
Back Close
Full Screen / Esc
Printer-friendly Version
Interactive Discussion Atmos. Chem. Phys. Discuss., 7, 15853–15872, 2007
www.atmos-chem-phys-discuss.net/7/15853/2007/ © Author(s) 2007. This work is licensed
under a Creative Commons License.
Atmospheric Chemistry and Physics Discussions
Discriminating raining from non-raining
clouds at mid-latitudes using Meteosat
Second Generation daytime data
B. Thies, T. Nauss, and J. Bendix
Laboratory of Climatology and Remote Sensing, University of Marburg, Germany
Received: 12 October 2007 – Accepted: 24 October 2007 – Published: 13 November 2007
Correspondence to: B. Thies ([email protected])
ACPD
7, 15853–15872, 2007Discriminating raining from non-raining clouds at
mid-latitudes
B. Thies et al.
Title Page
Abstract Introduction
Conclusions References
Tables Figures
◭ ◮
◭ ◮
Back Close
Full Screen / Esc
Printer-friendly Version
Interactive Discussion Abstract
A new method for the delineation of precipitation during daytime using multispectral satellite data is proposed. The approach is not only applicable to the detection of mainly convective precipitation by means of the commonly used relation between in-frared cloud top temperature and rainfall probability but enables also the detection of
5
stratiform precipitation (e.g. in connection with mid-latitude frontal systems). The pre-sented scheme is based on the conceptual model that precipitating clouds are charac-terized by a combination of particles large enough to fall, an adequate vertical exten-sion (both represented by the cloud water path (cwp)), and the existence of ice parti-cles in the upper part of the cloud. The technique considers theVIS0.6and theNIR1.6
10
channel to gain information about the cloud water path. Additionally, the channel diff er-ences∆T8.7−10.8 and∆T10.8−12.1 are considered to supply information about the cloud phase. Rain area delineation is realized by using a minimum threshold of the rainfall confidence. To obtain a statistical transfer function between the rainfall confidence and the channel differences, the value combination of the four variables is compared to
15
ground based radar data. The retrieval is validated against independent radar data not used for deriving the transfer function and shows an encouraging performance as well as clear improvements compared to existing optical retrieval techniques using only IR thresholds for cloud top temperature.
1 Introduction
20
The detection of rainfall by means of optical sensors aboard geostationary (GEO) weather satellites has a long tradition as they provide information about the spatio-temporal distribution of this key parameter of the global water cycle in a high spatial and temporal resolution (e.g. Adler and Negri, 1988).
Most retrieval techniques developed so far for GEO systems are based on the
re-25
proba-ACPD
7, 15853–15872, 2007Discriminating raining from non-raining clouds at
mid-latitudes
B. Thies et al.
Title Page
Abstract Introduction
Conclusions References
Tables Figures
◭ ◮
◭ ◮
Back Close
Full Screen / Esc
Printer-friendly Version
Interactive Discussion bility. Such retrievals which are often referred to as IR retrievals are appropriate for
the tropics where precipitation is generally linked with deep convective clouds that can be easily identified in the infrared and/or water vapour channels (e.g. Levizzani et al., 2001; Levizzani, 2003) but show considerable drawbacks in the mid-latitudes (e.g. Ebert et al., 2007; Fr ¨uh et al., 2007) where great parts of the precipitation
orig-5
inates from clouds formed by widespread frontal lifting processes in connection with extra-tropical cyclones (hereafter denoted as advective/stratiform precipitation).
These clouds are characterized by relatively warm top temperatures and a more ho-mogeneous spatial distribution of cloud top temperature that differ not significantly be-tween raining and non-raining regions. Therefore, a threshold value for cloud top
tem-10
perature in the IR channel as used for deep convective clouds seems to be improper for a reliable rain area delineation and leads to an underestimation of the detected precipi-tation area in such cases. To overcome this drawback, Nauss and Kokhanovsky (2006, 2007) recently proposed a new scheme for the delineation of raining and non-raining cloud areas applicable to mid-latitudes using daytime multispectral satellite data from
15
the LEO system Terra-MODIS (Moderate Resolution Imaging Spectroradiometer, see Barnes et al., 1998). It is based on the assumption that precipitating clouds must have a combination of large enough droplets that can fall easily against updraft wind fields and a large enough vertical extension which favours the growth of precipitation droplets and prevents them from evaporation below the cloud bottom (see also Lensky and
Rosen-20
feld, 2003). Since neither the droplet spectrum nor the geometrical thickness of a cloud can be computed without additional theoretical assumptions, the effective droplet ra-dius (aef) (Hansen and Travis, 1974) and the cloud optical thickness (τ) can be used as a measure for the particle size and the cloud thickness. Consequently, precipitating cloud areas can be characterised by a combination of the effective droplet radius and
25
the optical thickness large enough to form precipitation (Nauss, 2006). Multiplying both parameters according to
lwp=2
3 ·aef ·τ (1)
ACPD
7, 15853–15872, 2007Discriminating raining from non-raining clouds at
mid-latitudes
B. Thies et al.
Title Page
Abstract Introduction
Conclusions References
Tables Figures
◭ ◮
◭ ◮
Back Close
Full Screen / Esc
Printer-friendly Version
Interactive Discussion one gets the liquid water path (lwp) which in turn is directly related to the rainfall
proba-bility of a cloud. As a result, precipitating cloud areas are characterised by a sufficiently largelwp which can be used as a delineator between raining and non-raining clouds (Nauss and Kokhanovsky, 2006, 2007). The new proposed scheme shows an improve-ment in rain area delineation compared to existing techniques using only a threshold for
5
cloud top infrared temperature especially for advective/stratiform precipitation clouds. The lwp required for rain area delineation can be retrieved on a pixel basis during daytime using a combination of two solar channels (e.g. Nakajima and Nakajima, 1995; Kawamoto et al., 2001; Kokhanovsky et al., 2003, 2005; Platnick et al., 2003; Nauss et al., 2005). This is due to the fact that the reflection of solar light by a cloud in a
10
non-absorbing wavelength (i.e. a visible channel between 0.4 and 0.8µm) is strongly correlated to the optical thickness while the reflection of solar light in a slightly ab-sorbing wavelength (i.e. a near-infrared channel between 1.6 and 3.9µm) is mainly a function of the cloud effective droplet radius.
To proof the conceptual model presented above within an initial test study, Nauss
15
and Kokhanovsky (2006, 2007) utilize the Semi-Analytical Cloud Retrieval Algorithm (SACURA, Kokhanovsky et al., 2003, 2005; Nauss et al., 2005) to compute aef, τ, and finally lwp using Terra-MODIS data. SACURA is based on asymptotic solutions and exponential approximations of the radiative transfer theory valid for weakly absorb-ing media (Kokhanovsky and Rozanov, 2003, 2004), which are applicable for cloud
20
retrievals up to a wavelength of around 2.2µm. Compared to other look-up table tech-niques (e.g. Nakajima and Nakajima, 1995; Kawamoto et al., 2001; Platnick et al., 2003) SACURA allows an instantaneous computation of the cloud properties which is essential for an operational rain area delineation scheme for GEO systems operating in near real-time (Nauss et al., 2005; Nauss, 2006).
25
op-ACPD
7, 15853–15872, 2007Discriminating raining from non-raining clouds at
mid-latitudes
B. Thies et al.
Title Page
Abstract Introduction
Conclusions References
Tables Figures
◭ ◮
◭ ◮
Back Close
Full Screen / Esc
Printer-friendly Version
Interactive Discussion tically thick (i.e. raining) cloud systems (Nauss et al., 2005). However, as SACURA
is only valid for water clouds it does not consider the ice phase which leads to in-accuracies concerning precipitating clouds in the mid-latitudes as efficient precipita-tion processes are mainly connected to the ice phase and the so called Bergeron-Findeisen process (e.g. Houze, 1993). Recently, Kokhanovsky and Nauss (2005) and
5
Kokhanovsky and Nauss (2006) showed that a fast and accurate calculation of the ef-fective cloud particle radius and the cloud optical thickness is possible for water and ice clouds by using a non-absorbing visible and an absorbing near infrared channel (e.g. 0.8µm and 1.6µm). Differentiation between water and ice clouds can be realized by considering the channel difference between an 8µm and an 11µm channel together
10
with the channel difference between an 11µm and an 12µm channel (Strabala et al., 1994).
The new European meteorological GEO system MSG (Meteosat Second Genera-tion) with its payload SEVIRI (Spinning Enhanced Visible and InfraRed Imager) provide the enhanced spectral resolution (Aminou, 2002; Schmetz et al., 2002; Levizzani et al.,
15
2001) to infer information about the liquid water path and the ice water path (hereafter both referred to as cloud water path (cwp)) as well as about the cloud phase. Further-more it offers a high temporal (15 min) and spatial (3×3 km at SSP) resolution neces-sary for a continuous area-wide monitoring of the rainfall distribution which is essential for nowcasting purposes.
20
Therefore, the objective of the present paper is to propose a new operational tech-nique for rain area delineation in the mid-latitudes on a 15 min basis for MSG SEVIRI daytime data. It is based on the new conceptual model that precipitating clouds are characterised by a sufficiently largecwpand the existence of ice particles in the upper cloud parts.
25
The plan of the paper is as follows. The new developed Rain Area Delineation Scheme during Daytime (RADS-D) is introduced in Sect. 2 followed by an appraisal of the new technique in Sect. 3. The paper is closed with a short summary and some conclusions.
ACPD
7, 15853–15872, 2007Discriminating raining from non-raining clouds at
mid-latitudes
B. Thies et al.
Title Page
Abstract Introduction
Conclusions References
Tables Figures
◭ ◮
◭ ◮
Back Close
Full Screen / Esc
Printer-friendly Version
Interactive Discussion 2 A new technique for rain area delineation using MSG SEVIRI daytime data
As stated in the introduction SACURA is only applicable to water clouds. Concern-ing rain area delineation in the mid-latitudes this represents a shortcomConcern-ing as eff ec-tive precipitation processes in these regions are mainly connected to the ice phase and the so called Bergeron-Findeisen process. As a consequence, Kokhanovsky and
5
Nauss (2006) have already presented the fast and accurate forward radiative trans-fer scheme CLOUD which enables the computation of the cloud properties for water and ice clouds using one non-absorbing and one absorbing band available on MSG SEVIRI. However, a fast inverse radiative transfer scheme is required for the opera-tional retrieval of cloud properties which is currently under final evaluation. Because
10
this scheme (called SLALOM, Simplified cloud retrieval Algorithm) is not yet finally ap-proved, the authors decided to use the original reflections of the 0.56–0.71µm (VIS0.6) and 1.5–1.78µm (NIR1.6) SEVIRI channels for this study, instead of computed values of aef and τ. Information about the cloud phase are incorporated by means of the channel difference between the 8.7µm channel (8.3–9.1µm) and the 10.8µm channel
15
(9.8–10.8µm) (∆T8.7
−10.8) together with the channel difference between the 10.8µm channel and the 12.1µm channel (11–13µm) (∆T10.8−12.1) (refer to Strabala et al., 1994; Ackerman et al., 1998). The differentiation is based on the observation that the increase of water particle absorption is greater between 11 and 12µm than between 8 and 11µm. The ice particle absorption increases more between 8 and 11µm than
20
between 11 and 12µm (Strabala et al., 1994). Therefore,∆T10.8
−12.1 of water clouds are greater than∆T8.7
−10.8. On the other hand,∆T8.7−10.8of ice clouds are greater than coincident∆T10.8−12.1.
To use the information about thecwpand the cloud phase for a proper detection of potentially precipitating cloud areas (i.e. a large enough cwp and ice particles in the
25
com-ACPD
7, 15853–15872, 2007Discriminating raining from non-raining clouds at
mid-latitudes
B. Thies et al.
Title Page
Abstract Introduction
Conclusions References
Tables Figures
◭ ◮
◭ ◮
Back Close
Full Screen / Esc
Printer-friendly Version
Interactive Discussion putation of the pixel based rainfall confidence is done by a comparison of these value
combinations with ground based radar data from the German Weather Service for day-time precipitation events from January to August 2004 (altogether 850 scenes). The ground based radar data from the DWD C band radar network consist of six classes representing different reflectivity intensities which are all together considered as
rain-5
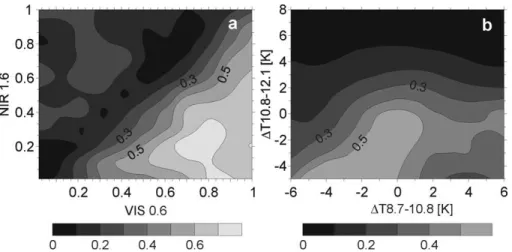
ing in the comparison with collocated satellite pixels. A lower reflectivity threshold of 7.0 decibel for the first class is utilized to detect rain bearing pixels (DWD). Figure 1 shows the calculated rainfall confidence as a function ofVIS0.6andNIR1.6(a), as well as a function of∆T8.7−10.8and∆T10.8−12.1(b). Equation (2) shows the calculation of the rainfall confidences as a function of two different variables.
10
RainConf (x1, x2)= NRain(x1, x2)
NRain(x1, x2)+NNoRain(x1, x2) (2) whereNRainandNNoRainare the raining and the non-raining frequencies, respectively, and x1 and x2 denote the channel or channel difference (VIS0.6, NIR1.6, ∆T8.7
−10.8,
∆T10.8−12.1) combined for the calculation of the rainfall confidence.
As can be seen in Fig. 1a high values of the rainfall confidence coincide with high
val-15
ues ofVIS0.6and low values ofNIR1.6, indicating a largecwp. High values ofVIS0.6 in-dicate a high optical thickness and low values ofNIR1.6indicate large cloud particles as the absorption increases with increasing particle size. Fig. 1b indicates that ice clouds, where ∆T8.7
−10.8 are greater than coincident ∆T10.8−12.1, possess high rainfall confi-dences. On the other hand, for water clouds∆T10.8−12.1 are greater than ∆T8.7−10.8.
20
These areas are characterised by lower rainfall confidences. To make use of the com-bined information content in each channel difference for rain delineation, the rainfall confidence is computed as a function of the combined values of the four channel dif-ferences as shown in Eq. (3) using the above mentioned 850 scenes:
ACPD
7, 15853–15872, 2007Discriminating raining from non-raining clouds at
mid-latitudes
B. Thies et al.
Title Page
Abstract Introduction
Conclusions References
Tables Figures
◭ ◮
◭ ◮
Back Close
Full Screen / Esc
Printer-friendly Version
Interactive Discussion RainConf (x1, x2, x3, x4)=
NRain(x1, x2, x3, x4)
NRain(x1, x2, x3, x4)+NNoRain(x1, x2, x3, x4)
(3)
whereNRainandNNoRainare the raining and the non-raining frequencies, respectively, andx1,x2,x3,x4denote the channel or channel difference (VIS0.6,NIR1.6,∆T8.7−10.8,
∆T10.8
−12.1) combined for the calculation of the rainfall confidence.
The threshold of the calculated rainfall confidence appropriate for rain area
delin-5
eation is determined by optimising the Equitable Threat Score (ETS) which is based on the number of pixels that have been identified in the satellite (S) and radar (R) tech-niques as raining (SY,RY) or non-raining (SN,RN). It indicates how well the classified rain pixels correspond to the rain pixels observed by the radar, also accounting for pix-els correctly classified by chance (SYRYRandom). Its value can range from−1/3 to 1 with
10
the optimum value 1. TheETSis calculated according to
ETS= SYRY −SYRYRandom
SYRY +SNRY +SYRN−SYRYRandom
(4)
with
SYRYRandom = (SYRY +SNRY)×(SYRY +SYRN)
TSR (5)
where TSR denotes the total number of pixels. Additionally to the ETS, a visual
in-15
spection of the Relative Operation Characteristic (ROC) plot (Mason, 1982; Jolliffe and Stephenson, 2003) was also considered to identify an appropriate rainfall confidence threshold (see Fig. 2). The Probability Of Detection (POD) describes the ratio between pixels withSYRY andRY, and gives the fraction of pixels that have been correctly iden-tified by the satellite technique, according to the radar product. The Probability Of False
20
ACPD
7, 15853–15872, 2007Discriminating raining from non-raining clouds at
mid-latitudes
B. Thies et al.
Title Page
Abstract Introduction
Conclusions References
Tables Figures
◭ ◮
◭ ◮
Back Close
Full Screen / Esc
Printer-friendly Version
Interactive Discussion ROC plot represents the “no skill” line (i.e. POD equals POFD). Value combinations
above this line indicate that the approach has skill (i.e.POD larger thanPOFD). Different rainfall confidence threshold values between 0.1 and 0.7 were used to de-lineate the satellite-based rain area. The ETS, the POD and the POFD for the de-lineated rain areas based on the different rainfall confidence levels were calculated in
5
comparison with ground based radar data. As shown in Fig. 2, the rainfall confidence threshold value around 0.3 seems to be most suitable for rain area delineation since correspondingPOD-POFD combinations show the largest distance normal to the “no skill” line. The delineated rain area using a rainfall confidence threshold of 0.34 yields the optimisedETS of 0.24. Therefore, the rainfall confidence of 0.34 is chosen as the
10
minimum threshold for precipitating clouds during daytime.
3 Appraisal of the new scheme
For the evaluation study, scenes from daytime precipitation events between January and August 2004 were classified by using the new developed Rain Area Delineation Scheme during Daytime (RADS-D). The precipitation events chosen for the evaluation
15
study are independent from the above mentioned precipitation events used for algo-rithm development. Altogether 720 daytime scenes were chosen.
To evaluate the potential improvement by the new scheme the validation scenes were also classified by the Enhanced Convective Stratiform Technique (ECST) (Reuden-bach, 2003; Reudenbach et al., 2001) which is similar to the Convective Stratiform
20
Technique (CST) (Adler and Negri, 1988) but additionally includes the water vapour channel temperature for a more reliable deep convective/cirrus clouds discrimina-tion (Tjemkes et al., 1997). The ECST which was first transferred from Meteosat-7 MVIRI (Meteosat Visible and InfraRed Imager radiometer) to MSG SEVIRI (Thies et al., 2007a1) is used for the identification of convective rain areas since these regions
25
1
Thies, B., Nauss, T., and Bendix J.: Detection of high rain clouds usingwater vapour emis-sion - transition from Meteosat First (MVIRI) to Second Generation (SEVIRI), Adv. Space Res., under review, 2007a.
ACPD
7, 15853–15872, 2007Discriminating raining from non-raining clouds at
mid-latitudes
B. Thies et al.
Title Page
Abstract Introduction
Conclusions References
Tables Figures
◭ ◮
◭ ◮
Back Close
Full Screen / Esc
Printer-friendly Version
Interactive Discussion approximately represent the performance of many present optical rainfall retrievals.
Standard verification scores following the suggestions of the International Precipita-tion Working Group (IPWG, Turk and Bauer, 2006) were calculated on a pixel basis for each scene in comparison with corresponding ground based radar data from the Ger-man Weather Service. Thebiasdescribes the ratio betweenSY andRY and the False
5
Alarm Ratio (FAR) gives the ratio betweenSYRN andSY. The Critical Success Index (CSI), which encloses all pixels that have been identified as raining by either the radar network or the satellite technique, describes the ratio betweenSYRY and the sum of SYRY,SNRY,SYRN. All scores range from 0 to 1. The optimum value for theCSI is 1, while it is 0 for theFAR. Since thePODcan be increased by just increasing the satellite
10
rainfall area (i.e. by reducing the rainfall confidence threshold), it has to be analysed in connection with corresponding values of theFAR and the POFD since both measure the fraction of the satellite pixels that have been incorrectly identified as raining. The verification scores were calculated on a pixel basis for each single scene without any spatio-temporal aggregation. For a detailed discussion of the verification scores see
15
Stanski et al. (1989) or the web site of the WWRP/WGNE.
The verification scores calculated for the 720 daytime validation scenes are summa-rized in Table 1. RADS-D slightly overestimates the rain area detected by the radar network which is indicated by the bias of 1.15. In contrast to this, the rain area is strongly underestimated by the ECST (bias of 0.22). 61% of the radar observed
rain-20
ing pixels are also identified by RADS-D. This indicates a much better performance compared to thePODof 9% for the ECST, even if this coincide with a higherPOFD of 0.18 for RADS-D in comparison to 0.04 for the ECST. Anyhow, theFAR indicates that a lower fraction of the pixels where wrongly classified as rain by RADS-D (0.46) than by the ECST (0.51). Altogether, the good performance of the new RADS-D is further
25
supported by theCSI (0.39) and theETS(0.25). Compared to ECST (CSI: 0.1;ETS: 0.06) this signifies a distinct improvement concerning the delineated rain area.
addi-ACPD
7, 15853–15872, 2007Discriminating raining from non-raining clouds at
mid-latitudes
B. Thies et al.
Title Page
Abstract Introduction
Conclusions References
Tables Figures
◭ ◮
◭ ◮
Back Close
Full Screen / Esc
Printer-friendly Version
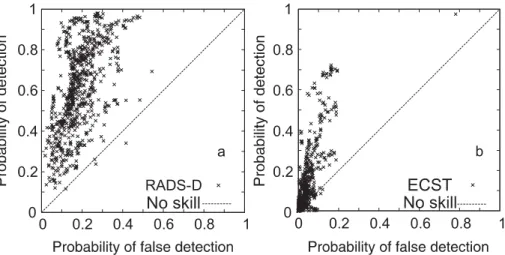
Interactive Discussion tionally supports the good and improved performance of the new developed scheme.
The combination of medium to high values forPODtogether with low to medium values forPOFD which is valid for the main part of the classified scenes underlines the overall good skill of the new scheme. In contrast, for scenes classified by the ECST thePOD
andPOFD indicate much lower or even no skills.
5
To gain a visual impression of the performance of the new developed rain area delin-eation scheme, the classified rain area for a scene from 12 January 2004 12:45 UTC is depicted in Fig. 4. Figure 4a shows the brightness temperature in the 10.8µm channel (BT10.8), Fig. 4b the rain area delineated by RADS-D as well as by ECST, and Fig. 4c the rain area detected by RADS-D in comparison to the radar data.
10
4 Conclusions
A new algorithm for rain area delineation during daytime using multispectral optical satellite data of MSG SEVIRI was proposed. The method allows not only a proper de-tection of mainly convective precipitation by means of the commonly used connection between infrared cloud top temperature and rainfall probability but also enables the
de-15
tection of advective/stratiform precipitation (e.g. in connection with mid-latitude frontal systems). It is based on the conceptual model that precipitation is favoured by a large cloud water path and the presence of ice particles in the upper part of the cloud. The technique considers the VIS0.6 and the NIR1.6 channel to gain information about the cloud water path. Additionally, the channel differences ∆T8.7
−10.8 and ∆T10.8−12.1 are
20
considered to gain information about the cloud phase.
The information about the cloud water path and the cloud phase of the four variables is merged and incorporated into the new developed rain delineation algorithm. Rain area delineation is realized by using the pixel based rainfall confidence as a function of the respective value combination of the four variables. The calculation of the rainfall
25
confidence is based on a comparison of the value combinations of the four variables with ground based radar data. A minimum threshold for the rainfall confidence of 0.34
ACPD
7, 15853–15872, 2007Discriminating raining from non-raining clouds at
mid-latitudes
B. Thies et al.
Title Page
Abstract Introduction
Conclusions References
Tables Figures
◭ ◮
◭ ◮
Back Close
Full Screen / Esc
Printer-friendly Version
Interactive Discussion was determined as appropriate for rain area delineation.
The results of the algorithm were compared with corresponding ground based radar. The proposed technique performs better than existing optical retrieval techniques using only IR thresholds for cloud top temperature. The new developed algorithm shows encouraging performance concerning precipitation delineation during daytime in the
5
mid-latitudes using MSG SEVIRI data.
Together with the existing rain area delineation scheme during nighttime (Thies et al., 2007b) the new algorithm offers the great potential for a 24 h technique for rain area delineation with a high spatial and temporal resolution.
The nighttime technique is based on the same conceptual model as the presented
10
daytime scheme. However, since no operational retrieval exists for MSG to compute the cloud water path during nighttime, suitable combinations of brightness temperature differences (∆T) between the thermal bands of MSG SEVIRI (∆T3.9
−10.8, ∆T3.9−7.3,
∆T8.7
−10.8,∆T10.8−12.1) are used to infer implicit information about the cloud water path.
∆T8.7−10.8 and ∆T10.8−12.1 are particularly considered to supply information about the
15
cloud phase. Similar to the daytime approach rain area delineation is realized by means of the pixel based rainfall confidence as a function of the respective value combination of the four brightness temperature differences.
Acknowledgements. The current study is funded by the German Ministry of Research and Education (BMBF) in the framework of the GLOWA-Danube project (G-D/2004/TP-10,
precip-20
itation/remote sensing) as well as by the German Research Council (DFG) (BE 1780/18-1) within the SORT project. The authors are grateful to the German Weather Service (DWD) for providing the radar datasets within the Eumetsat/DWD Advanced Multisensor Precipitation Experiment (AMPE).
References
25
ACPD
7, 15853–15872, 2007Discriminating raining from non-raining clouds at
mid-latitudes
B. Thies et al.
Title Page
Abstract Introduction
Conclusions References
Tables Figures
◭ ◮
◭ ◮
Back Close
Full Screen / Esc
Printer-friendly Version
Interactive Discussion
Adler, R. F. and Negri, A. J.: A satellite technique to estimate tropical convective and stratiform rainfall, J. Appl. Meteorol., 27, 30–51, 1988.
Aminou, D. M. A.: MSG’s SEVIRI instrument, ESA Bulletin, 111, 15–17, 2002.
Barnes, W. L., Pagano, T. S., and Salomonson, V. V.: Prelaunch characteristics of the Moderate Resolution Imaging Spectroradiometer (MODIS) on EOS-AM1, IEEE T. Geosci. Remote, 36,
5
1088–1100, 1998.
Bellon, A., Lovejoy, S., and Austin, G. L.: Combining satellite and radar data for the short-range forecasting of precipitation, Monthly Weather Review, 108, 1554–1556, 1980.
Cheng, M., Brown, R., and Collier, C. G.: Delineation of precipitation areas by correlation of METEOSAT visible and infrared data in the region of the United Kingdom, J. Appl. Meteorol.,
10
32, 884–898, 1993.
DWD: Weather radar network, Available online at http://www.dwd.de/en/Technik/
Datengewinnung/Radarverbund/Radarbroschuere en.pdf, 2007.
Ebert, E. E., Janowiak, J. E., and Kidd, C.: Comparison of near-real-time precipitation estimates from satellite observations and numerical models, B. Am. Meteorol. Soc.,, 88, 47–64, 2007.
15
Fr ¨uh, B., Bendix, J., Nauss, T., Paulat, M., Pfeiffer, A., Schipper, J. W., Thies, B., and Wernli, H.: Verification of precipitation from regional climate simulations and remote-sensing observa-tions with respect to ground-based observaobserva-tions in the upper Danube catchment, Meteorol. Z., 16, 275–293, 2007.
Hansen, J. E. and Travis, L. D.: Light scattering in planetary atmospheres, Space Sci. Rev., 16,
20
527–610, 1974.
Houze, R. A.: Cloud Dynamics, Vol. 53 of the International Geophysics Series, Academic Press, San Diego, 1993.
Jolliffe, I. T. and Stephenson, D. B.: Forecast Verification, A Practioner’s Guide in Atmospheric Science, Wiley and Sons Ltd., 2003.
25
Kawamoto, K., Nakajima, T. and Nakajima, T. Y.: A global determination of cloud microphysics with AVHRR remote sensing, J. Climate, 14, 2054–2068, 2001.
Kokhanovsky, A. A. and Rozanov, V. V.: The physical parameterization of the top-of-atmosphere reflection function for a cloudy atmosphere -underlying surface system: the oxygen A-band case study, J. Quant. Spectrosc. Ra., 85, 35–55, 2004.
30
Kokhanovsky, A. A. and Rozanov, V. V.: The reflection function of optically thick weakly absorb-ing turbid layers: a simple approximation, J. Quant. Spectrosc. Ra., 77, 165–175, 2003. Kokhanovsky, A. A. and Nauss, T.: Reflection and transmission of solar light by clouds:
ACPD
7, 15853–15872, 2007Discriminating raining from non-raining clouds at
mid-latitudes
B. Thies et al.
Title Page
Abstract Introduction
Conclusions References
Tables Figures
◭ ◮
◭ ◮
Back Close
Full Screen / Esc
Printer-friendly Version
Interactive Discussion
totic theory, Atmos. Chem. Phys., 6, 5537–5545, 2006,
http://www.atmos-chem-phys.net/6/5537/2006/.
Kokhanovsky, A. A. and Nauss, T.: Satellite-based retrieval of ice cloud properties using a semi-analytical algorithm, Journal of Geophysical Research Atmosphere, 110(D19), D19206, doi:10.1029/2004JD005744, 2005.
5
Kokhanovsky, A. A., Rozanov, V. V., Nauss, T., Reudenbach, C., Daniel, J. S., Miller, H. L., and Burrows, J. P.: The semianalytical cloud retrieval algorithm for SCIAMACHY. I: The validation, Atmos. Chem. Phys., 6, 1905–1911, 2005,
http://www.atmos-chem-phys.net/6/1905/2005/.
Kokhanovsky, A. A. and Rozanov, V. V. and Zege, E. P. and Bovensmann, H. and
10
Burrows, J. P.: A semi-analytical cloud retrieval algorithm using backscattered radia-tion in 0.4-2.4 micrometers spectral range, J. Geophys. Res.-Atmos., 108(D1), 4008, doi:10.1029/2001JD001543, 2003.
Kurino, T.: A satellite infrared technique for estimating “deep/shallow” precipitation, Adv. Space Res., 19, 511–514, 1997.
15
Lensky, I. M. and Rosenfeld, D.: A night-time delineation algorithm for infrared satellite data based on microphysical considerations, J. Appl. Meteorol., 42, 1218–1226, 2003.
Levizzani, V.: Satellite rainfall estimations: new perspectives for meteorology and climate from the EURAINSAT project, Ann. Geophys.-Italy, 46, 363–372, 2003.
Levizzani, V. , Schmetz, J., Lutz, H. J., Kerkmann, J., Alberoni, P. P., and Cervino, M.:
Precipi-20
tation estimations from geostationary orbit and prospects for Meteosat Second Generation, Meteorol. Appl., 8, 23–41, 2001.
Mason, I.: A model for assessment of weather forecasts, Aust. Meteorol. Mag., 30, 291–302, 1982.
Nakajima, T. Y. and Nakajima, T.: Wide-area determination of cloud microphysical properties
25
from NOAA AVHRR measurements for FIRE and ASTEX regions, J. Atmos. Sci., 52, 4043– 4059, 1995.
Nauss, T.: Das Rain Area Delineation Scheme RADS – ein neues Verfahren zur satel-litengesttzten Erfassung der Niederschlagsflche ber Mitteleuropa, Marburger Geographische Schriften, 143, 160 pp., 2006.
30
mid-ACPD
7, 15853–15872, 2007Discriminating raining from non-raining clouds at
mid-latitudes
B. Thies et al.
Title Page
Abstract Introduction
Conclusions References
Tables Figures
◭ ◮
◭ ◮
Back Close
Full Screen / Esc
Printer-friendly Version
Interactive Discussion
latitudes using multispectral satellite data, Atmos. Chem. Phys., 6, 5031–5036, 2006,
http://www.atmos-chem-phys.net/6/5031/2006/.
Nauss, T., Kokhanovsky, A. A., Nakajima, T. Y., Reudenbach, C., and Bendix, J.: The intercom-parison of selected cloud retrieval algorithms, Atmos. Res., 78, 46–78, 2005.
Platnick, S., King, M. D., Ackerman, S. A., Menzel, W. P., Baum, B. A., Ridi, J. C. and Frey,
5
R. A.: The MODIS cloud products: Algorithms and examples from Terra, IEEE T. Geosci. Remote, 41, 459–473, 2003.
Reudenbach, C., Heinemann, G., Heuel, E., Bendix, J., and Winiger, M.: Investigation of sum-mertime convective rainfall in Western Europe based on a synergy of remote sensing data and numerical models, Meteorol. Atmos. Phys., 76, 23–41, 2001.
10
Reudenbach, C.: Konvektive Sommerniederschlge in Mitteleuropa. Eine Kombination aus Satellitenfernerkundung und numerischer Modellierung zur automatischen Erfassung mesoskaliger Niederschlagsfelder, Bonner Geographische Abhandlungen, 109, 152 pp., 2003.
Schmetz, J., Pili, P., Tjemkes, S., Just, D., Kerkmann, J., Rota, S., and Ratier, A.: An
introduc-15
tion to Meteosat Second Generation (MSG), B. Am. Meteorol. Soc., 83, 977–992, 2002. Stanski, H. R., Wilson, L., and Burrows, W.: Survey of common verification methods in
mete-orology. World Weather Watch Technical Report No. 8, WMO, Geneva, WMO/TD No. 358, 1989.
Strabala, K. I., Ackerman, S. A., and Menzel, W. P.: Cloud Properties Inferred from 8-12-µm
20
Data, J. Appl. Meteorol., 33, 212–229, 1994.
Thies, B., Nauss, T., and Bendix J.: Discriminating raining from non-raining cloud areas at mid-latitudes using Meteosat Second Generation SEVIRI nighttime data, Meteorol. Appl., accepted, 2007b.
Tjemkes, S. A., van de Berg, L., and Schmetz, J.: Warm water vapour pixels over high clouds
25
as observed by Meteosat, Contributions to atmospheric physics, 70, 15–21, 1997.
Turk, J. and Bauer, P.: The International Precipitation Working Group and Its Role in the Im-provement of Quantitative Precipitation Measurements, B. Am. Meteorol. Soc., 87, 643–647, 2006.
World Weather Research Program/Working Group on Numerical Experimentation Joint
Work-30
ing Group on Verification (WWRP/WGNE): Forecast Verification - Issues, Methods and FAQ, available online at http://www.bom.gov.au/bmrc/wefor/staff/eee/verif/verif web page.
html, 2007.
ACPD
7, 15853–15872, 2007Discriminating raining from non-raining clouds at
mid-latitudes
B. Thies et al.
Title Page
Abstract Introduction
Conclusions References
Tables Figures
◭ ◮
◭ ◮
Back Close
Full Screen / Esc
Printer-friendly Version
Interactive Discussion
Table 1. Results of the standard verification scores applied to the rain-area identified by
RADS-D and ECST on a pixel basis. The scores are based on 720 precipitation scenes with 24 914 160 pixels of which 5 872 220 have been identified as raining by RADS-D.POD (Prob-ability Of Detection); POFD (Probability Of False Detection), FAR (False Alarm Ratio); CSI (Critical Success Index);ETS(Equitable Threat Score).
RADS-D ECST
Test Mean StDev Min Max Mean StDev Min Max
Bias 1.15 0.38 0.16 2.17 0.22 0.27 0 2.82
POD 0.61 0.21 0.12 0.98 0.12 0.17 0 0.97
POFD 0.18 0.09 0.02 0.54 0.04 0.05 0 0.78
FAR 0.46 0.12 0.03 0.84 0.51 0.27 0 1
CSI 0.39 0.14 0.1 0.77 0.1 0.14 0 0.64
ACPD
7, 15853–15872, 2007Discriminating raining from non-raining clouds at
mid-latitudes
B. Thies et al.
Title Page
Abstract Introduction
Conclusions References
Tables Figures
◭ ◮
◭ ◮
Back Close
Full Screen / Esc
Printer-friendly Version
Interactive Discussion Fig. 1. The rainfall confidence as a function of VIS0.6andNIR1.6(a), as well as a function of
∆T8.7−10.8and∆T10.8−12.1(b)calculated with Eq. (2).
ACPD
7, 15853–15872, 2007Discriminating raining from non-raining clouds at
mid-latitudes
B. Thies et al.
Title Page
Abstract Introduction
Conclusions References
Tables Figures
◭ ◮
◭ ◮
Back Close
Full Screen / Esc
Printer-friendly Version
Interactive Discussion
Fig. 2.ROC curve based on the comparison between the combined values of the channel
ACPD
7, 15853–15872, 2007Discriminating raining from non-raining clouds at
mid-latitudes
B. Thies et al.
Title Page
Abstract Introduction
Conclusions References
Tables Figures
◭ ◮
◭ ◮
Back Close
Full Screen / Esc
Printer-friendly Version
Interactive Discussion
Fig. 3. ROC curves for the comparison between RADS-D and ground based radar (a), and
ECST and ground based radar(b). The calculated probability of detection (POD) and proba-bility of false detection (POFD) are based on the 720 scenes mentioned in the text.
ACPD
7, 15853–15872, 2007Discriminating raining from non-raining clouds at
mid-latitudes
B. Thies et al.
Title Page
Abstract Introduction
Conclusions References
Tables Figures
◭ ◮
◭ ◮
Back Close
Full Screen / Esc
Printer-friendly Version
Interactive Discussion
Fig. 4. Delineated rain area for the scene from 12 January 2004 12:45 UTC.(a)BT10.8image;