Diversity of Marine-Derived Fungal Cultures
Exposed by DNA Barcodes: The Algorithm
Matters
Nikos Andreakis*, Lone Høj, Philip Kearns, Michael R. Hall, Gavin Ericson, Rose E. Cobb¤a, Benjamin R. Gordon¤b, Elizabeth Evans-Illidge
Australian Institute of Marine Science, PMB 3, Townsville, Queensland, 4810, Australia
¤a Current Address: Walter and Eliza Hall Institute of Medical Research, Melbourne, Australia ¤b Current Address: College of Public Health, Medical & Veterinary Sciences, James Cook University, Townsville, Australia
Abstract
Marine fungi are an understudied group of eukaryotic microorganisms characterized by unresolved genealogies and unstable classification. Whereas DNA barcoding via the nuclear ribosomal internal transcribed spacer (ITS) provides a robust and rapid tool for fun-gal species delineation, accurate classification of fungi is often arduous given the large number of partial or unknown barcodes and misidentified isolates deposited in public data-bases. This situation is perpetuated by a paucity of cultivable fungal strains available for phylogenetic research linked to these data sets. We analyze ITS barcodes produced from a subsample (290) of 1781 cultured isolates of marine-derived fungi in the Bioresources Library located at the Australian Institute of Marine Science (AIMS). Our analysis revealed high levels of under-explored fungal diversity. The majority of isolates were ascomycetes including representatives of the subclasses Eurotiomycetidae, Hypocreomycetidae, Sor-dariomycetidae, Pleosporomycetidae, Dothideomycetidae, Xylariomycetidae and Sacchar-omycetidae. The phylum Basidiomycota was represented by isolates affiliated with the generaTritirachiumandTilletiopsis. BLAST searches revealed 26 unknown OTUs and 50 isolates corresponding to previously uncultured, unidentified fungal clones. This study makes a significant addition to the availability of barcoded, culturable marine-derived fungi for detailed future genomic and physiological studies. We also demonstrate the influence of commonly used alignment algorithms and genetic distance measures on the accuracy and comparability of estimating Operational Taxonomic Units (OTUs) by the automatic barcode gap finder (ABGD) method. Large scale biodiversity screening programs that combine data-sets using algorithmic OTU delineation pipelines need to ensure compatible algorithms have been used because the algorithm matters.
OPEN ACCESS
Citation:Andreakis N, Høj L, Kearns P, Hall MR, Ericson G, Cobb RE, et al. (2015) Diversity of Marine-Derived Fungal Cultures Exposed by DNA Barcodes: The Algorithm Matters. PLoS ONE 10(8): e0136130. doi:10.1371/journal.pone.0136130
Editor:Christina A. Kellogg, U.S. Geological Survey, UNITED STATES
Received:September 10, 2014
Accepted:July 29, 2015
Published:August 26, 2015
Copyright:© 2015 Andreakis et al. This is an open access article distributed under the terms of the
Creative Commons Attribution License, which permits unrestricted use, distribution, and reproduction in any medium, provided the original author and source are credited.
Data Availability Statement:All sequence accession numbers are available from the GENBANK database. Accession numbers are available in Supporting Information.
Introduction
Marine microorganisms are biodiverse and globally important, accounting for 90% of ocean bio-mass and 98% of ocean respiration [1]. Marine fungi are part of the eukaryotic microbial biodi-versity and as an ecological group, defined based on their habitat. They can be sub-divided into those that are fully adapted and require a marine environment to complete their life cycle (resi-dents) and those that have been washed or blown from a freshwater or terrestrial environment and are able to survive by tolerating marine conditions (transients) [2]. Whereas obligate marine fungi can grow and sporulate exclusively in marine or estuarine environments, transients are fac-ultative marine species which may also grow in freshwater and terrestrial habitats [3].
Marine fungi demonstrate a variety of habits and life cycle strategies, and include free-living, parasitic and widespread symbiotic forms. Although the ecological role of marine fungi is poorly understood, purported roles include degradation of biota, provision of chemical protec-tion, pathogenicity, symbiosis and contribution to diverse holobiont communities [4–6]. Advancement in marine mycology is confounded by under-representation of fungal strains in culture collections, and the poor recovery of fungal SSU rRNA gene sequences in clone libraries from marine environmental samples [4].
While less studied than prokaryotic microorganisms, marine-derived fungi are emerging as a productive source of new natural products with fermentation, bioremediation and therapeu-tic potential [7,8]. Over 60% of the 456 new marine microbial natural products reported in 2012, were produced by fungi [7]. Fungi also account for the highest number of novel com-pounds reported from sponge-associated microorganisms in the last decades [7,9].
The Australian Institute of Marine Science (AIMS) Bioresources Library hosts a culture col-lection of over 7,000 un-sequenced microorganisms, including 1,781 marine-derived fungi iso-lated from various sources including invertebrates, sediment and seawater. In an attempt to identify bioactivity trends amongst higher macro-organism phyla represented in the AIMS Bioresources Library, a recent study analysed bioassay data with respect to taxonomy, phylog-eny and bioregional origins [10]. That study incorporated bioactivity results from 18,000 indi-vidual bioassays of samples collected from over 1,200 sites across 10 Australian marine bioregions and 13 macro-organism phyla [10]. The study concluded that bioactivity was pri-marily explained by high level phylogenetic grouping rather than habitat diversity or specific ecological profiles. A similar analysis targeting microbial phyla has not been possible to date, due to incomplete taxonomic characterization of the microbial isolates.
Despite their putative ecological significance and growing importance to biodiscovery, fun-gal phylogeny and systematics remain largely underexplored [11,12]. Classification of fungi traditionally relied on sexual characters or morphological and physiological criteria, many of which are unstable in culture conditions or do not reflect any genealogical relationships [13]. There is no unique accepted system of classification at the higher taxonomic level despite a large scale collaborative effort to do so [14]. Although presently classified into seven phyla, the adoption of an unambiguous species concept still remains disputable in fungal taxonomy. However, it has been argued that molecular identification of operational taxonomical units (OTUs) via DNA barcoding may be sufficient to provide both a link between fungal systemat-ics and phylogenetsystemat-ics, and a powerful tool in large scale screening projects for the identification of new candidate lineages for biodiscovery [15].
DNA barcoding techniques have provided standardized, reliable and cost-effective methods for marine and terrestrial species identification [16–18]. The internal transcribed spacer (ITS) region of nuclear DNA (nrDNA) has been recently accepted by a multinational multilabora-tory consortium as a suitable marker for barcoding fungi [19], although some primer combina-tions may apparently introduce taxonomic bias in some fungal groups [20]. Nevertheless, the Competing Interests:The authors have declared
ITS region has been successfully used for fungal species identification and phylogenetic infer-ence, in addition to barcoding environmental DNA samples (eDNA), via high throughput next generation sequencing (NGS) technology [21–23]. This approach has immensely accelerated the discovery of new lineages and has consequently revolutionized our perception of spatial and temporal levels of diversity in fungi [21].
Biological sequence alignment followed by estimation of evolutionary distance, are the first two crucial steps in molecular systematics, phylogenetic inference and comparative genomics [24–27]. Barcoding analysis typically begins with a sequence alignment step followed by the application of a clustering algorithm using a genetic distance threshold determineda priori, for the calculation of genetic similarity between pairs of sequences and the establishment of bar-code clusters referred to as species or OTUs. [16,18]. There are several alternative ways of computing sequence alignments and estimating evolutionary distance, each developed to fit a variety of data and analytical purposes [28,29]. While realistic evolutionary distances can be calculateda prioriby specifying appropriate substitution models that best fit the data [30], the accuracy of common alignment algorithms and their influence on both the final tree topology and genetic divergence estimates for downstream OTU delineation and biodiversity conclu-sions remains controversial [27,31].
In this paper the ITS marker is used to evaluate fungal diversity in a subset of 290 cryopre-served fungal isolates obtained from multiple marine sources. This study aims to characterize each isolate at the lowest possible taxonomic unit, to identify and document unknown fungal lineages and assess fungal diversity with respect to taxonomy, geography and source of the iso-lates analyzed. By using four different commonly used alignment algorithms and evolutionary distance estimators for species identification, this paper also aims to evaluate the respective influences, biases and limitations of these algorithms in automatic quantitative fungal OTU delineation from ITS barcodes.
Materials & Methods
Geographical sampling, culture isolation & growth
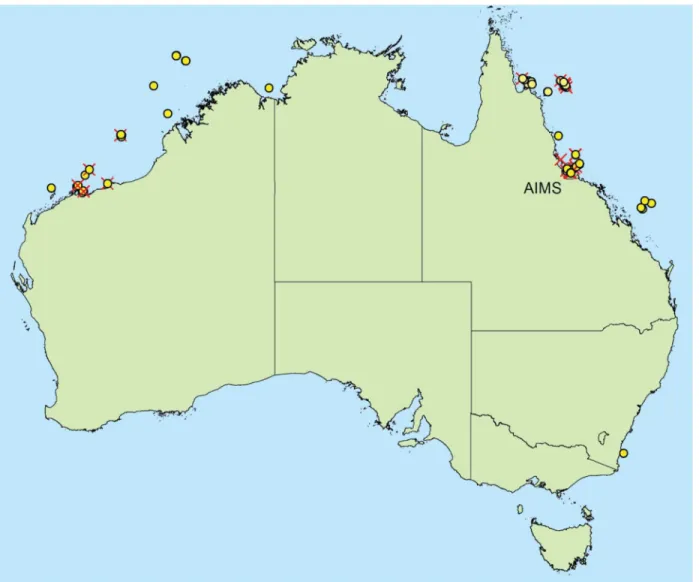
All examined isolates were from the AIMS Bioresources library located at Cape Ferguson, Queens-land, Australia. Source samples were legally collected between 1994 and 2008 under Great Barrier Reef Marine Park Authority (GBRMPA) permits (G94/587, G05/11866.1) from collection sites shown inFig 1. Samples from sites outside the Great Barrier Reef Marine Park did not require per-mits at the time of collection. Depending on each isolate’s source jurisdiction (S1 Table), their future use is subject to either the benefit sharing agreement between the Australian Institute of Marine Science (AIMS) and the State of Queensland, or the deed of benefit-sharing between AIMS and the Commonwealth of Australia.S2 Tabledetails each strain’s accession number, source mate-rial, collection location, distance to nearest landmass or island, and salinity condition of inshore sites. Sample collection, processing, isolation and culture methods were described in detail previ-ously [32]. The majority of samples were plated on seawater-based media including filter paper moistened with sterile seawater, malt extract agar, yeast peptone agar, potato carrot agar [32] and diluted brain heart infusion agar (Brain Heart Infusion (Difco, BD) 3.7 g, bacto agar 10 g, seawater to 1 L). Only seven of the isolates grown with brain heart infusion agar were prepared with mQ water instead of seawater (S1 Table). Each agar medium was amended with antibiotics (Streptomy-cin 10 mg/L or Penicillin G 300 mg/L and Streptomy(Streptomy-cin 500 mg/L).
DNA extraction, PCR amplification & sequencing
recommendations. Quality and quantity of the extracted DNA was assessed in 1% agarose gel against known standards. The nuclear first internal transcribed spacer (ITS-1), the 5.8S gene and the second internal transcribed spacer were PCR amplified using primers ITS1 and ITS4 [33]. PCR reactions contained approximately 5 ng of DNA template, 10μl 5x MyTaq Reaction Buffer,
0.15μl of each primer (100 pmolμl-1), 0.4μl of bovine serum albumin (BSA; 10 mg ml-1), 3μl
MgCl2(50 mM), and 0.2μl of MyTaq polymerase (Bioline, London, UK). The thermal cycling
included: 1 cycle at 95°C for 5 min; 30 cycles at 94°C for 50 sec, 55°C for 50 sec, 72°C for 1.5 min; and a final elongation at 72°C for 10 min. PCR products were sent to Macrogen Inc. (Seoul, Korea) for purification and sequencing in both directions with the same primers used for the PCR reactions. Sequence accession numbers (KP890357—KP890646) are reported in
S2 Table).
Fig 1. Specimen collection sites.Red crosses denote sites where unknown OTUs have been recovered. This figure was generated by the authors using ArcMap 10.1 with the Geodata Coast 100k base layer [74] available under creative commons 4.0 license.
Sequence alignments, BLAST searches, data exploration & genetic
distance computations
Electropherograms were assembled in Sequencher 4.9 (Gene Codes) and a preliminary align-ment was computed and trimmed in Bioedit v7.0.9 [34] using the ClustalW algorithm. BLAST searches were performed against publically available nucleotide databases (at:http://blast.ncbi. nlm.nih.gov) and the taxonomic validity and lineage status of fungal groups and taxa identified by BLAST searches was determined based on information recovered from Mycobank (http:// www.mycobank.org/). Multiple sequence alignments of newly produced sequences only (290 sequences) were computed in Clustal Omega [35] atwww.ebi.ac.uk/Tools/msa/clustalo/, MAFFT [36] atwww.ebi.ac.uk/Tools/msa/mafft/, MUSCLE [37] atwww.ebi.ac.uk/Tools/msa/ muscle/) and KALIGN [38] atwww.ebi.ac.uk/Tools/msa/kalign/) under default conditions for DNA sequence alignments. The most common default options were for Clustal Omega: mBed-like clustering iteration = yes, max guide tree iterations = 1, max HMM iterations = 1, gap open penalty = 6, gap extension penalty = 1; MAFFT: tree rebuilding number = 1, guide tree
output = on, max number of iterations = 0, perform fast fourier transform = localpair, gap open penalty = 1.53, gap extension penalty = 0.123; MUSCLE: max number of iterations = 16, gap open penalty = -12.0, gap extension penalty = -1.0; KALIGN: gap open penalty = 11, gap extension penalty = 0.85). In addition, publically available sequences corresponding to the best BLAST matches were merged with the 290 new sequences (a total of 349 barcodes) and aligned in KALIGN under default settings. For each of the resulting alignments, the neighbour joining algorithm (NJ) was used in PAUP4.0b10 for Windows [39] to infer phylogenies from distance matrixes calculated following distance corrections suggested by Modeltest [30]. The consis-tency index (CI), retention index (RI), tree length and the amount of phylogenetic signal versus noise (g1statistics; [40]) were assessed in the same software. Finally, pairwise p-distance,
Kimura-2-Parameter (K2P) [41] and General Time Reversible (GTR) model-corrected genetic distances were computed in MEGA5 [42]. Automatic barcode gap discovery (ABGD) was per-formed by importing distance matrixes into the web version of ABGD [43] (http://wwwabi. snv.jussieu.fr/public/abgd/abgdweb.html) for identification of the barcode gap and assignment of sequence clusters into hypothetical OTUs. In ABGD, ITS sequences are regrouped into hypothetical species based on the barcode gap principle [43]. Briefly, following pairwise sequence comparisons, it is expected that genetic distances among sequences within a hypo-thetically genetically homogenous species are lower compared to genetic distances recovered from pairwise comparisons among biologically distinct species. The range of genetic distances in between, i.e. the barcode gap, is not present in the matrix and can be considered as a set ofa priorithreshold values for the delineation of genetically distinct taxa [43]. The aforementioned alignments were additionally used to compute intraspecific K2P-corrected distances.
Model selection & Bayesian phylogenetic inference
Results
Sequence analysis and characterization of marine-derived fungal
isolates
The barcodes produced from 290 viable fungal isolates corresponded to 214 unique sequences (seeTable 1for sequence and alignment statistics). An overview of the best BLAST matches returned for each isolate’s ITS sequence is presented inS2 Table. The majority of the barcodes were successfully resolved at the species or genus levels (see below), and 50 unique ITS sequences corresponded to uncultured fungus clones. Interestingly, a combination of tree topology and BLAST search results (<98% sequence identity) suggested that 26 unique ITS
barcodes (a total of 30 isolates) differed significantly from the most closely related sequences deposited in NCBI. Since many already described fungal species lack barcoding information, we refer to these 26 OTUs as unknown rather than new OTUs, strains or species (Figs2,3,4,5,
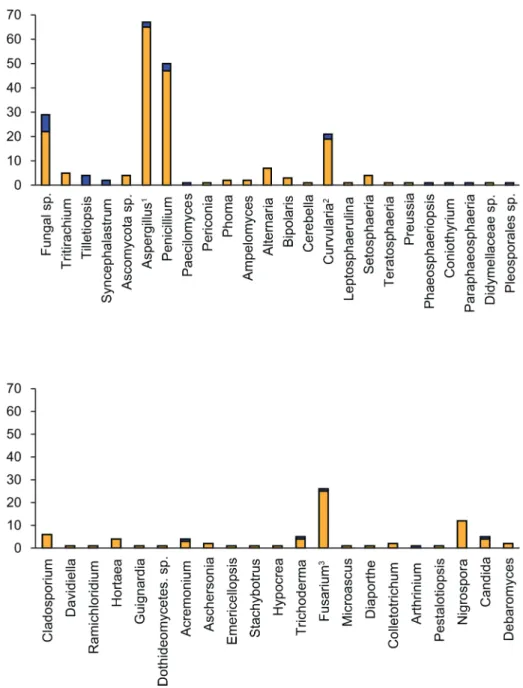
6and7).Fig 2presents an overview of the taxonomic frequency distribution of isolates based on the best BLAST match of their respective ITS sequences. For each group, the number of best BLAST matches that were classified as unknown based on the criteria above is indicated.
Of the 290 isolates, 29 (10%) yielded best BLAST hits that were classified only as Fungal sp., of which 25 were recovered from clones. The majority of the remaining isolates were most closely related with Ascomycota, with the exception of 9 isolates (3.1%) that returned best matches related to Basidiomycota (generaTritirachiumandTilletiopsis), and 2 isolates (0.7%) that returned best matches related to Zygomycota (genusSyncephalastrum). Of the Ascomy-cota isolates, 4 returned BLAST matches that were identified to that level only. Of the remain-ing isolates, 118 (40.7% of total) returned best BLAST matches related to the class
Eurotiomycetes. All of these belonged to the subclass Eurotiomycetidae, order Eurotiales; gen-eraAspergillusand its sexual formsEmericellaandNeosartorya(total 67 isolates),Penicillium
(50 isolates, of which 20 were most closely related to clone sequences), andPaecilomyces(1 isolate).
The class Dothideomycetes included the best BLAST match for 63 isolates (21.7% of total). Of these, 49 (16.9% of total) belonged to a wide variety of genera in subclass Pleosporomyceti-dae, order Pleosporales (generaPericonia,Phoma,Ampelomyces,Alternaria,Bipolaris, Cere-bella,Curvulariaand its sexual formCochliobolus,Leptosphaerulina,Setosphaeria,
Teratosphaeria,Preussia,Phaeosphaeriopsis,Coniothyrium,Paraphaeosphaeria; Didymellaceae sp., and Pleosporales sp.). A further 12 belonged to the subclass Dothideomycetidae, order Capnodiales (generaCladosporium,Davidiella,RamichloridiumandHortaea); 1 belonged to the order Botryosphaeriales for which no subclass is defined (genusGuignardia); and 1 could not be more precisely identified (Dothideomycetes sp.).
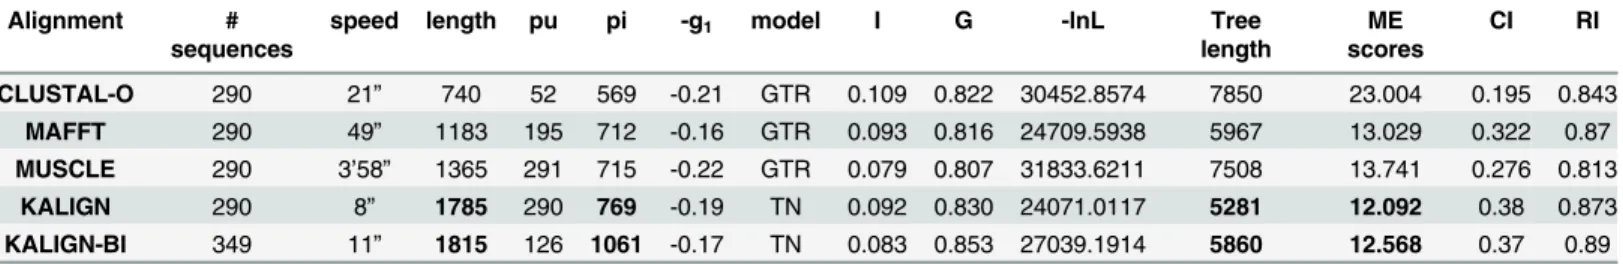
Table 1. Sequence and alignment statistics.Pu, parsimony uninformative characters; pi, parsimony informative characters;-g1statistics, the amount of
phylogenetic signal versus noise; model, model of molecular evolution inferred by Modeltest; I, proportion of invariable sites; G, gamma distribution shape parameter alpha;-lnL, maximum likelihood tree score; tree length, the minimum number of substitutions over all sites for a given topology; ME, Minimum evo-lution score; CI, consistency index (the amount of homoplasy given the data; equals 1 when there is no homoplasy); RI, retention index (the amount of synap-omorphy on the tree; increased values from 0 to 1 suggest increased evidence of grouping).
Alignment # sequences
speed length pu pi -g1 model I G -lnL Tree
length
ME scores
CI RI
CLUSTAL-O 290 21” 740 52 569 -0.21 GTR 0.109 0.822 30452.8574 7850 23.004 0.195 0.843 MAFFT 290 49” 1183 195 712 -0.16 GTR 0.093 0.816 24709.5938 5967 13.029 0.322 0.87 MUSCLE 290 3’58” 1365 291 715 -0.22 GTR 0.079 0.807 31833.6211 7508 13.741 0.276 0.813
KALIGN 290 8” 1785 290 769 -0.19 TN 0.092 0.830 24071.0117 5281 12.092 0.38 0.873 KALIGN-BI 349 11” 1815 126 1061 -0.17 TN 0.083 0.853 27039.1914 5860 12.568 0.37 0.89
The class Sordariomycetes included the best BLAST match for 58 isolates (20.0% of total). Of these, 40 belonged to the subclass Hypocreomycetidae, order Hypocreales (genera Acremo-nium,Aschersonia,Emericellopsis,Stachybotrus,Hypocrea,Trichoderma,Fusariumand its sex-ual formGibberella); 1 isolate belonged to subclass Hypocreomycetidae, order Microascales (Microascus); 4 belonged to the subclass Sordariomycetidae (generaDiaporthe,Colletotrichum, andArthrinium); and 1 belonged to the subclass Xylariomycetidae (genusPestalotiopsis). The remaining 12 Sordariomycetes isolates returned BLAST matches belonging to the order
Fig 2. BLAST search results.Genus-level frequency distributions of isolates based on best BLAST matches for the barcodes produced in this study. The blue part of each bar corresponds to isolates that we classified as‘unknown’based on low percentage sequence identity with the best BLAST match and branch length in the phylogenetic tree (Figs4,5,6and7).1Isolates with best BLAST match with the teleomorphs
EurotialesorNeosartoryaare included.2Isolates with best BLAST match with the teleomorphCochliobolus
are included.3Isolates with best BLAST match with the teleomorphGibberellaare included.
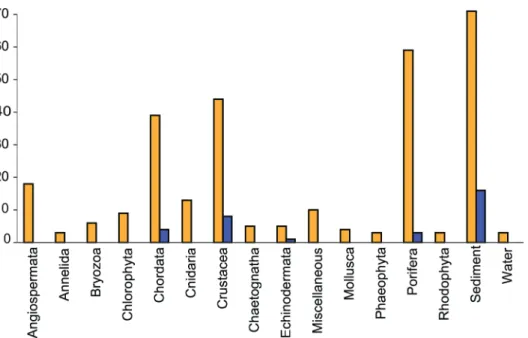
Trichosphaeriales (genusNigrospora), for which a subclass has not been defined.The class Sac-charomycetes included the best BLAST match for 7 isolates (2.4% of total); all belonging to subclass Saccharomycetidae, order Saccharomycetales (generaCandidaandDebaromyces). The majority of the strains were isolated from sediment, crustaceans and sponges (Fig 3), as could be expected since these sources were represented by the highest number of isolates.
Given the uneven number of ITS sequences recovered within each OTU we could not make global assessments on the levels of intraspecific divergence encountered. However, in cases where multiple sequences were available, K2P corrected intraspecific genetic distances ranged from 0.0073 inAspergillus terreusto 0.018 inPenicillium verrucosum, withFusarium equiseti
having a value of 0.015. The taxonomic depth of the analysed isolates is illustrated in Figs4,5,
6and7.
Multiple sequence alignment and evolutionary distance estimates
Table 1presents alignment statistics for each of the tested alignment algorithms, performed online under default settings. Indels represent a common feature of intergenic spacers such as the ITS regions. Their presence and abundance is expected to differentially influence the speed and phylogenetic informativeness of each of the tested algorithms. Speed varied significantly between algorithms, with KALIGN and MUSCLE resulting in the shortest and longest calcula-tion times, respectively. Calculacalcula-tion times for the CLUSTAL-O and MAFFT algorithms were nearly as fast as for KALIGN. The General Time Reversible substitution model (GTR; six rela-tive rates, variable base frequencies) [45] together with substitution rate heterogeneity over the alignment sites modelled by two additional parameters, gamma distribution (G; shape parame-ter alpha) and proportion of invariant sites (I), appeared to fit the data best in all cases
(Table 1) but KALIGN. In the letter case the simpler Tamura-Nei model (TN; variable base fre-quencies, equal transversion rates, variable transition rates) [46] with substitution rate hetero-geneity over the sites modelled by G and I was selected. Two interesting trends emerged from the alignment statistics. These were an increase in alignment length and in the number of
Fig 3. Isolate sources.The number of isolates per source type is shown as orange bars. The number of unknown isolates per source type is shown as blue bars.
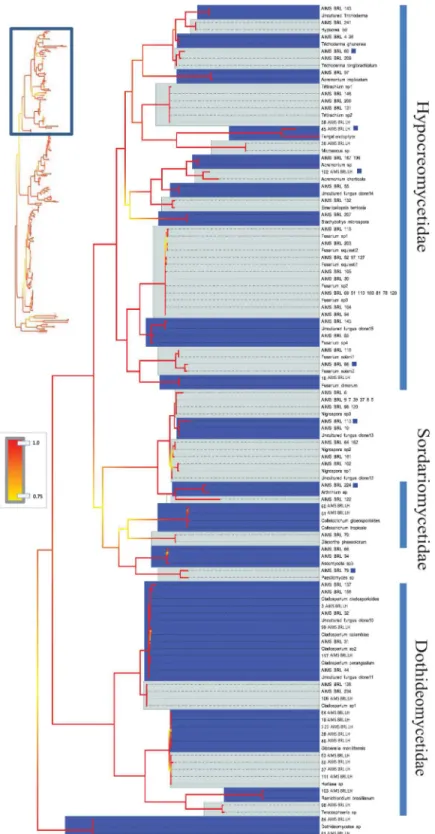
Fig 4. Bayesian phylogenetic hypothesis inferred from ITS barcodes produced in this study and corresponding best BLAST results.Subsection of tree focused on Hypocreomycetidae,
Sordariomycetidae and Dothideomycetidae isolates. Alternating dark blue and grey blocks are intended to visually differentiate reciprocally monophyletic OTUs. Yellow-to-red colour gradient denotes posterior probability support throughout the topology. Blue boxes denote unknown isolates.
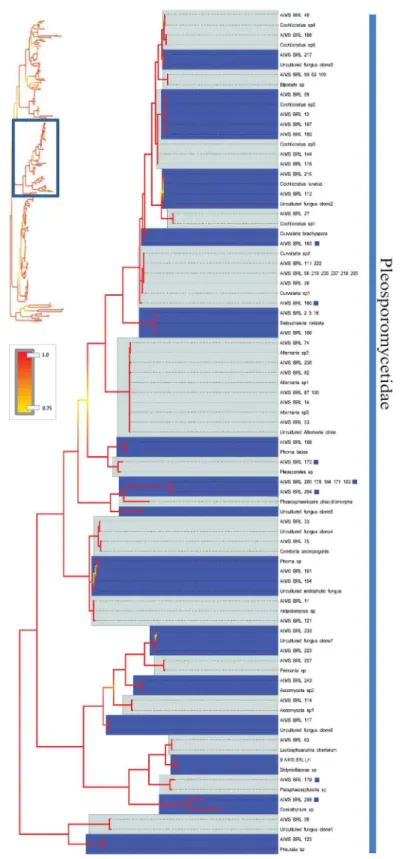
Fig 5. Bayesian phylogenetic hypothesis inferred from ITS barcodes produced in this study and corresponding best BLAST results.Subsection of tree focused on Pleosporomycetidae isolates. Alternating dark blue and grey blocks are intended to visually differentiate reciprocally monophyletic OTUs. Yellow-to-red colour gradient denotes posterior probability support throughout the topology. Blue boxes denote unknown isolates.
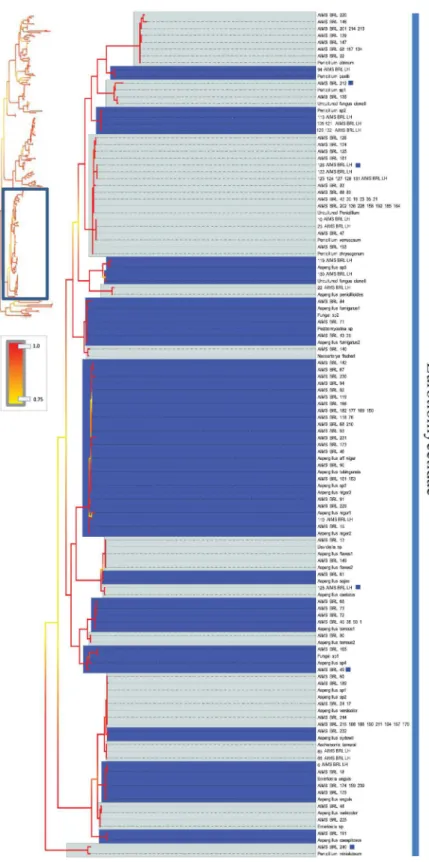
Fig 6. Bayesian phylogenetic hypothesis inferred from ITS barcodes produced in this study and corresponding best BLAST results.Subsection of tree focused on Eurotiomycetidae isolates. Alternating dark blue and grey blocks are intended to visually differentiate reciprocally monophyletic OTUs. Yellow-to-red colour gradient denotes posterior probability support throughout the topology. Blue boxes denote unknown isolates.
parsimoniously informative sites (PI) recovered, with CLUSTAL-O being the most conserva-tive and KALIGN the most flexible in accommodating gaps (Table 1). However, independently of the number of PIs, tree reconstruction may not be reliable if the extent of homoplasy in the alignment is significant [47,48]. In comparisons here, KALIGN demonstrated to be the most accurate. The latter algorithm revealed the lowest levels of homoplasy as suggested by the con-sistency index and was the one with the larger amount of synapomorphic characters, which facilitates the creation of clusters of sequences (Table 2). The alignments produced in this study are available asS1–S5Files.
Genetic distance and inference of the number of OTUs
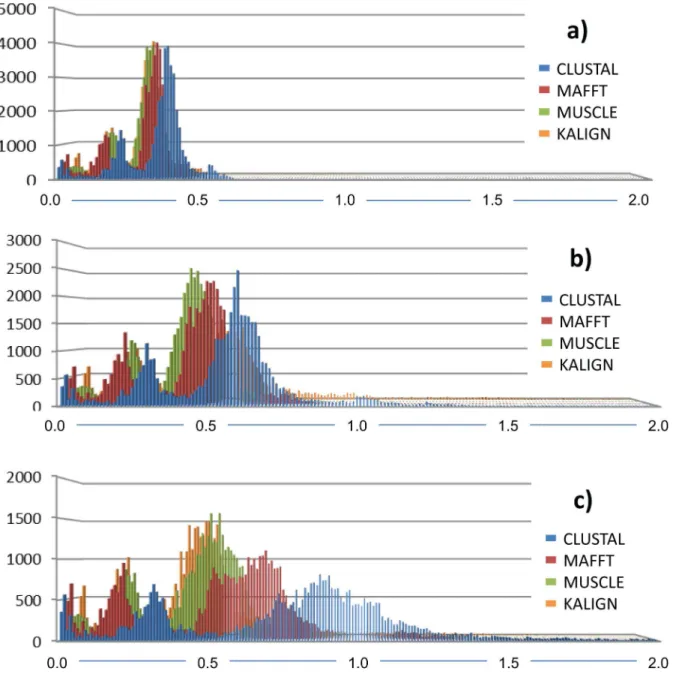
The alignment algorithm significantly influenced the genetic distance calculation. The frequency distribution of pairwise comparisons was more conservative when the simpler
p-distance calculation was applied to the dataset and increased with the increased number of
Fig 7. Bayesian phylogenetic hypothesis inferred from ITS barcodes produced in this study and corresponding best BLAST results.Subsection of tree focused on Basidiomycota andFungi incertae sedisisolates. Alternating dark blue and grey blocks are intended to visually differentiate reciprocally monophyletic OTUs. Yellow-to-red colour gradient denotes posterior probability support throughout the topology. Blue boxes denote unknown isolates.
doi:10.1371/journal.pone.0136130.g007
Table 2. Number of OTUs identified.The number of OTUs is reported given the alignment algorithm, the genetic distance calculation methodology and thea prioriestablished primary intraspecific distance partitions in ABGD. p-distance, the proportion (p) of nucleotide sites at which two sequences being compared are differ-ent; K2P distance, Kimura’s 2-parameter distance correction which takes into account transitional and trans-versional substitutions while assuming equal nucleotide frequencies and invariable substitutional rates among sites; GTR, General Time Reversible evolutionary model based on six substitution rate parameters and 4 equilibrium base frequency parameters.
p-distance K2P GTR
CLUSTAL-O 84 84 84
MAFFT 67 67 67
MUSCLE 82 82 78
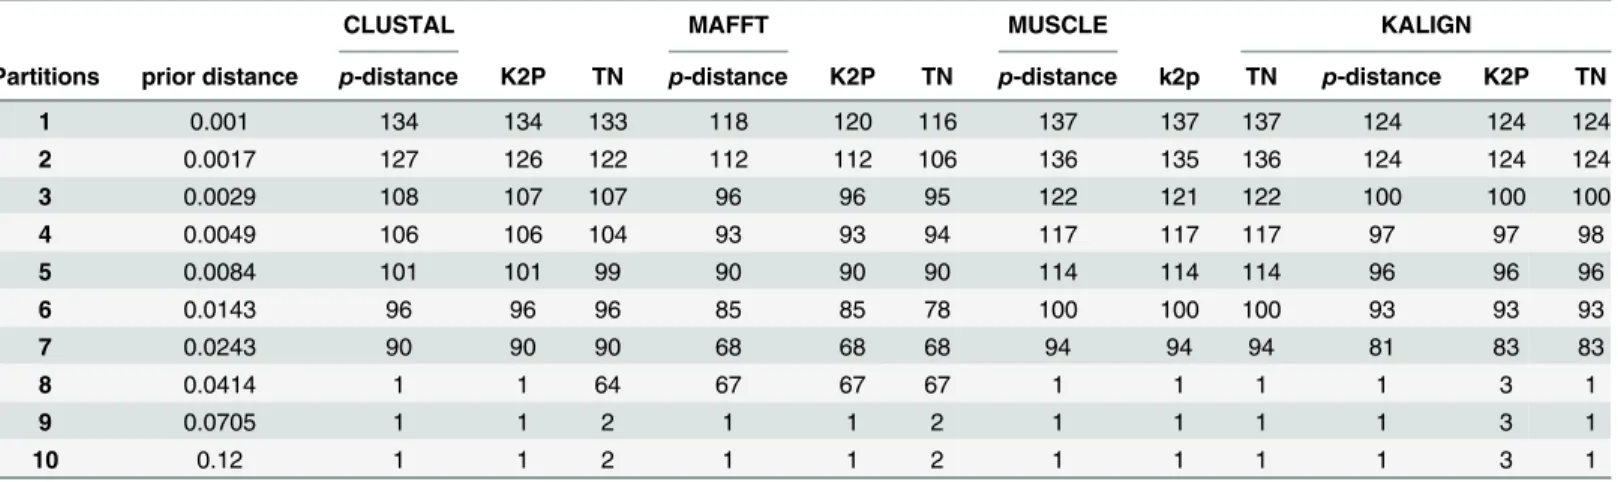
parameters involved in the distance correction from K2P to the GTR model (Fig 8). Down-stream analyses, such as calculation of the barcoding gap and the identification of the number of OTUs via the ABGD, were consequently affected (Table 3). The barcoding gap varied signifi-cantly given the alignment algorithm and the genetic distance correction (S1 Fig,S2 Fig,S3 Fig
andS4 Fig). The number of OTUs defined by ABGD varied consequently from 67 to 84 given thea prioriintraspecific genetic distance matrix (Table 2,S1 Fig,S2 Fig,S3 FigandS4 Figfor ABGD statistics).P-distance, K2P and GTR distance corrections always delivered the same number of OTUs with the same alignment algorithm in two cases (84 and 67 for CLUSTAL-O and MAFFT respectively). In contrast, for the MUSCLE alignment, theP- and K2P distances produced a larger number of OTUs (82) than the GTR corrected distance (78).
Fig 8. Frequency distribution of pairwise comparisons given the alignment.a) p-distance; b) K2P correction and c) GTR+I+G model to assess the influence of the alignment algorithm on the inferred genetic distance. Alignments were performed using default settings in MUSCLE, MAFFT, CLUSTAL and KALIGN.
Discussion
The diversity, phylogeny and ecology of marine fungi are vastly under-explored, at least partly due to the relatively few isolates available in culture [4]. A major outcome of this study is the presentation of 290 barcoded, marine-derived, culturable isolates that can be further studied to improve the collective understanding of fungal genomics, evolutionary relationships, physiol-ogy and production of bioactive compounds. This study also reports multiple previously unknown fungal lineages derived from several marine sources and the first cultured strains of several lineages previously represented only by fungal clones.
All isolates analyzed in this study have demonstrated salt tolerance, as they were isolated and cultured from marine samples and, in almost all cases, by using seawater-based media. More than half of the strains were isolated from samples collected far (>20 km) from the
near-est land and terrigenous influence, reducing the likelihood that they represent transient marine fungi. However, as each strain’s salt requirements were not characterized in detail, it is not pos-sible to claim they are obligate marine fungi. Hence, the term‘marine-derived fungi’is used throughout this paper.
Morphological identification of fungal isolates at the species level is rarely conclusive as many fungi do not develop traditional diagnostic features, such as reproductive characters, under laboratory conditions [23]. Given the vague species boundaries amongst cultivated fungi, active bio-compounds are often reported from isolates without accurate taxonomic assessment of the isolate itself [23,49]. Consequently, there is a need for development of DNA-based, standardized procedures for differentiating strains or monophyletic lineages, indepen-dently of a specific species concept [15]. Several authors have argued that DNA barcoding and comparison against sequences deposited in public databases represents a promising alternative for the identification of fungal OTUs [22,23,49].
Phylogenetic diversity as revealed by ITS barcodes
The extent of phylogenetic coverage and the degree of variation found in this study are aston-ishing given the relatively small number of specimens analyzed. BLAST searches and phyloge-netic reconstructions showed that the majority of the isolates belonged to the Ascomycota subclasses Eurotiomycetidae, Hypocreomycetidae, Sordariomcyetidae, Pleosporomycetidae,
Table 3. ABGD analysis statistics.The number of operational taxonomic units is reported given the alignment algorithm, the genetic distance calculation methodology and thea prioriestablished recursive intraspecific distance partitions in ABGD as a function of the prior limit between intra- and inter-specific divergence. p-distance, the proportion (p) of nucleotide sites at which two sequences being compared are different; K2P distance, Kimura’s 2-parameter dis-tance correction which takes into account transitional and transversional substitutions while assuming equal nucleotide frequencies and invariable substitu-tional rates among sites; TN, Tamura-Nei model based on variable base frequencies, equal transversion rates and variable transition rates.
CLUSTAL MAFFT MUSCLE KALIGN
Partitions prior distance p-distance K2P TN p-distance K2P TN p-distance k2p TN p-distance K2P TN
1 0.001 134 134 133 118 120 116 137 137 137 124 124 124
2 0.0017 127 126 122 112 112 106 136 135 136 124 124 124
3 0.0029 108 107 107 96 96 95 122 121 122 100 100 100
4 0.0049 106 106 104 93 93 94 117 117 117 97 97 98
5 0.0084 101 101 99 90 90 90 114 114 114 96 96 96
6 0.0143 96 96 96 85 85 78 100 100 100 93 93 93
7 0.0243 90 90 90 68 68 68 94 94 94 81 83 83
8 0.0414 1 1 64 67 67 67 1 1 1 1 3 1
9 0.0705 1 1 2 1 1 2 1 1 1 1 3 1
10 0.12 1 1 2 1 1 2 1 1 1 1 3 1
and Dothideomycetidae. Other Ascomycota subclasses that were represented include Xylario-mycetidae and SaccharoXylario-mycetidae, as well as some taxa whose exact phylogenetic lineage is not yet properly resolved (e.g.Nigrospora). The phylum Basidiomocyta was represented by isolates affiliated with the generaTritirachiumandTilletiopsis. Some previous reports have claimed that basidiomycetes are largely excluded from aquatic habitats [2], however more recent studies have showed that they are relatively frequently retrieved in molecular studies of fungi in marine environments [4]. Future characterization of the salt tolerance of the Basidiomycota isolates identified in this study would be of interest, as Shearer and coworkers reported that only 10 of 465 known species of marine fungi are basidiomycetes [2]. Two isolates, recovered from sponge and intertidal sediment, returned best BLAST matches most closely related to the zygomycete
Syncephalastrum racemosum(S2 Table). We classified these isolates as‘unknown’due to the low % sequence identity with database sequences (see below). Their further characterization is of interest since zygomycetes were reported as mostly absent from aquatic habitats except when using dilution plating of sediments and water [2].
The analysis revealed 26 unknown OTUs and an additional 50 isolates corresponding to previously uncultured, unidentified fungal clones. Some of these isolates may represent already described fungal species, as available molecular information is particularly limited for marine fungi [50] with published ITS barcodes available for only approximately one fifth of the ca. 100,000 described fungal species [51]. We therefore refer to the 26 OTUs as unknown OTUs or unknown fungal lineages rather than new species (Figs2,3,4,5,6and7). Future efforts to genome sequence or barcode existing fungal type strains are needed to determine whether the unknown OTUs described in this study represent novel species or simply new strains of already described species. The results from this relatively small subsample of 290 fungal isolates suggest that the remaining nearly 1,500 fungal isolates in the AIMS Bioresources Library are likely to include further and considerable unknown or undescribed fungal diversity, emphasizing the value of such collections in exploring marine diversity and inherent bioactivity.
Analytical considerations
ITS barcodes. In recent decades the ITS1–5.8S-ITS2 region of the nuclear ribosomal gene operon has been successfully used for species delineation and analysis of fungal diversity [19]. However, caution has been recommended when using universal primers targeting this region in environmental samples via NGS techniques [20,60]. The ITS region occurs in multiple tan-dem repeats on one or more chromosomes allowing easy PCR amplification from minute amounts of DNA. The marker is known to possess a variable number of paralogous copies, in some cases not yet homogenized by concerted evolution [61], that may interfere severely with phylogenetic inference or species identification especially when population-level divergence has occurred or shallow diversification events are targeted [62,63].
Taxonomic incongruences were observed when isolates with affinity to Ascomycota yeasts, such asCandidaspp. andDebaryomyces hansenii, were recovered within the Basidiomycota/
Fungi incertae sedisclade (Fig 7). The barcodes produced in this study showed no ambiguous positions (i.e. double peaks) and low intraspecific variation suggesting that homogenization of the excessive paralogous copies via concerted evolution may have taken place. It is therefore plausible that several complexities may have contributed to inaccuracy. First, it is known that the marker’s intraspecific variability may vary significantly within groups of the fungal king-dom and its implications on fungal taxonomy and phylogenetics are still debated [64]. Second, the identification accuracy of new strains and sequences is limited if the coverage of the refer-ence database is not sufficiently complete [65]. In addition, a considerable portion of deposited fungal barcodes (ca. 20%) are suspected to be incorrectly annotated to species level [51,65,66]. However, since multiple strains were affected and their closest database matches differed, the latter two arguments are less likely to explain the taxonomic incongruences inFig 7. The observed topological anomaly illustrates the usefulness and the limitation of DNA barcodes; while they are suitable for tentative identification of isolates they have limited value for estab-lishing phylogenetic or evolutionary relationships. As the phylogenetic resolution power of a barcoding marker saturates with increasing number of sequences, accurate phylogenetic recon-structions in fungi require sequencing of multiple genes or complete genomes. Although this is achievable for taxa represented by isolates, it is beyond the scope of the current study.
Automated Barcode Gap Discovery. The influence of the multiple sequence alignment algorithm and evolutionary distance estimator in automatic OTU identification via ABGD was significant. Several quantitative approaches integrating tree-based methodologies (e.g. neigh-bor joining; NJ) or threshold-based automatic scoring of the number of OTUs are commonly used for barcode analysis [67–69]. Where clustering methods are applied, two preprocessing steps, namely sequence alignment and genetic distance evaluation, are essential for the accu-racy of the barcoding results. The process is achievable for small datasets and when gene-cod-ing barcodes, such as the Cytochrome oxidase I (COI), are aligned. Analysis typically involves manual editing steps such as translation of the sequences to amino-acids, alignment andde novotranslation to nucleotides, and trimming [70]. Erroneous local alignment on the other hand is more likely to occur for DNA regions characterized by high rates of change and sec-ondary structures such as the rRNA gene spacers or the 16S rRNA gene [71]. Any inaccurate alignments that remain after manual correction will influence directly the genetic distance cal-culation, the phylogeny and consequently falsify the choice of the threshold used in automatic procedures for OTUs delineation. The aforementioned effects are obviously dramatic when barcodes of unequal length, deriving from large environmental datasets of broad phylogenetic coverage and variable levels of molecular evolution, are analyzed [72].
uncharacterized groups and environmental data [17,43,73]. This study demonstrates that the choice and accuracy of the alignment algorithm has significant impact on downstream data analyses such as automated OTU delineation. For example, following sequence alignment by CLUSTAL-O, ABGD delivered 84 OTUs independently of the genetic distance correction. This result was comparable to those obtained with MUSCLE and KALIGN, while MAFFT was the most conservative algorithm producing only 67 OTUs (Table 2). Barcoding regions such as the ITS1–5.8S-ITS2 operon or the 16S rRNA gene embody secondary structure peculiarities and unequal substitution rates distributed throughout their length. Sequence alignment algo-rithms will consequently perform differently and according to their ability of incorporating secondary structure information in the alignment process.
Conclusions
This study represents a substantial step towards understanding the diversity, phylogeny, and ecology of marine fungi, which is currently vastly underexplored. It has also facilitated future detailed studies of marine fungal biology and ecology by contributing 290 barcoded viable marine-derived isolates available for further characterization including full-genome sequencing and other—omics based approaches. In addition, these viable cultures represent an important future resource for phylogeny-directed biodiscovery. Finally, our analytical approaches have further contributed to the development of standardized barcoding protocol pipelines to deter-mine unambiguous fungal OTUs, which will facilitate future studies of fungal genomics and physiology.
Supporting Information
S1 File. 290 sequences Clustal alignment. (TXT)
S2 File. 290 sequences Kalign alignment. (TXT)
S3 File. 290 sequences Mafft alignment. (TXT)
S4 File. 290 sequences Muscle alignment. (TXT)
S5 File. 349 sequences Kalign alignment. (TXT)
S1 Fig. ABGD statistics based on genetic distances inferred from sequence alignment per-formed in CLUSTAL OMEGA athttp://www.ebi.ac.uk/Tools/msa/clustalo/.Left column focuses on the Barcode gap zone (arrows) calculated from p-distance, K2P correction and the TN+G model respectively. The same pairwise comparisons are ranked in the middle column to visualize local slopes corresponding to the barcode gap zone. On the right column, grey dots denote the number of distinct groups (initial partitions) inferred from prior intraspecific diver-gence; red dots indicate the number of recursive partitions i.e. finer partitions until there is no further partitioning of the data.
(EPS)
respectively. The same pairwise comparisons are ranked in the middle column to visualize local slopes corresponding to the barcode gap zone. On the right column, grey dots denote the number of distinct groups (initial partitions) inferred from prior intraspecific divergence; red dots indicate the number of recursive partitions i.e. finer partitions until there is no further par-titioning of the data.
(EPS)
S3 Fig. ABGD statistics based on genetic distances inferred from sequence alignment per-formed in MUSCLE athttp://www.ebi.ac.uk/Tools/msa/muscle/.Left column focuses on the Barcode gap zone (arrows) calculated from p-distance, K2P correction and the TN+G model respectively. The same pairwise comparisons are ranked in the middle column to visualize local slopes corresponding to the barcode gap zone. On the right column, grey dots denote the number of distinct groups (initial partitions) inferred from prior intraspecific divergence; red dots indicate the number of recursive partitions i.e. finer partitions until there is no further par-titioning of the data.
(EPS)
S4 Fig. ABGD statistics based on genetic distances inferred from sequence alignment per-formed in KALIGN athttp://www.ebi.ac.uk/Tools/msa/kalign/.Left column focuses on the Barcode gap zone (arrows) calculated from p-distance, K2P correction and the TN+G model respectively. The same pairwise comparisons are ranked in the middle column to visualize local slopes corresponding to the barcode gap zone. On the right column, grey dots denote the number of distinct groups (initial partitions) inferred from prior intraspecific divergence; red dots indicate the number of recursive partitions i.e. finer partitions until there is no further par-titioning of the data.
(EPS)
S1 Table. Material information.Source material, collection location, jurisdiction, distance to nearest landmass or island, and salinity condition of inshore sites of analyzed fungal isolates. (DOCX)
S2 Table. BLAST results.Accession numbers of ITS barcode sequences, their best BLAST hit, and percentage sequence identity.
(DOCX)
Acknowledgments
NA is supported by the Commonwealth Research and Environment Facilities (CERF) Marine Biodiversity Hub. The CERF program is an Australian Government initiative supporting world class, public good research and is a collaborative partnership between the University of Tasma-nia, CSIRO Wealth from Oceans Flagship, Geoscience Australia, Australian Institute of Marine Science and Museum Victoria.
Author Contributions
References
1. Amaral-Zettler L, Artigas LF, Baross J, Bharathi L, Boetius A, Chandramohan D, et al. A global census of marine microbes. Life in the World’s Oceans: Diversity, Distribution and Abundance Oxford: Black-well Publishing Ltd. 2010:223–45.
2. Shearer CA, Descals E, Kohlmeyer B, Kohlmeyer J, Marvanová L, Padgett D, et al. Fungal biodiversity in aquatic habitats. Biodiversity and Conservation. 2007; 16(1):49–67.
3. Kohlmeyer J, Kohlmeyer E. Marine mycology: the higher fungi: Elsevier; 2013.
4. Richards TA, Jones MDM, Leonard G, Bass D. Marine fungi: their ecology and molecular diversity. Annual review of marine science. 2012; 4:495–522. PMID:22457985
5. Gerwick WH, Moore BS. Lessons from the past and charting the future of marine natural products drug discovery and chemical biology. Chemistry & biology. 2012; 19(1):85–98.
6. Zhang Y, Mu J, Feng Y, Kang Y, Zhang J, Gu P-J, et al. Broad-spectrum antimicrobial epiphytic and endophytic fungi from marine organisms: isolation, bioassay and taxonomy. Mar Drugs. 2009; 7(2):97–
112. doi:10.3390/md7020097PMID:19597575
7. Blunt JW, Copp BR, Keyzers RA, Munro MH, Prinsep MR. Marine natural products. Natural product reports. 2014; 31(2):160–258. doi:10.1039/c3np70117dPMID:24389707
8. Duarte K, Rocha-Santos TA, Freitas AC, Duarte AC. Analytical techniques for discovery of bioactive compounds from marine fungi. TrAC Trends in Analytical Chemistry. 2012; 34:97–110.
9. Thomas T, Rusch D, DeMaere MZ, Yung PY, Lewis M, Halpern A, et al. Functional genomic signatures of sponge bacteria reveal unique and shared features of symbiosis. The ISME journal. 2010; 4 (12):1557–67. doi:10.1038/ismej.2010.74PMID:20520651
10. Evans-Illidge EA, Logan M, Doyle J, Fromont J, Battershill CN, Ericson G, et al. Phylogeny Drives Large Scale Patterns in Australian Marine Bioactivity and Provides a New Chemical Ecology Rationale for Future Biodiscovery. Plos One. 2013; 8(9):e73800. doi:10.1371/journal.pone.0073800PMID: 24040076
11. Branco S. Fungal Diversity–An Overview, The Dynamical Processes of Biodiversity-Case Studies of Evolution and Spatial Distribution, PhD. Oscar Grillo (Ed.), ISBN: 978–953–307–772–7, In-Tech. 2011. 12. Lachance M-A. Yeast biodiversity: how many and how much? Biodiversity and ecophysiology of
yeasts: Springer; 2006. p. 1–9.
13. Pretorius I, Van der Westhuizen T, Augustyn O. Yeast biodiversity in vineyards and wineries and its importance to the South African wine industry. A review. South African Journal of Enology and Viticul-ture. 1999; 20:61–74.
14. Hibbett DS, Binder M, Bischoff JF, Blackwell M, Cannon PF, Eriksson OE, et al. A higher-level phyloge-netic classification of the Fungi. Mycological Research. 2007; 111(5):509–47.
15. Taylor JW, Jacobson DJ, Kroken S, Kasuga T, Geiser DM, Hibbett DS, et al. Phylogenetic species rec-ognition and species concepts in fungi. Fungal genetics and biology. 2000; 31(1):21–32. PMID: 11118132
16. Hebert PDN, Cywinska A, Ball SL, DeWaard JR. Biological identifications through DNA barcodes. P Roy Soc B-Biol Sci. 2003; 270(1512):313–21. doi:10.1098/rspb.2002.2218PMID:
ISI:000181064200013.
17. Puckridge M, Andreakis N, Appleyard SA, Ward RD. Cryptic diversity in flathead fishes (Scorpaeni-formes: Platycephalidae) across the Indo-West Pacific uncovered by DNA barcoding. Mol Ecol Resour. 2013; 13(1):32–42. doi:10.1111/1755-0998.12022PMID:23006488
18. Hebert PDN, Stoeckle MY, Zemlak TS, Francis CM. Identification of birds through DNA barcodes. Plos Biol. 2004; 2(10):1657–63. doi: ARTN e312 doi:10.1371/journal.pbio.0020312PMID:
ISI:000224737100022.
19. Schoch CL, Seifert KA, Huhndorf S, Robert V, Spouge JL, Levesque CA, et al. Nuclear ribosomal inter-nal transcribed spacer (ITS) region as a universal DNA barcode marker for Fungi. P Natl Acad Sci USA. 2012; 109(16):6241–6. doi:10.1073/pnas.1117018109PMID:ISI:000303246100068. 20. Bellemain E, Carlsen T, Brochmann C, Coissac E, Taberlet P, Kauserud H. ITS as an environmental
DNA barcode for fungi: an in silico approach reveals potential PCR biases. Bmc Microbiol. 2010; 10 (1):189. doi: Artn 189 doi:10.1186/1471–2180–10–189PMID:ISI:000280805400003.
21. Buée M, Reich M, Murat C, Morin E, Nilsson RH, Uroz S, et al. 454 Pyrosequencing analyses of forest soils reveal an unexpectedly high fungal diversity. New Phytologist. 2009; 184(2):449–56. doi:10. 1111/j.1469–8137.2009.03003.xPMID:19703112
Quercus woodland. Mycorrhiza. 2007; 18(1):15–22. Epub 2007/08/22. doi:10.1007/s00572–007–
0148-zPMID:17710446.
23. Wiese J, Ohlendorf B, Blumel M, Schmaljohann R, Imhoff JF. Phylogenetic Identification of Fungi Iso-lated from the Marine SpongeTethya aurantiumand Identification of Their Secondary Metabolites. Mar Drugs. 2011; 9(4):561–85. doi:10.3390/Md9040561PMID:ISI:000292632300007.
24. Notredame C. Recent progress in multiple sequence alignment: a survey. Pharmacogenomics. 2002; 3 (1):131–44. PMID:11966409
25. La Rosa M, Fiannaca A, Rizzo R, Urso A. Alignment-free analysis of barcode sequences by means of compression-based methods. Bmc Bioinformatics. 2013; 14 (Suppl 7), S4. doi: Artn S4 doi:10.1186/ 1471–2105–14-S7-S4PMID:ISI:000318869400004.
26. Rosenberg MS. Multiple sequence alignment accuracy and evolutionary distance estimation. Bmc Bio-informatics. 2005; 6(1), 278. doi: Artn 278 doi:10.1186/1471–2105–6–278PMID:
ISI:000234142200001.
27. Rosenberg MS. Evolutionary distance estimation and fidelity of pair wise sequence alignment. Bmc Bioinformatics. 2005; 6(1):102. doi: Artn 102 doi:10.1186/1471–2105–6–102PMID:
ISI:000228820700001.
28. Kimura M. Estimation of evolutionary distances between homologous nucleotide sequences. Proceed-ings of the National Academy of Sciences. 1981; 78(1):454–8.
29. Zharkikh A. Estimation of evolutionary distances between nucleotide sequences. Journal of molecular evolution. 1994; 39(3):315–29. PMID:7932793
30. Posada D, Crandall KA. Modeltest: testing the model of DNA substitution. Bioinformatics. 1998; 14 (9):817–8. PMID:9918953
31. Lu Y, Sze SH. Improving accuracy of multiple sequence alignment algorithms based on alignment of neighboring residues. Nucleic Acids Research. 2009; 37(2):463–72. doi:10.1093/Nar/Gkn945PMID: ISI:000262963400023.
32. Morrison-Gardiner S. Dominant fungi from Australian coral reefs. Fungal Divers. 2002; 9:105–21. 33. White T, Bruns T, Lee S, Taylor J. Amplification and direct sequencing of fungal ribosomal RNA genes
for phylogenetics. PCR protocols, a guide to methods and applications. 1990; 18:315–22.
34. Hall TA. BioEdit: a user-friendly biological sequence alignment editor and analysis program for Win-dows 95/98/NT. Nucleic Acids Symposium. 1999; 41:95–8.
35. Sievers F, Wilm A, Dineen D, Gibson TJ, Karplus K, Li W, et al. Fast, scalable generation of high-quality protein multiple sequence alignments using Clustal Omega. Molecular Systems Biology. 2011; 7(1). doi:http://www.nature.com/msb/journal/v7/n1/suppinfo/msb201175_S1.html.
36. Katoh K, Misawa K, Kuma Ki, Miyata T. MAFFT: a novel method for rapid multiple sequence alignment based on fast Fourier transform. Nucleic Acids Research. 2002; 30(14):3059–66. doi:10.1093/nar/ gkf436PMID:12136088
37. Edgar RC. MUSCLE: multiple sequence alignment with high accuracy and high throughput. Nucleic Acids Research. 2004; 32(5):1792–7. doi:10.1093/Nar/Gkh340PMID:ISI:000220487200025. 38. Lassmann T, Sonnhammer EL. Kalign-an accurate and fast multiple sequence alignment algorithm.
Bmc Bioinformatics. 2005; 6:298. Epub 2005/12/14. doi:10.1186/1471–2105–6–298PMID:16343337; PubMed Central PMCID: PMC1325270.
39. Swofford DL. PAUP*. Phylogenetic Analysis Using Parsimony (*and Other Methods). Version 4. Sinauer Associates, Sunderland. 2002.
40. Hillis DM, Huelsenbeck JP. Signal, noise and reliability in molecular phylogenetic analysis. J Hered. 1992; 83:189–95. PMID:1624764
41. Kimura M. A simple method for estimating evolutionary rates of base substitutions through comparative studies of nucleotide sequences. Journal of molecular evolution. 1980; 16(2):111–20. PMID:7463489 42. Tamura K, Peterson D, Peterson N, Stecher G, Nei M, Kumar S. MEGA5: Molecular Evolutionary
Genetics Analysis Using Maximum Likelihood, Evolutionary Distance, and Maximum Parsimony Meth-ods. Molecular Biology and Evolution. 2011; 28(10):2731–9. doi:10.1093/molbev/msr121PMID: 21546353
43. Puillandre N, Lambert A, Brouillet S, Achaz G. ABGD, Automatic Barcode Gap Discovery for primary species delimitation. Mol Ecol. 2012; 21(8):1864–77. doi:10.1111/j.1365–294X.2011.05239.xPMID: ISI:000302616200008.
44. Ronquist F, Huelsenbeck JP. MrBayes 3: Bayesian phylogenetic inference under mixed models. Bioin-formatics. 2003; 19(12):1572–4. Epub 2003/08/13. PMID:12912839.
46. Tamura K, Nei M. Estimation of the number of nucleotide substitutions in the control region of mitochon-drial DNA in humans and chimpanzees. Molecular Biology and Evolution. 1993; 10(3):512–26. PMID: 8336541
47. Nei M, Kumar S. Molecular evolution and phylogenetics: Oxford University Press; 2000. 48. Nei M, Zhang J. Evolutionary Distance: Estimation. eLS: John Wiley & Sons, Ltd; 2001.
49. Romo-Sanchez S, Alves-Baffi M, Arevalo-Villena M, Ubeda-Iranzo J, Briones-Perez A. Yeast biodiver-sity from oleic ecosystems: Study of their biotechnological properties. Food Microbiol. 2010; 27(4):487–
92. doi:10.1016/J.Fm.2009.12.009PMID:ISI:000278170500007.
50. Rämä T, Nordén J, Davey ML, Mathiassen GH, Spatafora JW, Kauserud H. Fungi ahoy! Diversity on marine wooden substrata in the high North. Fungal Ecology. 2014; 8:46–58.
51. Nilsson RH, Ryberg M, Abarenkov K, Sjökvist E, Kristiansson E. The ITS region as a target for charac-terization of fungal communities using emerging sequencing technologies. Fems Microbiol Lett. 2009; 296(1):97–101. doi:10.1111/j.1574-6968.2009.01618.xPMID:19459974
52. Thomas TRA, Kavlekar DP, LokaBharathi PA. Marine drugs from sponge-microbe association—A review. Mar Drugs. 2010; 8(4):1417–68. doi:10.3390/md8041417PMID:20479984
53. Blunt JW, Copp BR, Hu W-P, Munro M, Northcote PT, Prinsep MR. Marine natural products. Natural product reports. 2007; 24(1):31–86. PMID:17268607
54. Hyde KD, Jones EG, Leaño E, Pointing SB, Poonyth AD, Vrijmoed LL. Role of fungi in marine ecosys-tems. Biodiversity & Conservation. 1998; 7(9):1147–61.
55. Samuel P, Prince L, Prabakaran P. Assessment of mycological diversity of marine sediment of south-east coast of Tamilnadu, India. European Journal of Experimental Biology. 2011; 1(3):130–8. 56. Fabricius KE, De’ath G, Humphrey C, Zagorskis I, Schaffelke B. Intra-annual variation in turbidity in
response to terrestrial runoff on near-shore coral reefs of the Great Barrier Reef. Estuarine, Coastal and Shelf Science. 2013; 116:57–65.
57. Geiser DM, Taylor JW, Ritchie KB, Smith GW. Cause of sea fan death in the West Indies. Nature. 1998; 394(6689):137–8.
58. Bannister R. The ecology and feeding biology of the sponge Rhopaloeides odorabile: James Cook Uni-versity; 2008.
59. Bannister R, Battershill C, De Nys R. Suspended sediment grain size and mineralogy across the conti-nental shelf of the Great Barrier Reef: Impacts on the physiology of a coral reef sponge. Conticonti-nental Shelf Research. 2012; 32:86–95.
60. Bokulich NA, Mills DA. Improved Selection of Internal Transcribed Spacer-Specific Primers Enables Quantitative, Ultra-High-Throughput Profiling of Fungal Communities. Applied and Environmental Microbiology. 2013; 79(8):2519–26. doi:10.1128/AEM.03870-12PMID:23377949
61. Alvarez I, Wendel JF. Ribosomal ITS sequences and plant phylogenetic inference. Mol Phylogenet Evol. 2003; 29(3):417–34. doi:10.1016/S1055–7903(03)00208–2PMID:ISI:000186738000005. 62. Escobar D, Zea S, Sanchez JA. Phylogenetic relationships among the Caribbean members of the
Cliona viridiscomplex (Porifera, Demospongiae, Hadromerida) using nuclear and mitochondrial DNA sequences. Mol Phylogenet Evol. 2012; 64(2):271–84. doi:10.1016/j.ympev.2012.03.021PMID: ISI:000305374600003.
63. Abdul Wahab MA, Fromont J, Whalan S, Webster N, Andreakis N. Combining morphometrics with molecular taxonomy: How different are similar foliose keratose sponges from the Australian tropics? Mol Phylogenet Evol. 2014; 73:23–39. Epub 2014/01/22. doi:10.1016/j.ympev.2014.01.004PMID: 24445018.
64. Nilsson RH, Kristiansson E, Ryberg M, Hallenberg N, Larsson K-H. Intraspecific ITS variability in the kingdom Fungi as expressed in the international sequence databases and its implications for molecular species identification. Evolutionary bioinformatics online. 2008; 4:193. PMID:19204817
65. Nilsson RH, Ryberg M, Kristiansson E, Abarenkov K, Larsson K-H, Kõljalg U. Taxonomic reliability of DNA sequences in public sequence databases: a fungal perspective. Plos One. 2006; 1(1):e59. 66. Bridge PD, Roberts PJ, Spooner BM, Panchal G. On the unreliability of published DNA sequences.
New Phytologist. 2003; 160(1):43–8.
67. Ross HA, Murugan S, Li WL. Testing the reliability of genetic methods of species identification via simu-lation. Systematic Biol. 2008; 57(2):216–30. Epub 2008/04/10. doi:10.1080/10635150802032990 PMID:18398767.
69. Monaghan MT, Wild R, Elliot M, Fujisawa T, Balke M, Inward DJ, et al. Accelerated Species Inventory on Madagascar Using Coalescent-Based Models of Species Delineation. Systematic Biol. 2009; 58 (3):298–311. doi:10.1093/sysbio/syp027PMID:ISI:000270004400002.
70. Stern RF, Horak A, Andrew RL, Coffroth M-A, Andersen RA, Küpper FC, et al. Environmental barcoding reveals massive dinoflagellate diversity in marine environments. Plos One. 2010; 5(11):e13991. doi: 10.1371/journal.pone.0013991PMID:21085582
71. Schloss PD. The effects of alignment quality, distance calculation method, sequence filtering, and region on the analysis of 16S rRNA gene-based studies. Plos Comput Biol. 2010; 6(7):e1000844. doi: 10.1371/journal.pcbi.1000844PMID:20628621
72. Goertzen LR, Cannone JJ, Gutell RR, Jansen RK. ITS secondary structure derived from comparative analysis: implications for sequence alignment and phylogeny of the Asteraceae. Mol Phylogenet Evol. 2003; 29(2):216–34. doi:10.1016/S1055–7903(03)00094–0PMID:ISI:000185729200003.
73. Puillandre N, Modica MV, Zhang Y, Sirovich L, Boisselier MC, Cruaud C, et al. Large-scale species delimitation method for hyperdiverse groups. Mol Ecol. 2012; 21(11):2671–91. doi:10.1111/j.1365–
294X.2012.05559.xPMID:ISI:000304389500012.