A Multi-Criteria Decision Method in the DBSCAN
Algorithm for Better Clustering
Abdellah IDRISSI
Computer Sciences Laboratory (LRI), Computer Sciences Department
Faculty of Sciences, Mohammed V University of Rabat Rabat, Morocco
Altaf ALAOUI
Computer Sciences Laboratory (LRI), Computer Sciences Department
Faculty of Sciences, Mohammed V University of Rabat Rabat, Morocco
Abstract—This paper presents a solution based on the unsupervised classification for the multiple-criteria analysis problems of data, where the characteristics and the number of clusters are not predefined, and the objects of data sets are described by several criteria, and the latter can be contradictory, of different nature and varied weights. This work focuses on two different tracks of research, the unsupervised classification which is one of data mining techniques as well as the multi-criteria clustering which is part of the field of Multiple-criteria decision-making. Experimental results on different data sets are presented in order to show that clusters, formed using the improvement of the algorithm DBSCAN by incorporating a model of similarity, are intensive and accurate.
Keywords—Data mining; Clustering; Density-based clustering; Multiple-criteria decision-making
I. INTRODUCTION
Many studies showed that the resort to multiple-criteria analysis of the data in the classification establishes an effective approach for the extraction of the information, and that in optimal way in big databases described by several criteria, which are sometimes of different nature [1], [2]. To do it, several algorithms of different principles have been used in various different types of work. For example, UTADIS [3], [4][5] which presents the first and the only method belonging to the unique criterion synthesis approach. Basing on the utility functions apply only in the case cardinal data. In the first methods of assignment based on outranking relations approach, there is Trichotomic segmentation [6] and N-tomic (A Support System for Multicriteria Segmentation Problems) [7], had a limited number of categories and a fuzzy assignment. On the other side Electre-Tri [8] [9] [10] with its rather strong explanatory character, can handle any number of categories. There have been many developments since then [12]. But always with fuzzy assignment, an ordinal sorting and preorder structure. Thus the filtering method based on fuzzy preference
introduced the fuzzy assignment approach and
a binary relation of preference. The last techniques based on fuzzy indifference modeling, PROAFTN [13] [14], [15] and TRINOMFC [16] are the methods of nominal sorting which require no particular structure.
However, it is noticed that all these methods have for basic principle supervised learning. This tendency is confirmed by the studies of D' Henriet [16], Zopounidis [2], Belacel [17] and others who list the various algorithms of
multiple-criteria classification, and those classified in the family of multiple-criteria assignment based on supervised learning.
In spite of the superiority of the algorithms based on the supervised classification, their contribution remains limited in face to certain problems in which the information or/and the experience in the domain remain insufficient to predefine the clusters. To overcome this problem, some studies have begun researches by exploiting unsupervised learning.
In this sense, F.Anuska [1] introduces the research by evoking the multiple-criteria clustering problem and proposes the attempts of solution based on:
The reduction of the multiple-criteria analysis problem in clustering to clustering problem with single criterion obtained as a combination of the criteria;
The application of the techniques of clustering to grouping obtained by using single criteria clustering algorithms for each criteria;
The application of constrained clustering algorithms where a chosen criterion is considered as the clustering criterion and all others are determining for the constraints;
The modification of a hierarchical algorithm which would allow to solving the problem directly.
However, the indirect solutions proposed by F. Anuska direct towards NP-complete problems. And even direct solutions based on a hierarchical clustering method would be limited, because all the hierarchical clustering algorithms are efficient when the size of dataset does not exceed 100 objects [18], and they also are adapted for specific problems associated with areas having the separation or the regrouping of the objects, following the example of taxonomy in biology and in the natural evolution of the species [19].
according to their centroid by using an ordinal classification process such as ELECTRE [23]. In spite of the notoriety of K-means with a large number of variables, may be computationally faster than other clustering (if K is small), however the partitioning methods in clustering require fixed number of clusters can make it difficult to predict it. Moreover, this method is based on calculation of the distance, which obliges to establish the metric ones [24].
Taking into consideration all the limits evoked previously, this present paper proposes an approach of an unsupervised clustering algorithm based on the density. This algorithm is contributing to the resolution of the problem of clustering in a multidimensional way by using algorithm DBSCAN [25] and integrating a model of similarity inspired of the concept of the multiple-criteria decision analysis [26], [27] [28] [29] [30] [31]. This approach based on the density makes it possible to work on great databases without however determining beforehand the nature and the number of clusters, in this family of clustering much of work exists, quoting by way an example algorithm DGLC [32], OPTICS [33], DENCLUE [34], WaveCluster [35], CLICKS [36], CURD [37] AND DBSCAN [38]. And the choice of DBSCAN algorithm is justified by the fact that beyond supporting several types of data of which those of space, it is particularly effective when the groups are touched or in the presence of noise. It is also effective for the detection of non-convex clusters [38] [39]. It is also advisable to stress that the fact of working with the no modified version of DBSCAN algorithm, which leaves the result of this exploitable work by all other improved DBSCAN algorithms, following the example of OPTICS [33], DVBSCAN [40], VDBSCAN [41], DBCLASD [42], LDD-DBSCAN [43], NDCMD [44], ST-DBSCAN [45].
II. APPROACH PROPOSED:INVOLVING THE MULTI
-CRITERIA CONCEPT IN THE DBSCANALGORITHM
Both data mining research and Multiple-criteria decision-making have each specific and limited asset. As a result, the hybrid algorithm (DBSCAN modified) synergies the strengths of each algorithm in solving clustering problems.
A. DBSCAN (Density-Based Spatial Clustering of Applications with Noise)
DBSCAN [25], A Density Based Spatial Clustering of Application with Noise, is a density based clustering technique for discovering clusters of arbitrary shape as well as distinguishing noise. DBSCAN accepts a radius value
)
(
:
Eps
based on a user defined distance measure and a valueMinPts
for the number of minimal points that should occur withinEps
radius.The following are some concepts and terms that explain the DBSCAN algorithm as presented in [25]:
Eps-neighborhood: The Eps-neighborhood of a point p "
N
(
p
)
" is defined by:
N
(
p
)
q
D
p
q
dist
(
p
,
q
)
Eps
, with D as database of n objects. Core object: A core object contains at least a minimum number
MinPts
of other objects within its Eps-neighborhood. Directly reachable: A point p is directly density-reachable from a point q if
p
N
(
q
)
and q is a core point. Density-reachable: A point p is density-reachable from the point q with respect to
Eps
andMinPts
if there is a chain of points p1,..., pn, with p1 = q and pn = q such that pi+1 is directly density reachable from pi with respect toEps
andMinPts
, for 1 ≤ i ≤ n, pi
D. Density-connected: A point p is density connected to a point q with respect to
Eps
andMinPts
if there is a point
D
such that both p and q are density-reachable from o with respect toEps
andMinPts
. Nose: A point in D is a noise object if it does not belong to any cluster.
Cluster: A cluster C with respect to
Eps
andMinPts
is a non-empty subset of D satisfying the following conditions:
p
,
q
: ifp
C
and q density-reachable from p withEps
andMinPts
, thenq
C
(Maximality);
p
,
q
: p is density-connected to q withEps
andMinPts
. (Connectivity).B. The model of similarity and dissimilarity
The model of comparison used in our algorithm is composed of four stages by calculating the following functions (e.g. first object: alt1 and second object: alt2) [30] [38]:
The functions of similarity:
Sim ilar ity
i(
alt
1
,
alt
2
)
(1); The functions of the weighted similarity:
)
2
,
1
(
alt
alt
milarity
WeigthedSi
(2); The function of strong dissimilarity:
)
2
,
1
(
alt
alt
imilarity
StrongDiss
i (3); The functions of the overall similarity:
)
2
,
1
(
alt
alt
ilarity
OverallSim
(4).1) The function of similarity
In order to calculate the similarity (1) between two alternatives for each criterion "i" of the whole of criteria, we use the following functions:
1
,
1
:
)
2
,
1
(
alt
alt
D
D
Similarity
i ; Such D is2
alt1
if
1
2
alt1
if
1
)
2
,
1
(
i i
i i i i ialt
alt
alt
alt
Similarity
(1)Each criterion is determined by a threshold
i, denotes marginal similarity of the criterion "i" withi i
i
MaxCr
MinCr
0
, whereMaxCr
i andi
MinCr
are respectively the maximal value and the minimal value of the criterion "i".According to the results of the first function, we can conclude that the similarity of two alternatives "alt1" and "alt2" come as follows:
If
Similarity
i(
alt
1
,
alt
2
)
1
, then "alt1 "and "alt2" are similar on criterion "i"; If
Similarity
i(
alt
1
,
alt
2
)
1
, then "alt1" and "alt2" are not similar on criterion "i".2) The function of the weighted similarity
In this stage, the importance of every criterion is introduced, the function of the weighted similarity (2) is the sum of product of similarity
Similarity
i(
alt
1
,
alt
2
)
(1) and the weight "pi" of every criterion "i".
1
,
1
:
)
2
,
1
(
alt
alt
D
D
milarity
WeigthedSi
;Such D is the group of the objects (alternatives).
n i i i Similarity alt altp alt alt milarity WeigthedSi 1 (2) ) 2 , 1 ( ) 2 , 1 (
The results of this function can be classified in three cases:
If
0
WeigthedSi
milarity
(
alt
1
,
alt
2
)
1
, it implicates that it is more sure than not that "alt1" is similar to "alt2"; If
1
WeigthedSi
milarity
(
alt
1
,
alt
2
)
0
, it implicates that it is more sure that "alt1" is not similar to "alt2" than the opposite; If
WeigthedSi
milarity
(
alt
1
,
alt
2
)
0
, in this case we are in doubt whether object "alt1" is similar to object "alt2" or not.To reinforce results and to limit doubt, by passing to the third stage, this latter can calculate strong dissimilarity between two alternatives.
3) The function of strong dissimilarities
This stage of the model allows to calculating strong dissimilarity (3) between two alternatives by using the following function:
0
,
1
.
:
)
2
,
1
(
alt
alt
D
D
imilarity
StrongDiss
iSuch D is the group of the objects.
(3) 0 2 alt1 1 ) 2 , 1 ( . i elseif alt if alt alt imilarity
StrongDiss i i i
Where
i is the threshold of strong dissimilarity, such as:i i
i
i
MaxCr
MinCr
.If
StrongDiss
imilarity
i(
alt
1
,
alt
2
)
1
implicates that "alt1" and "alt2" are strongly dissimilar on criterion "i".In certain cases two alternatives can be similar in most criteria but there is a strong dissimilarity on the other criteria.
4) The functions of overall similarities
The last stage of the model of comparison allows us to introduce a total similarity (4). With the aid of following functions, we can finalize this model of comparison.
1
,
1
;
:
)
2
,
1
(
alt
alt
D
D
ilarity
OverallSim
)) 2 , 1 ( , ), 2 , 1 ( ), 2 , 1 ( ( ) 2 , 1 ( 1 alt alt imilarity StrongDiss alt alt imilarity StrongDiss alt alt milarity WeigthedSi mm alt alt ilarity OverallSim m With this function:
mm
:
1
,
1
q
1
,
1
.
(5)
0
0
)
,
,
(
min
0
)
,
,
max(
)
,
,
(
1 1 1
elseif
p
if
p
p
p
if
p
p
p
p
mm
q ii q
q
If
WeigthedSi
milarity
(
alt
1
,
alt
2
)
0
and there is no strong dissimilarity between both alternatives "alt1"and "alt2", it implicates that
)
2
,
1
(
)
2
,
1
(
alt
alt
milarity
WeigthedSi
alt
alt
ilarity
OverallSim
In that case we can conclude that both alternatives "alt1" and "alt2" are similar;
If
WeigthedSi
milarity
(
alt
1
,
alt
2
)
0
and there is a strong dissimilarity between both alternatives "alt1" and "alt2" with one or several criteria, it implicates that0
)
2
,
1
(
alt
alt
ilarity
OverallSim
. In this case,we must prove the number of criteria where there is a strong dissimilarity and a weight of these criteria;
If
WeigthedSi
milarity
(
alt
1
,
alt
2
)
0
and there is a strong dissimilarity between both alternatives "alt1 "and "alt2" on one or several criteria, it implicates that1
)
2
,
1
(
alt
alt
ilarity
OverallSim
. ThereforeC. Description of the algorithm
D denote a set of n objects, where each object of this list is described on m criteria of nominal, interval, ordinal and/or cardinal type. The evaluation of an object on criteria j can be encoded in real interval bounded by the minimal and maximal value of this criteria "i":
MaxCr
i,
MinCr
i
.The relative importance of which criterion intervenes in assessing the comparison between two objects is not always equivalent and can influence the final result of a multi-criterion analysis. Therefore, the presence of a coefficient related to every criterion; witch reflects the importance in comparison with other criteria; is a primordial aspect in an algorithm to appoint a weight to every criterion with:
p
i
0
,
1
and1
1
n
i i
p
.The algorithmic approach can be structured into the following steps:
1) Choose an arbitrary object "
alt
i
D
" of the set of alternatives;2) Calculate similarity (1) and strong dissimilarity (3) of this object "alt" with every object of the set of alternatives;
3) Calculate the weighted similarity (2) of this object "
i
alt
";4) Calculate the overall similar (4) this object "
alt
i"; 5) Test the value of overall similar (4) and the presence of strong dissimilarity (3) which allows the determination if the alternative is considered to be a neighborhood of the object "i
alt
";6) Recover all objects density-connected to the object "
i
alt
" on the parameters of overall similar (4) and the parameter "MinPts
"; If "
alt
i" is a core object, a cluster is formed; If "
alt
i" is a point of border, therefore any points can be density-connected to "alt
i" and the algorithm visits the following object of the set of alternatives;7) This sequence continues until the density-connected cluster is completely and definitively found.
D. Multi-Criteria-DBSCAN Algorithm
Algorithm MC-DBSCAN(D,
,
,p
,MinPts
) //Inputs:
//D={a1,a2,..., an} set of alternatives(objects)
//
: threshold denote marginal similaritydiscrimination threshold of the criterion
//
: is the threshold of strong dissimilarity//
p
: set of weights of every criterion//
MinPts
: the number of minimal points that should occur within Eps radius//Output:
//C={c1, c2,..., ck} set of clusters Cluster_Label=0
for i=1 to |D|
if
a
iis not cluster thenfor j=1 to |D|
)
,
(
Similarity
L
1
a
ia
j (1)
L
2
StrongDiss
imilarity(
a
i,
a
j)
(3)(2)
)
,
ilarity(
OverallSim
X
X
L
2L
3(4) end for
if |X| <
MinPts
thenmarke
a
ias noiseelse
Cluster_Label= Cluster_Label+1
add
a
ito clusterfor i=1 to |X|
if
a
i'is not cluster thenfor j=1 to |D|
)
,
(
Similarity
L
1'
a
i'a
j' (1))
,
imilarity(
StrongDiss
L
' ' '2
a
ia
j (3))
milarity(
WeightedSi
L
3'
L
1' (2))
,
ilarity(
OverallSim
X
'2 ' 3 '
'
L
L
X
(4)end for
if |X'| >=
MinPts
thenX = X U X'
if
a
i' is not cluster thenadd
a
i' to clusterend for end for
Algorithm 1: MC-DBSCAN Algorithm
III. EXPERIMENTATION AND RESULTS
To test and to assess the performances of our algorithm, we implemented the DBSCAN and the MC-DBSCAN algorithms by using Java as a language to implement the algorithms.
Performances of both algorithms DBSCAN and MC-DBSCAN are assessed on a few well-known datasets such as the Stulong [48], Iris [46], BasketBall [48], ColorHistogram
)
milarity(
WeightedSi
[48] and other ones from UCI Machine Learning Repository [47]and KEEL Knowledge Extraction based on Evolutionary Learning [48].
For these tests to reflect correctly the performance of an algorithm, we compare the number of groups created by both algorithms and the percentage of non classified objects by varying parameters knowing that common parameters, ray locating maximum neighbors "
Eps
:
(
)
" and the minimum number of points that have to be present in Eps- neighborhoodof this object "
MinPts
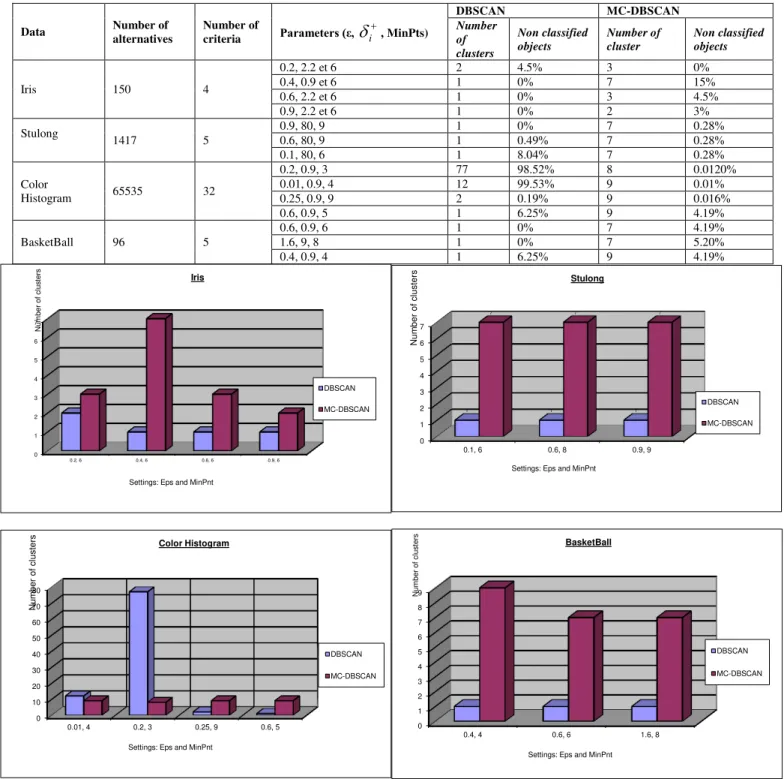
", we have the same values as both algorithms.In the results table "Tab. 1" due to the global parameter Eps and MinPts, DBSCAN classifies objects in one class because it is not able to consider several criteria simultaneously.
The results presented in "Fig. 1" and "Fig. 2" prove that the classes obtained by the multi criteria clustering algorithm are very similar to groups that have been proposed by experts and that the percentage of non-classified objects is too low.
TABLE I. COMPARISON OF RESULTS BETWEEN TWO ALGORITHMS:DBSCAN AND MC-DBSCAN
Data Number of alternatives
Number of
criteria Parameters (ε,
i
, MinPts)DBSCAN MC-DBSCAN
Number of clusters
Non classified objects
Number of cluster
Non classified objects
Iris 150 4
0.2, 2.2 et 6 2 4.5% 3 0%
0.4, 0.9 et 6 1 0% 7 15%
0.6, 2.2 et 6 1 0% 3 4.5%
0.9, 2.2 et 6 1 0% 2 3%
Stulong 1417 5 0.9, 80, 9 0.6, 80, 9 1 1 0% 0.49% 7 7 0.28% 0.28%
0.1, 80, 6 1 8.04% 7 0.28%
Color
Histogram 65535 32
0.2, 0.9, 3 77 98.52% 8 0.0120%
0.01, 0.9, 4 12 99.53% 9 0.01%
0.25, 0.9, 9 2 0.19% 9 0.016%
0.6, 0.9, 5 1 6.25% 9 4.19%
BasketBall 96 5
0.6, 0.9, 6 1 0% 7 4.19%
1.6, 9, 8 1 0% 7 5.20%
0.4, 0.9, 4 1 6.25% 9 4.19%
Fig. 1. Results assimilation of several clustering database by varying the parameters
0 10 20 30 40 50 60 70 80
0.01, 4 0.2, 3 0.25, 9 0.6, 5
Num
b
e
r
o
f
cl
u
ste
rs
Settings: Eps and MinPnt
Color Histogram
DBSCAN MC-DBSCAN
0 1 2 3 4 5 6 7
0.1, 6 0.6, 8 0.9, 9
1 1 1
7 7 7
Num
b
e
r
o
f
cl
u
ste
rs
Settings: Eps and MinPnt
Stulong
DBSCAN MC-DBSCAN
0 1 2 3 4 5 6 7 8 9
0.4, 4 0.6, 6 1.6, 8
N
u
m
b
e
r
o
f
cl
u
st
e
rs
Settings: Eps and MinPnt
BasketBall
DBSCAN MC-DBSCAN
0 1 2 3 4 5 6 7
0.2, 6 0.4, 6 0.6, 6 0.9, 6
N
u
m
b
e
r
o
f
cl
u
st
e
rs
Settings: Eps and MinPnt
Iris
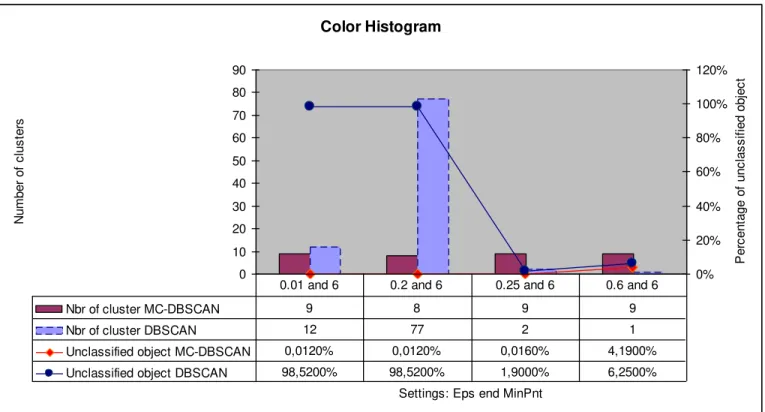
Fig. 2. Assimilation of the number of class obtained and the percentage of unclassified objects to the database "Color Histogram" between the two algorithms DBSCAN and MC-DBSCAN
The proposed algorithm allows for an experimental comparative study between the results by varying the relative importance regarding the criteria involved in the evaluation of assimilation between two actions.
Regarding the proposed algorithm, the weight change may influence the final outcome of a multi-criteria analysis "Fig. 3", while DBSCAN algorithm does not consider the indifference between the relative importances of each criterion.
Fig. 3. Class Number obtained by the MC-DBSCAN algorithm applied to the Iris database by setting the input parameters (Eps = 0.4 and MinPts = 6) and by varying the relative importance to each criteria.Abbreviations and Acronyms
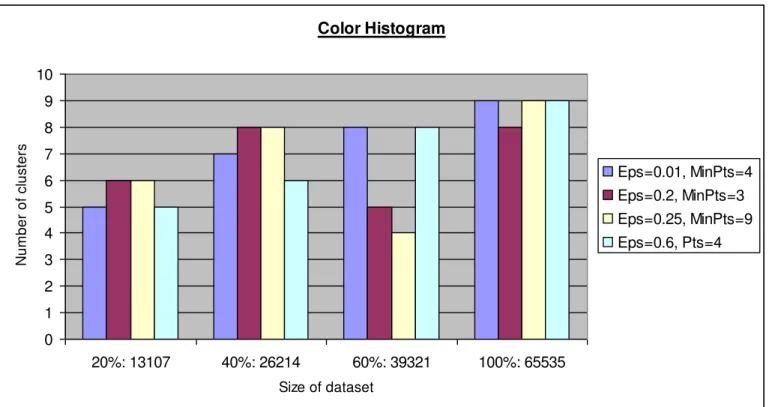
The purpose of this final test is to evaluate the performance of the suggested algorithm on the same database by increasing
Color Histogram
0 10 20 30 40 50 60 70 80 90
Settings: Eps end MinPnt
N
u
m
b
e
r
o
f
c
lu
s
te
rs
0% 20% 40% 60% 80% 100% 120%
P
e
rc
e
n
ta
g
e
o
f
u
n
c
la
s
s
if
ie
d
o
b
je
c
t
Nbr of cluster MC-DBSCAN 9 8 9 9
Nbr of cluster DBSCAN 12 77 2 1
Unclassified object MC-DBSCAN 0,0120% 0,0120% 0,0160% 4,1900%
Unclassified object DBSCAN 98,5200% 98,5200% 1,9000% 6,2500%
0.01 and 6 0.2 and 6 0.25 and 6 0.6 and 6
Iris w ith: (Eps=0.4 and MinPts=6)
0 1 2 3 4 5 6 7 8
0.25, 0.25, 0.25, 0.25 0.45, 0.05, 0.45, 0.05
Weight for each criteria(C1, C2, C3, C4)
N
u
m
b
e
r
o
f
c
lu
s
te
its size. In this test, we apply the MC-DBSCAN algorithm on the database "Color Histogram" of a varying size between 1300 and 65000 objects by changing the input parameters.
Reading the "Fig.4" show that even if the size of the database increases from 1300 up to 65,000 objects, the results
remain in the standard, which explains that the added objects by increasing the size will affect the created classes but not the creation of new classes.
Fig. 4. Test result applied to the database "Color Histogram" by increasing the size of DataSet (Number of class obtained by increasing the size)
IV. CONCLUSION
This work has eventually reached a new clustering algorithm which contributes to resolving the multiple-criteria clustering problem with various weights to the relative importance to each criterion.
This new approach is based on the clustering by the enhancement of the DBSCAN algorithm which was merged with multiple-criteria decision-making.
However, it is necessary to highlight the need to further improve the performance of the algorithm. Because MC-DBSCAN like most clustering algorithms requires in advance a manual determination of input parameters.
It becomes clear that is by minimizing the human intervention relative to the determination of the input parameters will give us a better result.
REFERENCES
[1] A. Ferligoj, and V. Batagelj, Direct multicriteria clustering algorithms. Journal of Classification, 9, 43-61, 1992.
[2] C. Zopounidis and M. Doumpos, Multicriteria classification and sorting methods: A literature review, European Journal of Operational Research, vol.138, no.2, pp.229-246, 2002.
[3] M. Doumpos and C. Zopounidis, A multicriteria discrimination method for the prediction of financial distress: the case of Greece, Multinational Finance Journal 3(2): 71–101,1999.
[4] M. Doumpos and C. Zopounidis, A multicriteria classification approach based on pairwise comparisons. European Journal of Operational Research, 158, 378–389, 2004.
[5] E. Dehghan Manshadi, M. Reza Mehregan and H. Safari, Supplier Classification Using UTADIS Method Based on Performance Criteria. International Journal of Academic Research in Business and Social Sciences February 2015, Vol. 5, No. 2 ISSN: 2222-6990
[6] B. Roy, A multicriteria analysis for trichotomic segmentation problems, In P. Nijkamp and J. Spronk (Eds), Multiple criteria analysis: Operational methods (pp. 245-257), Aldershot: Gower Press, 1981. [7] M. Massaglia, and A. Ostanello, "N-TOMIC: A decision support for
multicriteria segmentation probles", in: P. Korhonen (ed.), International Workshop on Multicriteria Desicion Support, Lecture Notes in Economics and Mathematics Systems 356, Springer-Verlag, Berlin, 167-174, 1991.
[8] V. Mousseau and R. Slowinski, Inferring an ELECTRE TRI model from assignment examples. Journal of Global Optimization, 12(2):157-174, 1998.
[9] Mousseau, V., Figueira, J., Naux, J.-Ph., Using assignment examples to infer weights for ELECTRE-TRI method: Some experimental results. European Journal of Operational Research 130 (2), 263–275, 2001. [10] B. Roy, Presentation et interpretation de la methode ELECTRE TRI
pour affecter des zones dans des categories de risque. Document du LAMSADE 124, Universite Paris-Dauphine, Paris, France, 2002. [11] M. M. Köksalan, V. Mousseau, Ö. Özpeynirci, and S. Özpeynirci, A
new outranking-based approach for assigning alternatives to ordered classes, Nav Res Log 56, 74–85, 2009.
[12] N. Belacel and M.R. Boulassel, Multicriteria fuzzy classification procedure PROCFTN: methodology and medical application. Fuzzy Sets and Systems, 141# 2, 203-217, 2004.
Color Histogram
0 1 2 3 4 5 6 7 8 9 10
20%: 13107 40%: 26214 60%: 39321 100%: 65535
Size of dataset
N
u
m
b
e
r
o
f
cl
u
st
e
rs
[13] N. Belacel, "Multicriteria assignment method PROAFTN: Methodology and medical applications", European Journal of Operational Research, 125, 175-183,2000.
[14] F. Al-Obeidat, N. Belacel, J. A. Carretero and P. Mahanti, "An evolutionary framework using particle swarm optimization for classification method PROAFTN". Applied Soft Computing 11 (8): 4971–4980. doi:10.1016/j.asoc.2011.06.003,2011.
[15] J. Léger and J.-M. Martel, A multicriteria assignment procedure for a nominal sorting problematic. European Journal of Operational Research, 138#2, 349-364, 2002.
[16] L. Henriet, "Evaluation systems and Multicriteria Classification To Help In The Decision, Construction Model And Assignment Procedures", Doctoral Thesis, University Paris Dauphine, 2000. [“Systèmes
D'évaluation Et De Classification Multicritères Pour L'aide A La Décision, Construction De Modèles Et Procédures D'affectation”. Thèse de doctorat en sciences, Université Paris Dauphine, 2000] (French). [17] N. Belacel, " Multi-criteria classification methods: methodology and
application to aid medical diagnosis", Doctoral Thesis, University Bruxelles, 1999. [Méthodes de classification multicritère: méthodologie et application à l'aide au diagnostic médical. thèse de doctorat: Université libre de Bruxelles (Service de mathématiques de la gestion). 1999.] (French)
[18] P. Hansen and B. Jaumard, Cluster Analysis and Mathematical Programming. Mathematic Programming, 79, 191-215, 1997.
[19] G. Cleuziou; "A method for unsupervised learning rules and seeking information classification", [Une méthode de classification non-supervisée pour l'apprentissage de règles et la recherche d'information. Other. Université d'Orléans, 2004] (French)
[20] C. Rocha, L.C. Dias and I. Dimas, “Multicriteria Classification with
Unknown Categories: A Clustering-Sorting Approach and an
Application to Conflict Management”, Journal of Multi-Criteria Decision Analysis, Vol. 20, No. 1-2, 13–27, 2013.
[21] Y. De Smet and L. Montano Guzm´an, Towards multicriteria clustering: An extension of the k-means algorithm. European Journal of Operational Research, 158(2):390–398, oct 2004.
[22] J. B. MacQueen, “Some methods for classification and analysis of
multivariate observations,” in Proceeding of the fifth Berkeley Symposium on Mathematical Statistics and Probability, L. M. L. Cam and J. Neyman, Eds., vol. 1. University of California Press, 1967, pp. 281–297.
[23] B. Roy and D. Bouyssou, " Multicriteria Decision: Methods and Case " [Aide Multicritère à la Décision: Methodes et cas. Economica: Paris, 1993.] (French)
[24] K. Kameshwaran1 and K. Malarvizhi, Survey on Clustering Techniques in Data Mining, International Journal of Computer Science and Information Technologies, Vol. 5 (2), 2272-2276, 2014.
[25] M. Ester, H.P. Kriegel, J. Sander and X. Xu, "A Density-Based Algorithm for Discovering Clusters in Large Spatial Databases with Noise," In Proceedings of the 2nd International Conference on
Knowledge Discovery and Data Mining (KDD’96), Portland: Oregon,
pp. 226-231,1996.
[26] B. Roy. "multi-criteria decision support methods" [Méthodologie multicritère d'aide à la décision. Economica, Paris, 1985.] (French) [27] K. Jabeur, J.-M. Martel and S. Ben Khélifa, A distance-based collective
preorder integrating the relative importance of the groups members, Group Decision and Negotiation 13, 327-349.26, 2004.
[28] R. B., Multicriteria methodology for decision aiding, Kluwer Academic Publishers, Dordrecht. 1996
[29] J.-L. Maricha, Fuzzy measures and integrals in the mcda sorting problematic, Th. Doct. Univ. Libre de Bruxelles 202; 2003.
[30] R. Bisdorff, P. Meyer and A.-L. Olteanu, A clustering approach using weighted similarity majority margins, Springer-Verlag Berlin
Heidelberg, Volume 7120 of the series Lecture Notes in Computer Science pp 15-28, DOI. 10.1007/978-3-642-25853-4-2, 2011.
[31] P. M. Raymond Bisdor and A. L. Olteanu, Weighted similarity majority margins based multiple attributes clustering, ADMA. Advanced Data Mining and Applications Part I (LNAI 7120)15-28, 2011.
[32] J. Ruiz-Shulcloper, E. Alba-Cabrera and G. Sanchez-Diaz, DGLC: a density-based global logical combinatorial clustering algorithm for large mixed incomplete data, Geoscience and Remote Sensing Symposium, Proceedings, IGARSS, IEEE 2000 International, 2000.
[33] M. Ankerst, M. Breunig, H.P. kriegel, and J. Sander, "OPTICS: Ordering points to identify the clustering structure," In Proc. 1999 ACM-SIGMOD Int. Conf. Management of data (SIGMOD’96), 1999.
[34] S. Xue-gang, C. Qun-xiu and M. Liang, “study on topic-based web
clustering”, The Journal of Chinese Information Processing, Vol 17, No.
3, pp.21-26, 2003.
[35] G. Sheikholeslami, S. Chatterjee and A. Zhang, “WaveCluster: A multi -resolution clustering approach for very large spatial databases”,
Proceeding 24th International Conference on Very Large Data Bases, pp. 428-439, New York City, NY, 1998.
[36] R. Agrawal, J. Gehrke, D. Gunopulos and P. Raghavan, “Automatic
subspace clustering of high dimensional data for data mining
applications”, Proceeding ACM SIGMOD '98 International Conference on Management of Data, pp. 94-105, Seattle, WA, 1998.
[37] M. Shuai , W. TengJiao, T. ShiWei, Y. DongQing and G. Jun, A New Fast Clustering Algorithm Based on Reference and Density. Proc. of WAIM, pp. 214-225, 2003
[38] M. Ester, H.-P. Kriegel, J. Sander and X. Xu, A density-based algorithm for discovering clusters in large spatial databases with noise, In Proceedings of the 2nd International Conference on Knowledge Discovery and Data Mining (KDD96) 226-231, 1996.
[39] G. Sheikholeslami, C. Surojit and Z. Aidong, Wavecluster: A multi-resolution clustering approach for very large spatial databases, Proceeding 24th International Conference on Very Large Data Bases 428-439, 1998.
[40] R. Anant, J. Sunita, S. Anand and K. Manoj, “A density Based Algorithm for Discovery Density Varied cluster in Large spatial
Databases”, International Journal of Computer Application Volume
3,No.6, June 2010.
[41] Peng Liu, Dong Zhou, Naijun Wu,” VDBSCAN: Varied Density Based Spatial Clustering of Application with Noise”, in proceedings of IEEE
Conference ICSSSM 2007 pg 528-531, 2007.
[42] A.K.M Rasheduzzaman Chowdhury and Md.Asikur Rahman, “An
efficient Mehtod for subjectively choosing parameter k automatically in
VDBSCAN”,proceedings of ICCAE 2010 IEEE,Vol 1,pg 38-41, 2010. [43] S. Richa, M. Bhawna and R. Anant, “Local Density Differ Spatial
Clustering in Data Mining”, International Journal of Advanced Research
in Computer Science and Software Engineering, ISSN: 2277 128X, Volume 3, Issue 3, March 2013
[44] Khushali Mistry, Swapnil Andhariya, Prof. Sahista Machchhar,
“NDCMD: A Novel Approach Towards Density Based Clustering Using Multidimensional Spatial Data”, International Journal of Engineering Research & Technology, ISSN: 2278-0181 www.ijert.org IJERTIJERT Vol. 2 Issue 6, June – 2013
[45] D. Birant and A. Kut, “St-dbscan: An algorithm for clustering
spatial-temporal data.” Data Knowl Eng 60(1):208–221, 2007.
[46] L.C. Dias and V. Mousseau. IRIS : A DSS for multiple criteria sorting. Journal of Multi-Criteria Decision Analysis, 12:285–298, 2003. [47] Frank, A. Asuncion, Uci machine learning repository.