HOMER2, a Stereociliary Scaffolding Protein,
Is Essential for Normal Hearing in Humans
and Mice
Hela Azaiez1, Amanda R. Decker2☯, Kevin T. Booth1☯, Allen C. Simpson1☯,
A. Eliot Shearer1, Patrick L. M. Huygen3, Fengxiao Bu1, Michael S. Hildebrand4,
Paul T. Ranum1, Seiji B. Shibata1, Ann Turner5, Yuzhou Zhang1, William J. Kimberling1, Robert A. Cornell2, Richard J. H. Smith1,6*
1Molecular Otolaryngology and Renal Research Laboratories, Department of Otolaryngology University of Iowa, Iowa City, Iowa, United States of America,2Department of Anatomy and Cell Biology, Carver College of Medicine, University of Iowa, Iowa City, Iowa, United States of America,3Department of
Otorhinolaryngology, Radboud University Nijmegen Medical Centre, Nijmegen, Netherlands,4Austin Health, Department of Medicine, University of Melbourne, Melbourne, Australia,5Self-employed physician, Menlo Park, California, United States of America,6Interdepartmental PhD Program in Genetics, University of Iowa, Iowa City, Iowa, United States of America
☯These authors contributed equally to this work.
Abstract
Hereditary hearing loss is a clinically and genetically heterogeneous disorder. More than 80 genes have been implicated to date, and with the advent of targeted genomic enrichment and massively parallel sequencing (TGE+MPS) the rate of novel deafness-gene identifica-tion has accelerated. Here we report a family segregating post-lingual progressive autoso-mal dominant non-syndromic hearing loss (ADNSHL). After first excluding plausible variants in known deafness-causing genes using TGE+MPS, we completed whole exome sequencing in three hearing-impaired family members. Only a single variant, p.Arg185Pro inHOMER2, segregated with the hearing-loss phenotype in the extended family. This amino acid change alters a highly conserved residue in the coiled-coil domain of HOMER2 that is essential for protein multimerization and the HOMER2-CDC42 interaction. As a scaf-folding protein, HOMER2 is involved in intracellular calcium homeostasis and cytoskeletal organization. Consistent with this function, we found robust expression in stereocilia of hair cells in the murine inner ear and observed that over-expression of mutant p.Pro185
HOMER2mRNA causes anatomical changes of the inner ear and neuromasts in zebrafish
embryos. Furthermore, mouse mutants homozygous for the targeted deletion ofHomer2 present with early-onset rapidly progressive hearing loss. These data provide compelling evidence that HOMER2 is required for normal hearing and that its sequence alteration in hu-mans leads to ADNSHL through a dominant-negative mode of action.
a11111
OPEN ACCESS
Citation:Azaiez H, Decker AR, Booth KT, Simpson AC, Shearer AE, Huygen PLM, et al. (2015) HOMER2, a Stereociliary Scaffolding Protein, Is Essential for Normal Hearing in Humans and Mice. PLoS Genet 11(3): e1005137. doi:10.1371/journal. pgen.1005137
Editor:Karen B. Avraham, Tel Aviv University, ISRAEL
Received:January 19, 2015
Accepted:March 10, 2015
Published:March 27, 2015
Copyright:© 2015 Azaiez et al. This is an open access article distributed under the terms of the
Creative Commons Attribution License, which permits unrestricted use, distribution, and reproduction in any medium, provided the original author and source are credited.
Data Availability Statement:All relevant data are within the paper and its Supporting Information files.
Author Summary
The most frequent sensory disorder worldwide is hearing impairment. It impacts over 5% of the world population (360 million persons), and is characterized by extreme genetic het-erogeneity. Over 80 genes have been implicated in isolated (also referred to as‘ non-syndromic’) hearing loss, and abundant evidence supports the existence of many more
‘deafness-causing’genes. In this study, we used a sequential screening strategy to first ex-clude causal mutations in known deafness-causing genes in a family segregating autosomal dominant non-syndromic hearing loss. We next turned to whole exome sequencing and identified a single variant—p.Arg185Pro inHOMER2—that segregated with the
pheno-type in the extended family. To validate the pathological significance of this mutation, we studied two animal models. In zebrafish, we overexpressed mutant HOMER2 and ob-served inner ear defects; and in mice we documented robust expression in stereocilia of co-chlear hair cells and demonstrated that its absence causes early-onset progressive deafness. Our data offer novel insights into gene pathways essential for normal auditory function and the maintenance of cochlear hair cells.
Introduction
Targeted genomic enrichment and massively parallel sequencing (TGE+MPS) have revolution-ized the field of hereditary hearing loss (HHL) by making comprehensive genetic testing for deafness a clinical reality and by accelerating the discovery of novel deafness-causing genes [1,2]. To date over 80 genes have been causally implicated in non-syndromic hearing loss (NSHL; Hereditary Hearing Loss Homepage). The proteins encoded by these genes are in-volved in a broad array of molecular and cellular mechanisms essential for the development and maintenance of normal auditory function [3]. At the centerpiece of this intricate system are the outer and inner hair cells (OHCs, IHCs)—key structures in the mechanotransduction process by which mechanical stimuli are translated into electrical impulses [4]. The precise and efficient tuning of OHCs and IHCs is closely linked to their anatomical integrity and the coor-dinated movement of their apical stereocilia.
The Homer proteins are scaffolding proteins crucial to many intracellular signaling cascades; their function underpins a variety of neuronal processes ranging from calcium homeostasis and cytoskeletal organization to synaptic plasticity associated with learning and memory [5,6]. Homer proteins are encoded by three genes;HOMER1,2, and3(MIM 604798, MIM 604799
and MIM 604800, respectively) that are translated into multiple isoforms as a result of alterna-tive splicing [7]. All isoforms share an N-terminal conserved EVH1 (Ena VASP Homology 1) domain, which binds proline-rich regions of target proteins. The long isoforms (HOMER1b and c, HOMER2, HOMER3) additionally have a coiled-coil (CC) region and leucine zipper mo-tifs in their divergent C-termini [8]. The CC region is required for homo/hetero-multimeriza-tion to form tetrameric hubs (in which the CC domains align in a parallel fashion) and for interaction with Rho family GTPase proteins like CDC42 (MIM 116952) [9–11]. Although the short isoforms lack CC domains and therefore do not form multimers, like their longer counter-parts they bind target proteins through their EVH1 domain. This interaction regulates the activ-ity of proteins involved in Ca2+signaling complexes including metabotropic glutamate
receptors (mGluR) [12], inositol tri-phosphate receptors (IP3R) [8] and transient receptor
po-tential canonical channels (TRPC) [13]. Homer proteins also regulate basal cytosolic calcium via an interaction with the plasma membrane calcium reuptake pump, PMCA [14,15]. to RAC. The funders had no role in study design,
data collection and analysis, decision to publish, or preparation of the manuscript.
Aberrant Homer signaling has been associated with several developmentally related logical syndromes including Fragile X syndrome, epilepsy, addiction, schizophrenia, neuro-pathic pain and Alzheimer’s disease [16–19]. To this list we now add autosomal dominant NSHL (ADNSHL).
Results and Discussion
Clinical description and progression of hearing loss
The family segregating the deafness-causing mutation inHOMER2(MIM 604799; RefSeq
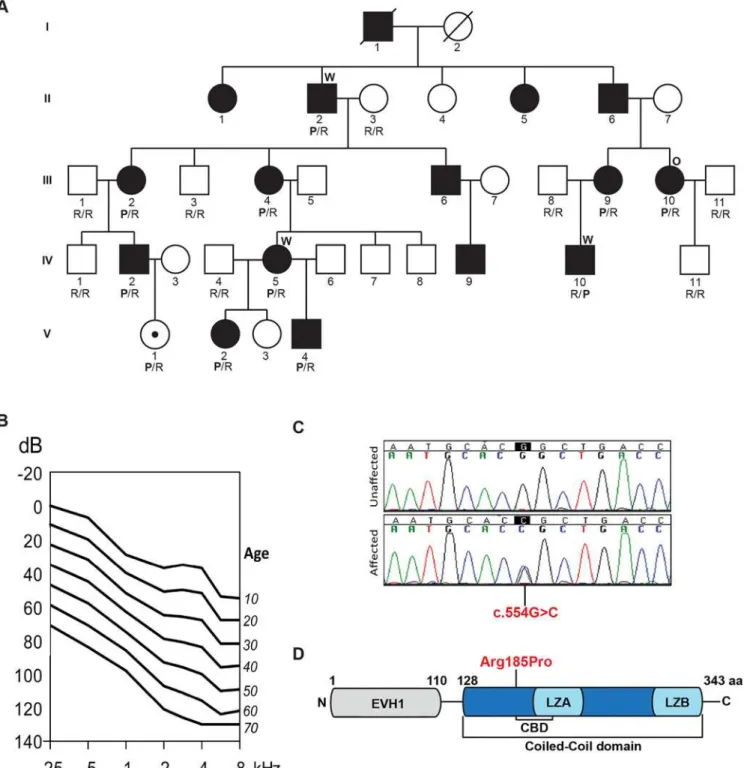
NM_004839) is a multi-generational kindred of European descent (Fig 1A). Pure tone audio-metric evaluation of affected members showed bilateral post-lingual progressive hearing loss that segregated as an autosomal dominant trait; bone conduction thresholds excluded conduc-tive hearing impairment. Clinical examination was negaconduc-tive for any findings consistent with syndromic hearing loss and also ruled out autoimmune phenotypes. Hearing impairment had a typical onset in the first decade of life in the high frequencies, with significant subsequent progression of hearing loss over all frequencies. To evaluate progression at each frequency, we performed linear regression analyses of threshold on age [20]. The resulting annual threshold deterioration (ATD) was 1.2 to 1.6 dB per year (Fig 1B,S1 Fig). The age-related typical audio-gram (ARTA) derived from these data confirmed the down-sloping audiometric configuration and demonstrated fairly similar progression across all frequencies.
Whole exome sequencing identifies a mutation in
HOMER2
Our initial strategy was to screen one family member (III.10) for pathogenic variants in known deafness-causing genes using a deafness-specific TGE+MPS panel (OtoSCOPE) [21]. Plausible pathogenic variants were excluded (S1 Table). Whole exome sequencing (WES) was therefore completed on three affected family members (II.2, IV.5, and IV.10) and variants were filtered according to guidelines detailed in Materials and Methods section [22].
The resultant final candidate variant lists included 163, 150 and 158 nucleotide changes for these three individuals, respectively (S1 Table). Of these variants, only four were shared amongst the three sequenced exomes (S2 Table) and only one segregated with the ADNSHL phenotype in the extended family (Fig 1A and 1C). The segregating variant, c.554G>C; p.
Arg185Pro inHOMER2on chromosome 15q25.2, is a novel non-synonymous change that
substitutes a highly conserved arginine for a proline, a substitution that is predicted to be path-ogenic and disease-causing by Polyphen2, LRT, SIFT and MutationTaster (S3 Table).
HOMER2 belongs to the homer family of post-synaptic density scaffolding proteins and is expressed as two isoforms, HOMER2 isoform 1 (NM_004839, 343 aa) and isoform 2
(NM_199330.2, 354 aa), which differ by 11 amino acids. The p.Arg185Pro variant lies in the CC domain (Fig 1D). A lysine is found at the orthologous position in HOMER1 and HOMER3, which like arginine is a basic polar amino acid that confers similar chemico-physical properties to the protein. Proline, in contrast, is non-polar and is predicted to alter the conformational structure of the CC domain or affect its ability to multimerize and/or interact with partner proteins.
Homer2 localizes to stereocilia of hair cells in the murine cochlea
Fig 1. Pedigree, clinical data, HOMER2 mutation and protein structure. (A)The pedigree of a five-generation family segregating progressive ADNSHL. DNA samples were obtained for 9 unaffected and 10 affected individuals. The partially filled symbol represents a two-year-old female who carries the
HOMER2mutation but in whom a formal ABR has not been performed. Individuals who underwent TGE+MPS using either the deafness panel (OtoSCOPE)
or WES are marked with an O or W, respectively. Genotypes of participating family members are shown below each symbol in single letter amino acid nomenclature: P for Proline and R for Arginine. (B)Age-related typical audiograms (ARTA). Binaural mean air conduction thresholds (dB HL) are presented for the ages 10–70 years. Hearing levels ranged from 0 to 120 dB depending on age and frequency; the annual threshold deterioration (ATD) was 1.2–1.6
dB/year at all frequencies. (C)Representative chromatograms from wild-type and mutant sequences. (D)Diagram of HOMER2 structure; the amino acid numbering indicates the beginning and end of the EVH1 and CC domains. The CC includes the CDC42 binding domain (CBD), Leucine Zipper-A (LZA) and Leucine Zipper-B (LZB). The position of the p.Arg185Pro mutation is shown in red.
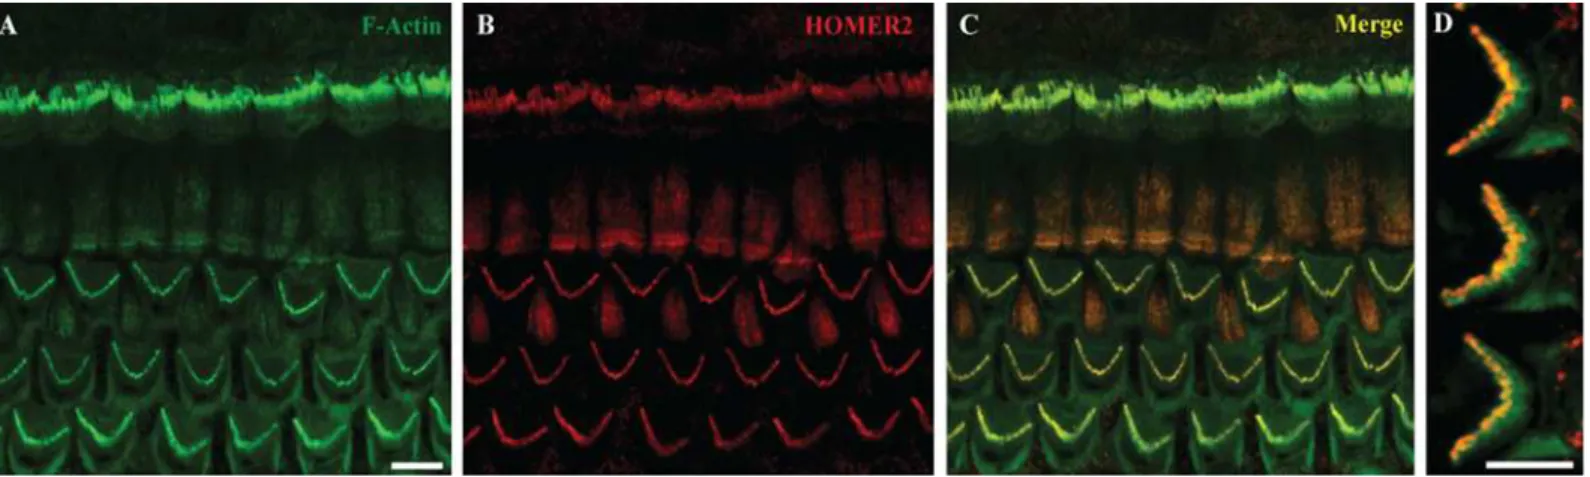
IHCs and OHCs (Fig 2), consistent with data by Hertzano and colleagues using cell sorting and RNASeq to identify Homer2 enrichment in the sensory cells of P0–P1 mice [24]. This expres-sion pattern suggests a role for HOMER2 in hair bundle function, formation, development or maintenance.
The p.Arg185Pro mutation does not affect subcellular localization in
mammalian cells
To evaluate whether the p.Arg185Pro mutation affects subcellular localization, we transfected HEK293T and COS7 cells with cMYC-tagged HOMER2WTproteins or FLAG-tagged
HOMER2p.Arg185Pro. Both wild-type (WT) and mutant proteins distributed in a diffuse manner in the cytoplasm with no obvious differences in localization patterns (S2 Fig). A similar pattern of distribution was observed when both WT and mutant constructs were cotransfected. These data indicate that the p.Arg185Pro mutation does not alter subcellular localization of HOMER2.
Overexpression of mutant HOMER2 in zebrafish embryos causes inner
ear and neuromast defects
To assess the impact of the p.Arg185Pro mutation in HOMER2in vivowe used the zebrafish
model. Zebrafish hair cells share similarities with their mammalian counterparts in morpholo-gy and function. They reside inside the otic vesicles and in the neuromasts of the lateral line system, a sensory system on the surface of fish important for sensing propulsion through water, capturing prey, or avoiding predators and obstacles. The zebrafishhomer2
(NP_001018470.1) is 67% identical to human HOMER2 and is expressed mostly in the devel-oping musculature although there is faint expression in the otic capsule at 24 hours post-fertili-zation (hpf) [25]. We used morpholino antisense oligonucleotides (S4 Table) to induce altered splicing and protein truncation. Although knockdown ofhomer2altered neither ear size nor
morphology (p>0.5) (S3 Fig), injection ofin vitrosynthesized mRNA encoding HOMER2
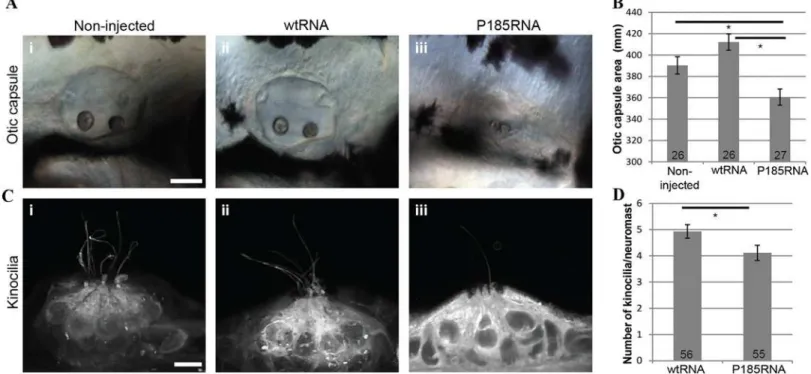
P185-mutant RNA (P185RNA) resulted in significantly smaller ear size in larvae as compared to injections with WT HOMER2 (wtRNA) (p<0.001) (Fig 3A i-iii and 3B;S4 Fig). In addition,
the number of kinocilia detected per neuromast was decreased (p = 0.03) (Fig 3C i-iii and 3D). We also noted that P185RNA-injected embryos exhibited shorter kinocilia, an observation that needs to be confirmed with more detailed methods. These results show that HOMER2 plays an
Fig 2. Homer2 expression in P2 mouse inner ear. (A) Staining with F-actin shows three rows of OHCs and one row of IHCs in the cochlea. (B) Homer2 staining in the OHCs and IHCs shows localization to stereocilia. (C) Merged pictures showing co-localization of Homer2 with F-actin in HC stereocilia. (D) Zoomed view of OHCs shows pronounced localization of Homer2 to the tips of stereocilia. Scale bar represents 10μm.
essential role in the normal development and/or maintenance of hair cells in the zebrafish inner ear and that the p.Arg185Pro mutation has a dominant-negative effect on this process.
Dominant-negative activity has been previously validatedin vivofor another homer protein,
HOMER1. Its long isoforms, HOMER1b and 1c, are constitutively expressed while the short isoform, HOMER1a is an immediate early gene product that is rapidly and transiently induced by high synaptic activity [26]. Because HOMER1a lacks the CC domain, it cannot form multi-mers but it can still competitively bind the target proteins of HOMER1b and 1c, suggesting that relative expression of each of these homer proteins is critical [27–29]. The importance of this dynamic balance has been validated by the observation that overexpression of Homer1a in a mouse impedes normal development and through a dominant-negative effect leads to signifi-cant defects in motor coordination and learning, with increased levels of fear-associated behav-ior and anxiety [30].
Homer2
-/-mice exhibit early onset progressive hearing loss
The role of Homer2 has been thoroughly studied in the murine brain and pancreas where it functions to decrease the intensity of Ca2+signaling by reducing signaling by G protein-coupled receptors (GPCRs) [31]. Mice homozygous for the targeted deletion of homer2 (Homer2-/-mice
generated by deletion of exon 3 [32]) show extensive behavioral and neurochemical similarities to cocaine or alcohol-sensitized animals, and demonstrate Homer2 involvement in appetitive pathways underlying responses to those drugs and their induced behavioral/cellular neuroplas-ticity within the nucleus accumbens [33,34]. Studies inHomer2-/-Homer3-/-mice show
upregu-lation of cytokine expression and an increase in effector-memory T cells leading to an
Fig 3. Over-expression of wtRNA and P185RNA in zebrafish embryos. (A)Otic capsule morphology in non-injected (i, n = 26), wtRNA-injected (ii, n = 26) and P185RNA-injected (iii, n = 27) embryos at 72 hpf. Scale bar represents 50μm. Embryos are mounted anterior to the left. (B)Comparison of otic capsule
morphology between WT and mutant RNA injected zebrafish shows reduced inner ear size in mutant RNA injected larvae (p<0.001).(C)Hair cell kinocilia in P185RNA-injected larvae (iii) show fewer kinocilia as compared to non-injected (i) and wtRNA-injected larvae (ii). Scale bar represents 5μm.(D)Kinocilia count per neuromast comparison between wtRNA-injected (n = 56) and P185RNA-injected (n = 55). All data are presented as the mean±SEM and are derived from at least triplicates (*P<0.05 as compared with controls considered significant).
autoimmune-like pathology, indicating that Homer2 negatively regulates T cell activation [35]. To evaluate cochlear function ofHomer2-/-mice, we measured auditory brainstem responses
(ABR), an electrophysiological hearing test that reflects the activity of afferent auditory neurons downstream of IHCs. We examined hearing in 2-, 4- and 8-week-oldHomer2-/-,Homer2+/-and
WTHomer2+/+mice and observed no differences between age-matched WT andHomer2+/-
ani-mals (P>0.2), howeverHomer2-/-mice showed progressive hearing loss (Fig 4). At P14
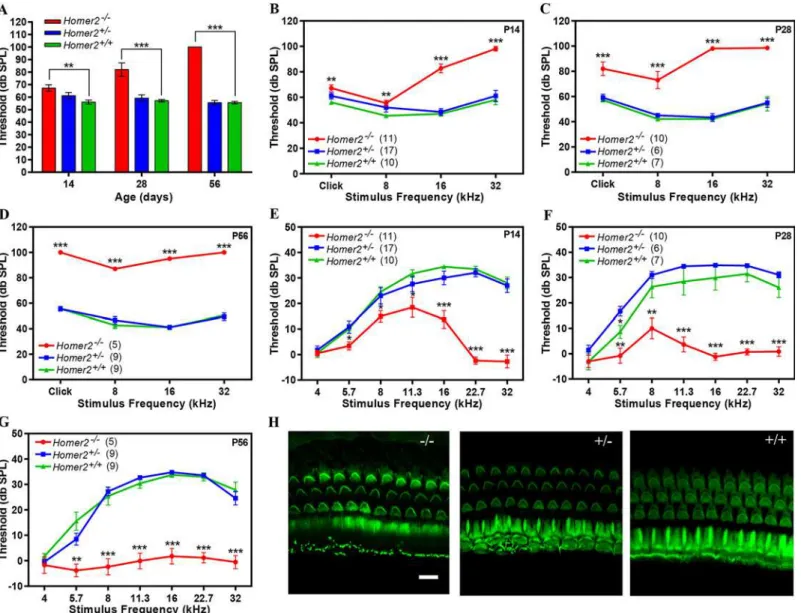
Fig 4.Homer2-/-mice have early onset progressive hearing loss. (A-D)Auditory brainstem responses (ABR) to broad band clicks (A) and tone bursts (B-D) at 8, 16, and 32 kHz in P14, P28 and P56Homer2-/-,Homer2+/-and WT mice.(A)Raised mean ABR thresholds (dB SPL) were detected as early as P14 inHomer2
-/-mice and continued to increase with age.(B)At P14Homer2
-/-mice had severe-to-profound hearing loss at high frequencies (16 kHz and 32 kHz) whereas hearing thresholds in their WT andHomer2
+/-littermates were in the normal range.(C)At P28Homer2
-/-mice had hearing loss in the lower frequencies.(D)P56Homer2-/-mice had profound hearing loss across all tested frequencies (click, 8 kHz, 16 kHz and 32 kHz).(E-G)DPOAE levels.(E)In P14Homer2-/-mice, DPOAE amplitudes are significantly lower in the high frequencies (16, 22.6, and 32.0 kHz) as compared to their WT andHomer2
+/-littermates.(F)In P28Homer2
-/-mice, DPOAE amplitudes are lower in nearly all frequencies (5.7, 8, 11.3, 16, 22.6, and 32.0 kHz).(G)In P56Homer2
-/-mice, DPOAEs deteriorate across all frequencies consistent with profound hearing loss.(H)Representative Alexa-Fluor-488-phalloidin immunofluorescence shows no obvious hair cell death in cochleae in P56Homer2-/-(n = 5),Homer2+/-(n = 4) and WT (n = 3) mice. Mean ABR thresholds and DPOAE amplitudes:
Homer2
-/-mice are shown in red;Homer2
+/-in blue; and WT mice +/-in green. The number of ears tested is shown +/-in parentheses. P-values were calculated with One-way ANOVA and post-hoc T-test analysis. Asterisks indicate statistical significance:*P<0.05,**P<0.005,***P<0.0005. Error bars represent SEM. Scale bar represents 10μm.
Homer2-/-mice had slightly elevated broad band click ABR thresholds as compared to
Homer2+/-mice [Homer2-/-(n = 11); 67.3±2.56 verseHomer2+/-(n = 17); 61.20±2.50 db SPL].
This difference progressively increased ([P28Homer2-/-(n = 10); 82.0±5.40 db SPL vs
Homer2+/-(n = 6); 59.20±2.71 db SPL]; [P56Homer2-/-(n = 5); 100.0±0.0 db SPL vsHomer2
+/-(n = 9); 55.6±1.76 db SPL]) (Fig 4A). Tone bursts showed that P14Homer2-/-mice had
pro-found deafness at 32 kHz and that the rate of hearing deterioration at 8 kHz was dramatic (P14, 55.5±2.28 dbSPL; P28, 73.0±6.84; P56, 87.0±1.22 dbSPL) (Fig 4B-4D). We assessed OHC func-tion using distorfunc-tion product otoacoustic emissions (DPOAEs) and observed no significant dif-ferences in DPOAE thresholds betweenHomer2+/-and WT mice (P>0.05). InHomer2-/-mice,
significant decreases in mid- to high-frequency DPOAE levels were seen at P14 and P28 that culminated in profound deafness at all frequencies by P56 (Fig 4E-4G).
To determine whether the auditory deficit inHomer2-/-mice was secondary to hair cell loss
we analyzed whole mount preparations of the organ of Corti at P56. No differences in IHCs and OHCs were observed in any animals regardless of genotype indicating the absence of Homer2 does not impair hair cell formation and development, and that the hearing loss in
Homer2-/-mice is not due to hair cell death (Fig 4H). Whether the hearing deficit in these mice
is due to abnormal hair bundle morphology remains to be elucidated. We additionally investi-gated spiral ganglion morphology and found no obvious indication of spiral ganglion degener-ation inHomer2-/-mice as compared to their WT littermates (S5 Fig).
p.Arg185Pro mutation exerts its effect through a dominant-negative
mechanism
In aggregate, our data show that HOMER2 is required for normal hearing. Its complete ab-sence in mice leads to early onset progressive hearing loss starting at the high frequencies and rapidly involving all frequencies. The recessive phenotype exhibited by null alleles of Homer2 makes it a strong candidate for autosomal recessive hearing loss due to loss of function in hu-mans as well. The absence of a disease phenotype inHomer2+/-mice suggests that
haploinsuffi-ciency does not cause hearing loss. Together with results obtained from zebrafish experiments, these data strongly suggest that the p.Arg185Pro mutation in HOMER2 exerts its effect through a dominant-negative mechanism on wild-type protein by either inhibiting multimeri-zation or competing for other partner proteins.
In defining the effect of the p.Arg185Pro mutation in HOMER2 at a molecular level, we be-lieve two hypotheses warrant consideration. One hypothesis posits that HOMER2 exerts its function by regulating actin dynamics in stereocilia through its interaction with CDC42, a highly conserved small GTPase of the RHO family that fine-tunes actin-turnover (S6 Fig). HOMER2 is known to couple with and regulate CDC42 through its CDC42-binding domain (CBD) within the CC domain (Fig 1D) [10]. In HeLa cells, CDC42 induces the formation of filopodia-like protrusions, while overexpression of HOMER2 suppresses this phenotype [36]. In the cochlea, CDC42 localizes to stereocilia membranes and its targeted deletion in murine HCs leads to their degeneration and results in progressive hearing loss particularly at the high frequencies, a phenotype similar to the humanHOMER2mutant phenotype and theHomer2
-/-murine phenotype [36].
A second hypothesis focuses on the role of HOMER2 in cytoplasmic Ca2+control. Several studies have shown that HOMER2 regulates a number of Ca2+handling proteins including TRPC and PMCA channels. Two TRPCs—TRPC3 (MIM 602345) and TRPC6 (MIM 603652)—
interacting partners for HOMER2, to date only an interaction with TRPC1 (MIM 602343) has been established [13]. However, a recent study has demonstrated a critical role for Homer2 in modulating PMCA activity by regulating the duration of the Ca2+signaling in parotid acinar cells [38]. This finding suggests a possible role for Homer2 in cytosolic Ca2+clearance to balance TRPC-mediated Ca2+influx and PMCA-mediated Ca2+extrusion. A suitable interacting partner of HOMER2 may be the PMCA2 pump (MIM 108733), which represents the only system for clearance of Ca2+from hair cell stereocilia [39]. While both of these hypotheses are attractive, further functional studies are needed to identify the partner proteins of HOMER2 in inner ear and investigate the effect of the p.Arg185Pro mutation on these interactions.
In summary, we have identifiedHOMER2as essential to normal auditory function and
have shown that the p.Arg185Pro HOMER2 mutation causes ADNSHL through a dominant-negative mechanism of action, thus expanding the phenotypic spectrum associated with Homer protein dysfunction.
Materials and Methods
Subjects and ethics statement
A five-generation family of European descent segregating bilateral post-lingual progressive ADNSHL was ascertained for this study (Fig 1A). After obtaining written informed consent from all participants with approval by the Institutional Review Board of the University of Iowa, clinical examination of the subjects was completed to exclude any additional and/or syndromic findings. Blood samples were obtained from 19 family members.
Audiograms and data analysis
Pure tone audiometry was performed according to current standards to determine air conduc-tion thresholds at 0.25, 0.5, 1, 2, 3, 4, 6 and 8 kHz. Bone conducconduc-tion thresholds were deter-mined at 0.5, 1, 2 and 4 kHz in some patient to exclude conductive hearing impairment. After validating binaural symmetry, the binaural mean air conduction threshold (dB Hearing Level, HL) at each frequency was used for further analyses. An arbitrary value of 130 dB HL was used to indicate out-of-scale measurements. Linear regression analyses of threshold on age were used to evaluate progression of hearing impairment at individual frequencies. These analyses comprised both individual longitudinal data derived from serial audiograms and overall cross-sectional last-visit data. Progression was considered significant if the 95% confidence interval for slope did not include zero for two or more frequencies. Progression was expressed in dB-per-year and designated Annual Threshold Deterioration (ATD). Cross-sectional regression data conformed to individual longitudinal regression data. Regression data from the last-visit thresholds were used to derive Age-Related Typical Audiograms (ARTA), which show ex-pected thresholds by decade steps in age [20].
Targeted genomic capture and whole exome sequencing
and variant calling, and ANNOVAR and a custom workflow for variant annotation. Variant filtering was based on: quality (>10X); minor allele frequency (MAF<0.0005) as reported in
the 1000 Genomes Project database and the National Heart, Lung, and Blood Institute
(NHLBI) Exome Sequencing Project Exome Variant Server (EVS). Variants were annotated for conservation (GERP and PhyloP) and predicted pathogenicity (PolyPhen2, SIFT, MutationTa-ster and LRT). Variants were then filtered based on coding effect (non-synonymous, indels and splice-site variants); heterozygosity and allele sharing amongst the three sequenced affected in-dividuals (II.2, IV.5, and IV.10). Sanger sequencing was completed in all family members to confirm segregation of c.554G>C; p.Arg185Pro inHOMER2gene (MIM 604799; RefSeq
NM_004839) using primers HOMER2-6F: 5’-ATGGGAGAGGCAGCAAGTCT-3’and HOMER2-6R: 5’-AGACCCACCTGCCAGCTTAC-3’.
Immunostaining
Cochleae from Balb/c mice were harvested at P2, locally perfused, fixed in 4% paraformalde-hyde for 30min, and rinsed in PBS. Tissues were microdissected into cochlear and saccule sub-sets and stored at 4°C in preparation for immunohistochemistry. Following infiltration using 0.3% Triton X-100 and blocking with 5% normal goat serum, we incubated the tissues in rabbit HOMER2 polyclonal primary antibody (NB100-98712, Novus Biologicals, Littleton, CO) dilut-ed 1:1000 in PBS overnight at 4°C. Specificity of HOMER2 antibody was confirmdilut-ed by staining whole mount cochlea fromHomer2-/-mice (S7 Fig). Subsequently, a secondary antibody
Alexa-Fluor 568 Goat anti-rabbit (Life Technologies, Carlsbad, CA, USA; 1:1000) was applied for 1h. Alexa-Fluor 488 phalloidin (Life Technologies, Carlsbad, CA, USA; 1:500) was added for 15min to selectively visualize F-actin. We used anti-neurofilament 200 monoclonal primary antibody (N0142, Sigma-Aldrich, Saint Louis, MO) and Alexa-Fluor 488 Goat anti-mouse as a secondary antibody to visualize spiral ganglions neurons. Whole-mount tissues were mounted in ProLong Gold Antifade Reagent (Life Technologies, Carlsbad, CA, USA). Confocal images were collected using Leica TCS SP5 confocal microscope (Leica Microsystems Inc., Bannock-burn, IL, USA) and analyzed in LSM 5 Image Browser and Adobe Photoshop.
Transfected HEK293T and COS7 cells were fixed in 4% paraformaldehyde in 0.1 M PBS (pH 7.4); cells were permeabilized with 0.1% Trition-X100. Fixed cells were incubated with pri-mary antibody at room temperature in PBS for 1.5hrs. The following pripri-mary antibodies were used: monoclonal Anti-FLAG (Sigma-Aldrich, St. Louis, MO, USA; 1:400) and Anti-cMYC (Sigma-Aldrich, St. Louis, MO, USA; 1:400). Secondary antibody incubation was for 1hr at room temperature. Secondary antibodies used: Alexa-Fluor-488 goat anti-mouse (Invitrogen, Grand Island, NY, USA; 1:500) to stain FLAG-tagged HOMER2p.Arg185Proand Alexa-Fluor-568 goat anti-rabbit (Invitrogen, Grand Island, NY, USA; 1:500) to stain cMYC-tagged HOMER2WT. F-actin was immuno-stained with Alexa-Fluor-647-phalloidin (Invitrogen, Grand Island, NY, USA;1:500). Cells were mounted in SlowFade Gold Antifade Reagent with DAPI (Life Technologies, Grand Island, NY, USA). Images were taken using a Zeiss LSM 510 with ZEN 2009 confocal microscope (Zeiss, Pleasanton, CA, USA).
Plasmid constructs
expression vectors pCMV-Tag3 (cMYC-tagged) and pCMV-Tag2 (FLAG-tagged), respectively (Agilent technologies, Santa Clara, CA, USA). All constructs were verified by sequence analysis.
Cell culture
HEK293T cells and COS7 cells (ATCC, Manassas, VA, USA) were grown in Dulbecco's Modi-fied Eagle's Medium (DMEM) supplemented with 10% FBS (Life Technologies, Carlsbad, CA, USA). Cells were incubated in a 5% CO2-humidified incubator at 37°C. Cells were grown on Poly-L-Lysine Coated coverslips (Corning, Tewksbury, MA, USA). Clonal cells were obtained by transfection with Transit-LT Transfection Reagent (Mirus Bio, Madison, WI USA) using cMYC-tagged HOMER2WTand FLAG-tagged HOMER2p.Arg185Proplasmid constructs accord-ing to the manufacturer’s instructions.
Morpholino knockdown and
in vivo
overexpression of mutant HOMER2
Zebrafish embryos were raised at 28.5°C as described [41]. All animal procedures were ap-proved by the University of Iowa Office of Animal Resources (OAR) principle for the care and use of laboratory animals and the Institutional Animal Care and Use Committee (IACUC). Antisense morpholino oligonucleotides (MOs) were designed to block the exon/intron splice junctions between exon 1 and intron 1 (MO i1e1 50- GGTACACATGTATCTGTCTGACCTT-30) or intron 3 and exon 4 (50-CGCAATGAAAACTGTAAACACTCTT-30) ofhomer2
(ENSDART00000124088) and bought from Gene Tools (Philomath, OR, USA). They were in-jected at 2.2 mg/ml along with 1 mg/ml p53 MO (5’ -GCGCCATTGCTTTGCAAGAATTG-3’). A standard control MO (5’-CCTCTTACCTCAGTTACAATTTATA-3’) was used for in-jection of negative controls along with p53 MO. The efficacy ofhomer2knockdown by each
morpholino was assessed by RT-PCR analysis with the following primer sets: forward (5’ -GGTTCCCGCCAGTAAACAG-3’) and reverse (5’-GTTTGAGCTCCGTCTTCAGG-3’), which amplified the region between exons 1 and 12; B-actin primers were forward (50 -GAGATGATGCCCCTCGTG-3') and reverse 5'-GCTCAATGGGGTATTTGAGG-3'). MO i1e1 morpholino was used for all subsequent experiments. For in vivomRNA synthesis,
HOMER2WTand HOMER2p.Arg185Proplasmids were transferred into the expression vector pCS2+ with Gateway LR Clonase according to the manufacturer’s instructions (Life Technolo-gies, Carlsbad, CA, USA). This cDNA was used as a template for HOMER2 capped mRNA synthesis using an Ambion mMESSAGE mMACHINE SP6 kit (Applied Biosystems, Foster City, CA, USA), and the product was tested for quality and yield by electrophoresis and spec-troscopy (NanoDrop Thermo Scientific, Waltham, MA, USA) before injection. Microinjection was performed at the one- to two-cell stage using a microinjection system consisting of a SZX9 stereomicroscope (Olympus, Tokyo, Japan) and an IM300 Microinjector (Narishige, Tokyo, Japan). Overexpression of injected mRNA was assessed by quantitative PCR with the following primer sets: forward (5’-GACCCCAACACCAAGAAGAA-3’) and reverse
(5’CACTGTGTTGGCTCTGCTGT-3’). Primers for B-actin were forward (5’ -CGCGCAGGA-GATGGGAACC-3’) and reverse (5’-CAACGGAAACGCTCATTGC-3’).
Zebrafish hair cell staining
At 72 hours post fertilization (hpf), live larvae were submerged in 3μM FM1-43 FX
Analysis of phenotypes in embryos and larvae
We focused on neuromasts that reside around the surface of the otic vesicle: o1, ml1, ml2, o2 and io4. Z-stacks were prepared using the max intensity z-projection function in ImageJ (NIH, Stapleton, New York City, USA). The morphous and structure of otic vesicles was observed in live larvae at 72hpf with a Leica MZFIII3 light microscope after anesthetizing with Tricaine. Images were analyzed with ImageJ (NIH).
ABRs and DPOAEs
Mouse studies were carried out in accordance with University of Iowa Office of Animal Re-sources (OAR) principle for the care and use of laboratory animals and the Institutional Ani-mal Care and Use Committee (IACUC). Mice were culled using methods approved by the American Veterinary Medical Association (AVMA) Guidelines for the Euthanasia of Animals.
The knockoutHomer2-/-mice were donated by Paul F. Worley at John Hopkins University
(Baltimore, Maryland, USA). These mice have a neomycin cassette inserted into exon 3 of
Homer2abolishing gene expression [31]. TheHomer2-/-colony was maintained on a C57BL/
6J background. Mice were genotyped by PCR, as previously described (S8 FigandS4 Table) [31]. Hearing thresholds were measured by click and tone burst (8, 16, and 32 kHz) ABR and DPOAE inHomer2-/-,Homer2+/-and WT mice at two (P14), four (P28) and eight (P56) weeks.
At least 23 animals were tested at each time point. Mice were anesthetized using intraperitoneal Ketamine/Xylazine at 0.1ml/10g body weight. Reference, ground and earth electrodes were placed subcutaneously just posterior to the tested ear (left ear), anterior to the contralateral ear and at the vertex of the head, respectively. ABRs were performed using an experimental setup and testing protocol, as described [42]. Briefly, clicks and tone-bursts were delivered to the test-ing ear through a plastic acoustic tube. ABRs were measured ustest-ing an Etymotic Research ER10B+ probe microphone (Etymotic Research, Elk Grove, IL, USA) coupled to two Tucker-Davis Technologies MF1 multi-field magnetic speakers (Tucker-Tucker-Davis Technologies, Alachua, FL, USA). Click and tone-burst stimuli were presented and recorded using custom software running on a PC connected to a 24-bit external sound card (Motu UltraLite mk3, Cambridge MA, USA). A custom-built differential amplifier with a gain of 1,000 dB amplified acoustic ABR responses. Output was passed through 6-pole Butterworth high-pass (100 Hz) and low-pass (3 kHz) filters and then to a 16-bit analog-to-digital converter (100,000 sample/s). Re-sponses were recorded using standard signal-averaging techniques for 500 or 1000 sweeps. Hearing thresholds (db SPL) were determined by decreasing the sound intensity by 5 and/or 10 db decrements and recording the lowest sound intensity level resulting in a recognizable and reproducible ABR response wave pattern. Maximum ABR thresholds were capped at 100 db SPL. DPOAEs were measured unilaterally (left ear) using an experimental setup and testing protocol, as described [42]. In brief, DPOAE levels were elicited using two primary tone stimuli, f1 and f2, with sound pressure levels of 65 and 55 db SPL, respectively, with f2/ f1 = 1.22. A custom plastic ear probe was inserted into the ear canal and DPOAE amplitudes were measured at f2 frequencies at 4000, 5657, 8000, 11314, 16000, 22627 and 32000 Hz and plotted after subtraction of noise floor amplitude.
Ingenuity pathway analysis (IPA)
computes a score for each network according to the fit of all significant genes. A detailed de-scription is given in the online repository (http://www.ingenuity.com).
Statistical analysis
All results are displayed as mean ± standard error of the mean (mean ± SEM). Statistical analy-ses were performed using one-way ANOVA (Zebrafish data) or one-way ANOVA with post hoc T-test analysis using GraphPad Prism 6 (La Jolla, CA, USA) for ABR and DPOAE data.
P-values<0.05 were assigned as significant.
Web resources
The URLs for data presented herein are as follows: 1000 Genomes;http://www.1000genomes.org
Hereditary Hearing Loss Homepage,http://hereditaryhearingloss.org MutationTaster,http://www.mutationtaster.org
NHLBI Exome Sequencing Project Exome Variant Server;http://evs.gs.washington.edu/ EVS/
Online Mendelian Inheritance in Man (OMIM),http://www.omim.org/ PolyPhen-2,http://genetics.bwh.harvard.edu/pph2/
RefSeq,http://www.ncbi.nlm.nih.gov/RefSeq SIFT,http://sift.jcvi.org/
Supporting Information
S1 Fig. Audiological features. (A)Longitudinal binaural mean air conduction threshold data of affected family members. Age (years) is shown in symbol key. The panels are ordered (top left to bottom right) by age at last visit.(B)Cross-sectional linear regression analysis of binau-ral mean air conduction threshold on age (years) for each frequency separately. The regression line (dashed) is included for each frequency. Annual threshold deterioration (ATD, in bold print), that is the regression coefficient (dB/year), is included in each panel; asterisk indicates significant progression.
(TIF)
S2 Fig. The p.Arg185Pro substitution does not alter subcellular localization of HOMER2. (A-D)Confocal microscopy images show expression of HOMER2 throughout the cytoplasm and co-localization of cMYC-tagged HOMER2WTand FLAG-tagged HOMER2p.Arg185Pro pro-teins expressed in HEK293T and COS7 cells.(A)Confocal images of cMYC-tagged
HOMER2WT-transfected HEK293 cells immuno-stained with Alexa-Fluor-568 (red); F-actin immuno-stained with conjugated Alexa-Fluor-647-phalloidin (blue).(B)Confocal images of FLAG-tagged HOMER2p.Arg185Pro-transfected HEK293 cells immuno-stained with Alexa-Fluor-488 (green); F-actin immuno-stained with conjugated Alexa-Fluor-647-phalloidin (blue).(C)Confocal images of HEK293 cells co-transfected with cMYC-tagged HOMER2WT and FLAG-tagged HOMER2p.Arg185Proimmuno-stained with Alexa-Fluor-568 (red) and Alexa-Fluor-488 (green), respectively; cell nuclei stained with DAPI (blue).(D)Confocal im-ages of COS7 cells co-transfected with cMYC-tagged HOMER2WTand FLAG-tagged
HOMER2p.Arg185Proimmuno-stained with Alexa-Fluor-568 and Alexa-Fluor-488, respectively; cell nuclei stained with DAPI (blue). The following primary antibodies were used: monoclonal Anti-FLAG and Anti-c-MYC antibodies (Sigma-Aldrich). Scale bar represents 10μm.
S3 Fig. Knock down ofhomer2in zebrafish embryos. (A)RT-PCR demonstrating knock down ofhomer2transcript using two morpholinos: MO e1i1 and MO i3e4.(B)Representative
morphology of otic capsules in zebrafish embryos at 72 hpf either injected with a control MO or MO e1i1.(C)Otic capsule area was measured in 19 and 30 animals in the control and MO groups, respectively. There was no statistically significant difference between groups. Scale bar represents 50μm.
(TIF)
S4 Fig. Overexpression of mutant HOMER2 in zebrafish embryos.Quantitative PCR assess-ing the relative quantity of mRNA from zebrafish embryos injected with WT HOMER2 (wtRNA) or HOMER2 P185-mutant RNA (P185RNA) demonstrates overexpression of both injected mRNAs.
(TIF)
S5 Fig. Spiral ganglion morphology. (A-D)WT mice (n = 2).(E-H)Homer2-/-mice (n = 3).
(A and E)Cochlea from 3 month old mice stained with DAPI (blue).(B and F)Spiral gangli-ons were labeled with anti-neurofilament antibody NF200 (green).(C and G)Merged pictures.
(D and H)Gross morphology of the organ of corti labeled with DAPI and NF200 shows no ob-vious differences between WT andHomer2-/-mice. Scale bars inA-CandE-G: 50μm,Dand
H: 100μm.
(TIF)
S6 Fig. HOMER2 interactome in the inner ear.Top-rated network generated by Ingenuity Pathway Analysis (IPA) (Ingenuity Systemswww.ingenuity.com) using 89 known NSHL-causing genes (grey shade) and HOMER2 and CDC42 as seeds. A primary network (score 53) containing 28 of the seed proteins was generated and shows multiple interactions between mol-ecules. HOMER2 interacts directly with CDC42 and F-Actin. CDC42 interacts either directly or indirectly with many proteins involved in NSHL (grey shade). Protein-protein interactions are indicated by lines and arrows. A detailed legend for the network shapes and molecular rela-tionships is found in the IPA network (http://ingenuity.force.com/ipa/articles/Feature_ Description/Legend).
(TIF)
S7 Fig. HOMER2 antibody specificity validation. (A)Staining with F-actin shows three rows of OHCs and one row of IHCs in the cochlea.(B)Absence of Homer2 staining in the cochlea
ofHomer2-/-mice.(C)Merged pictures. Scale bar represents 10μm.
(TIF)
S8 Fig. Genotyping ofHomer2-/-,Homer2+/-andHomer2+/+mice by PCR.PCR products were resolved on 2% agarose gel. The mutant allele corresponds to a 336-bp band. The wild type allele corresponds to a 237-bp band.
(TIF)
S1 Table. WES and OtoSCOPE coverage statistics.
(DOCX)
S2 Table. Candidate variant list.
(DOCX)
S3 Table. Pathogenicity prediction for p.Arg185Pro mutation in HOMER2.
S4 Table. List of primers and their applications.
(DOCX)
Acknowledgments
We are very thankful to the family reported here for their collaboration in this study. We are grateful to Paul F. Worley for generously providing theHomer2-/-mice. We also thank Mary
Powers Evans, Nicole Meyer and Ann Black-Ziegelbein for their enthusiastic help and techni-cal assistance throughout the study.
Author Contributions
Conceived and designed the experiments: HA ARD RAC RJHS. Performed the experiments: HA ARD KTB ACS AES FB MSH PTR SBS. Analyzed the data: HA ARD KTB ACS PLMH YZ RJHS. Contributed reagents/materials/analysis tools: AT WJK. Wrote the paper: HA RJHS.
References
1. Avraham KB, Kanaan M (2012) Genomic advances for gene discovery in hereditary hearing loss. Jour-nal of basic and clinical physiology and pharmacology 23: 93–97. doi:10.1515/jbcpp-2012-0033
PMID:22962211
2. Shearer AE, Smith RJ (2012) Genetics: advances in genetic testing for deafness. Curr Opin Pediatr 24: 679–686. doi:10.1097/MOP.0b013e3283588f5ePMID:23042251
3. Stelma F, Bhutta MF (2014) Non-syndromic hereditary sensorineural hearing loss: review of the genes involved. The Journal of laryngology and otology 128: 13–21. doi:10.1017/S0022215113003265
PMID:24423691
4. Mammano F (2011) Ca2+ homeostasis defects and hereditary hearing loss. BioFactors 37: 182–188.
doi:10.1002/biof.150PMID:21698697
5. Jardin I, Lopez JJ, Berna-Erro A, Salido GM, Rosado JA (2013) Homer proteins in Ca(2)(+) entry. IUBMB life 65: 497–504. doi:10.1002/iub.1162PMID:23554128
6. Worley PF, Zeng W, Huang G, Kim JY, Shin DM, Kim MS, et al. (2007) Homer proteins in Ca2+ signal-ing by excitable and non-excitable cells. Cell calcium 42: 363–371. PMID:17618683
7. Shiraishi-Yamaguchi Y, Furuichi T (2007) The Homer family proteins. Genome biology 8: 206. PMID: 17316461
8. Kato A, Ozawa F, Saitoh Y, Fukazawa Y, Sugiyama H, Inokuchi K (1998) Novel members of the Vesl/ Homer family of PDZ proteins that bind metabotropic glutamate receptors. The Journal of biological chemistry 273: 23969–23975. PMID:9727012
9. Shiraishi Y, Mizutani A, Bito H, Fujisawa K, Narumiya S, Mikoshiba K, et al. (1999) Cupidin, an isoform of Homer/Vesl, interacts with the actin cytoskeleton and activated rho family small GTPases and is ex-pressed in developing mouse cerebellar granule cells. The Journal of neuroscience: the official journal of the Society for Neuroscience 19: 8389–8400. PMID:10493740
10. Shiraishi-Yamaguchi Y, Sato Y, Sakai R, Mizutani A, Knopfel T, Mori N, et al. (2009) Interaction of Cupi-din/Homer2 with two actin cytoskeletal regulators, Cdc42 small GTPase and Drebrin, in dendritic spines. BMC neuroscience 10: 25. doi:10.1186/1471-2202-10-25PMID:19309525
11. Hayashi MK, Ames HM, Hayashi Y (2006) Tetrameric hub structure of postsynaptic scaffolding protein homer. The Journal of neuroscience: the official journal of the Society for Neuroscience 26: 8492–8501.
PMID:16914674
12. Kammermeier PJ, Xiao B, Tu JC, Worley PF, Ikeda SR (2000) Homer proteins regulate coupling of group I metabotropic glutamate receptors to N-type calcium and M-type potassium channels. The Jour-nal of neuroscience: the official jourJour-nal of the Society for Neuroscience 20: 7238–7245. PMID:
11007880
13. Yuan JP, Kiselyov K, Shin DM, Chen J, Shcheynikov N, Kang SH, et al. (2003) Homer binds TRPC fam-ily channels and is required for gating of TRPC1 by IP3 receptors. Cell 114: 777–789. PMID:14505576
15. Salm EJ, Thayer SA (2012) Homer proteins accelerate Ca2+ clearance mediated by the plasma mem-brane Ca2+ pump in hippocampal neurons. Biochemical and biophysical research communications 424: 76–81. doi:10.1016/j.bbrc.2012.06.069PMID:22732411
16. Szumlinski KK, Kalivas PW, Worley PF (2006) Homer proteins: implications for neuropsychiatric disor-ders. Current opinion in neurobiology 16: 251–257. PMID:16704932
17. Foa L, Gasperini R (2009) Developmental roles for Homer: more than just a pretty scaffold. Journal of neurochemistry 108: 1–10. doi:10.1111/j.1471-4159.2009.05813.xPMID:19222714
18. Ronesi JA, Collins KA, Hays SA, Tsai NP, Guo W, Birnbaum SG, et al. (2012) Disrupted Homer scaf-folds mediate abnormal mGluR5 function in a mouse model of fragile X syndrome. Nature neuroscience 15: 431–440, S431. doi:10.1038/nn.3033PMID:22267161
19. Szumlinski KK, Ary AW, Lominac KD (2008) Homers regulate drug-induced neuroplasticity: implica-tions for addiction. Biochemical pharmacology 75: 112–133. PMID:17765204
20. Huygen PL, Pennings RJ, Cremers CW (2003) Characterizing and distinguishing progressive pheno-types in nonsyndromic autosomal dominant hearing impairment. Audiological Medicine 1: 37–46.
21. Shearer AE, DeLuca AP, Hildebrand MS, Taylor KR, Gurrola J 2nd, Scherer S, et al. (2010) Compre-hensive genetic testing for hereditary hearing loss using massively parallel sequencing. Proceedings of the National Academy of Sciences of the United States of America 107: 21104–21109. doi:10.1073/
pnas.1012989107PMID:21078986
22. Azaiez H, Booth KT, Bu F, Huygen P, Shibata SB, Shearer AE, et al. (2014) TBC1D24 Mutation Causes Autosomal-Dominant Nonsyndromic Hearing Loss. Human mutation 10.1002/humu.22557.
23. Shiraishi Y, Mizutani A, Yuasa S, Mikoshiba K, Furuichi T (2004) Differential expression of Homer fami-ly proteins in the developing mouse brain. The Journal of comparative neurology 473: 582–599. PMID:
15116392
24. Hertzano R, Elkon R, Kurima K, Morrisson A, Chan SL, Sallin M, et al. (2011) Cell type-specific tran-scriptome analysis reveals a major role for Zeb1 and miR-200b in mouse inner ear morphogenesis. PLoS genetics 7: e1002309. doi:10.1371/journal.pgen.1002309PMID:21980309
25. Thisse B, Thisse, C. (2004) Fast Release Clones: A High Throughput Expression Analysis ZFIN Direct Data Submission (http://zfinorg).
26. Bottai D, Guzowski JF, Schwarz MK, Kang SH, Xiao B, Lanahan A, et al. (2002) Synaptic activity-induced conversion of intronic to exonic sequence in Homer 1 immediate early gene expression. The Journal of neuroscience: the official journal of the Society for Neuroscience 22: 167–175.
27. Sala C, Roussignol G, Meldolesi J, Fagni L (2005) Key role of the postsynaptic density scaffold proteins Shank and Homer in the functional architecture of Ca2+ homeostasis at dendritic spines in hippocam-pal neurons. The Journal of neuroscience: the official journal of the Society for Neuroscience 25: 4587–4592. PMID:15872106
28. Kammermeier PJ, Worley PF (2007) Homer 1a uncouples metabotropic glutamate receptor 5 from postsynaptic effectors. Proceedings of the National Academy of Sciences of the United States of Amer-ica 104: 6055–6060. PMID:17389377
29. Kammermeier PJ (2008) Endogenous homer proteins regulate metabotropic glutamate receptor signal-ing in neurons. The Journal of neuroscience: the official journal of the Society for Neuroscience 28: 8560–8567. doi:10.1523/JNEUROSCI.1830-08.2008PMID:18716215
30. Tappe A, Kuner R (2006) Regulation of motor performance and striatal function by synaptic scaffolding proteins of the Homer1 family. Proceedings of the National Academy of Sciences of the United States of America 103: 774–779. PMID:16407107
31. Shin DM, Dehoff M, Luo X, Kang SH, Tu J, Nayak SK, et al. (2003) Homer 2 tunes G protein-coupled re-ceptors stimulus intensity by regulating RGS proteins and PLCbeta GAP activities. The Journal of cell biology 162: 293–303. PMID:12860966
32. Szumlinski KK, Toda S, Middaugh LD, Worley PF, Kalivas PW (2003) Evidence for a relationship be-tween Group 1 mGluR hypofunction and increased cocaine and ethanol sensitivity in Homer2 null mu-tant mice. Annals of the New York Academy of Sciences 1003: 468–471. PMID:14684491
33. Kalivas PW, Szumlinski KK, Worley P (2004) Homer2 gene deletion in mice produces a phenotype sim-ilar to chronic cocaine treated rats. Neurotoxicity research 6: 385–387. PMID:15545022
34. Cozzoli DK, Goulding SP, Zhang PW, Xiao B, Hu JH, Ary AW, et al. (2009) Binge drinking upregulates accumbens mGluR5-Homer2-PI3K signaling: functional implications for alcoholism. The Journal of neuroscience: the official journal of the Society for Neuroscience 29: 8655–8668. doi:10.1523/
JNEUROSCI.5900-08.2009PMID:19587272
35. Huang GN, Huso DL, Bouyain S, Tu J, McCorkell KA, May MJ, et al. (2008) NFAT binding and regula-tion of T cell activaregula-tion by the cytoplasmic scaffolding Homer proteins. Science 319: 476–481. doi:10.
36. Ueyama T, Sakaguchi H, Nakamura T, Goto A, Morioka S, Shimizu A, et al. (2014) Maintenance of stereocilia and apical junctional complexes by Cdc42 in cochlear hair cells. J Cell Sci 127: 2040–2052.
doi:10.1242/jcs.143602PMID:24610943
37. Quick K, Zhao J, Eijkelkamp N, Linley JE, Rugiero F, Cox JJ, et al. (2012) TRPC3 and TRPC6 are es-sential for normal mechanotransduction in subsets of sensory neurons and cochlear hair cells. Open bi-ology 2: 120068. doi:10.1098/rsob.120068PMID:22724068
38. Yang YM, Lee J, Jo H, Park S, Chang I, Muallem S, et al. (2014) Homer2 protein regulates plasma membrane Ca(2)(+)-ATPase-mediated Ca(2)(+) signaling in mouse parotid gland acinar cells. The Journal of biological chemistry 289: 24971–24979. doi:10.1074/jbc.M114.577221PMID:25049230
39. Dumont RA, Lins U, Filoteo AG, Penniston JT, Kachar B, Gillespie PG (2001) Plasma membrane Ca2+-ATPase isoform 2a is the PMCA of hair bundles. The Journal of neuroscience: the official jour-nal of the Society for Neuroscience 21: 5066–5078. PMID:11438582
40. Shearer AE, Black-Ziegelbein EA, Hildebrand MS, Eppsteiner RW, Ravi H, Joshi S, et al. (2013) Advanc-ing genetic testAdvanc-ing for deafness with genomic technology. Journal of medical genetics 50: 627–634. doi:
10.1136/jmedgenet-2013-101749PMID:23804846
41. Westerfield M (1993) The Zebrafish Book: University of Oregon Press.