Disclosing Bias in Bisulfite Assay:
MethPrimers Underestimate High DNA
Methylation
Andrea Fuso1,2*, Giampiero Ferraguti3, Sigfrido Scarpa4, Isidre Ferrer5, Marco Lucarelli3,6
1Dept. of Psychology, Sapienza University of Rome, Rome, Italy,2European Center for Brain Research (CERC)/IRCCS Santa Lucia Foundation, Rome, Italy,3Dept. of Cellular Biotechnologies and Hematology, Sapienza University of Rome, Rome, Italy,4Dept. of Surgery“P. Valdoni”, Sapienza University of Rome, Rome, Italy,5Institute of Neuropathology, IDIBELL-Bellvitge University Hospital and University of Barcelona, CIBERNED, L'Hospitalet de Llobregat, Spain,6Pasteur Institute, Cenci Bolognetti Foundation, Sapienza University of Rome, Rome, Italy
Abstract
Discordant results obtained in bisulfite assays using MethPrimers (PCR primers designed using MethPrimer software or assuming that non-CpGs cytosines are non methylated) ver-sus primers insensitive to cytosine methylation lead us to hypothesize a technical bias. We therefore used the two kinds of primers to study different experimental models and methyla-tion statuses. We demonstrated that MethPrimers negatively select hypermethylated DNA sequences in the PCR step of the bisulfite assay, resulting in CpG methylation underestima-tion and non-CpG methylaunderestima-tion masking, failing to evidence differential methylaunderestima-tion statuses. We also describe the characteristics of“Methylation-Insensitive Primers”(MIPs), having de-generated bases (G/A) to cope with the uncertain C/U conversion. As CpG and non-CpG DNA methylation patterns are largely variable depending on the species, developmental stage, tissue and cell type, a variable extent of the bias is expected. The more the methy-lome is methylated, the greater is the extent of the bias, with a prevalent effect of non-CpG methylation. These findings suggest a revision of several DNA methylation patterns so far documented and also point out the necessity of applying unbiased analyses to the increas-ing number of epigenomic studies.
Introduction
It is generally accepted that DNA methylation almost exclusively occurs in CpG dinucleotides in mammals [1–4]. Non-CpG methylation has been documented, but with limited extent (see
Discussion) and in specific cell types—mainly stem cells. Using the bisulfite modification fol-lowed by PCR amplification, cloning and sequencing, we previously reported unexpectedly high non-CpG methylation inmyogeninmouse promoter [5]. Moreover, in humanPSEN1 promoter, we observed discordant methylation patterns when using PCR primers designed using the MethPrimer software [6] (assuming that non-CpG cytosines are modified by OPEN ACCESS
Citation:Fuso A, Ferraguti G, Scarpa S, Ferrer I, Lucarelli M (2015) Disclosing Bias in Bisulfite Assay: MethPrimers Underestimate High DNA Methylation. PLoS ONE 10(2): e0118318. doi:10.1371/journal. pone.0118318
Academic Editor:Lorenzo Chiariotti, Università di Napoli Federico II, ITALY
Received:August 12, 2014
Accepted:January 14, 2015
Published:February 18, 2015
Copyright:© 2015 Fuso et al. This is an open access article distributed under the terms of the
Creative Commons Attribution License, which permits
unrestricted use, distribution, and reproduction in any medium, provided the original author and source are credited.
Data Availability Statement:All relevant data are within the paper and its Supporting Information files.
Funding:This research is supported by funding from: European Community 7th Framework program (FP7/2007-2013) grant n° 278486“DEVELAGE”to AF and SS; Sapienza Università di Roma, Scientific Research Programs 2012 and 2013 to ML. The funders had no role in study design, data collection and analysis, decision to publish, or preparation of the manuscript.
bisulfite; defined as“MethPrimers”from now on) or primers designed to be insensitive to cyto-sine-methylation status. When the bisulfite technique has been originally described [7,8], it was recommended not to include cytosines in the recognition sequence of the primers to avoid possible mismatches depending on methylation status. Interestingly, the same authors were able to evidence some non-CpG methylation in the first applications of the technique [9]. However, in the following years, MethPrimers became the most (if not exclusively) used prim-ers in bisulfite-based applications, due to the advantage of the software-assisted primer design and to the general assumption that non-CpG cytosines were mainly unmethylated. Although the lack of a specific name makes it difficult to retrieve in PubMed the number of papers in which they are used, looking at the citations of the original article describing the MethPrimer software [6], it is possible to infer at least one thousand citations. Furthermore, an on line search through Google Scholar evidences about 29300 articles in which the bisulfite approach is used; among these, about 80% reports the use of MethPrimer software or similar primer design strategy.
Despite this trend, we have always been using primers designed in regions without cytosines or, when this was not possible, primers with degenerated bases (G/A) to cope with the uncer-tain C/U conversion of the few (max. 3) cytosines residues included in the sequence of the primer [5,10]. These primers will be here defined as“methylation-insensitive primers”(MIPs). The high non-CpG methylation observed formyogeninand the discordant methylation profile observed whenPSEN1was analyzed using either MethPrimers or MIPs lead us to hypothesize that MethPrimers could negatively select non-CpG methylated DNA molecules also resulting in a biased outcome of the CpG methylation assessment.
In order to verify this hypothesis, we analyzed two genes (myogeninandPSEN1), each one in two experimental models: CD1 mouse embryos and C2C12 myoblast cells formyogeninand human brains and neuroblastoma SK-N-BE cells forPSEN1. In each model, we compared con-ditions with differential methylation profiles, as ascertained in previous studies [5,10].
Results and Discussion
Samples were bisulfite-modified and then amplified by two primer sets, MethPrimers or MIPs, recognizing the same promoter region (S1 Fig.); each sample was divided in two aliquots after bisulfite conversion for amplification with the two primer sets and then processed in parallel until the final sequencing step. Several positive and negative controls were performed to avoid any possible technical bias (seeMethodssection).
Fig. 1shows the methylation pattern of the 9 CpG sites investigated inmyogeninpromoter in C2C12 cells (Fig. 1A and 1B) and in mice tissues (Fig. 1C and 1D). Whenmyogenin methyla-tion is high as in cells grown in 10% FCS and in mouse embryonic brain, MethPrimers signifi-cantly underestimate DNA methylation levels. As a matter of fact, whereas Mann-Witney test (used to evidence differences between two samples analyzed with the same primers) results in a significant difference for all the cytosine moieties when comparing the hypermethylated (Fig. 1A and 1C) vs. hypomethylated (Fig. 1B and 1D) experimental condition using MIPs [Cells: U = 9.00,p<0.05; Tissues: U = 16.00,p<0.02], the same comparison using MethPrimers
indicates non-significant differences for 4 cytosines (1145, 1266, 1339, 1342). Moreover, Wil-coxon test (used to evidence differences when comparing MIPs vs. MethPrimers assay in the same sample) indicates that 5 cytosines result significantly hypomethylated when analyzed with MethPrimers [cytosines 1145, 1266, 1350, 1355, 1368: Z = -1.6,p<0.05] in C2C12
Fig 1. MIPs and MethPrimers result in different CpG methylation patterns.CpG methylation pattern is expressed as percent methylation for each CpG in the investigated region of the mousemyogenin(a-d) and humanPSEN1(e-h) promoters. Light grey columns show the values obtained using MIPs, dark grey columns show the values obtained using MethPrimers. Time points for cell cultures are: 48 h for C2C12 10% FCS, SK-N-BE+SAM, SK-N-BE B def.; 24 h for C2C12 1%FCS. Symbols:*p<0.05 MIPs vs. MethPrimers; &:p<0.05 High Methylated vs. Low Methylated with MIPs; §:p<0.05 High Methylated vs. Low Methylated with MethPrimers. Y axes in histograms have a different scale (up to 100% for high methylated samples, up to 50% for low methylated samples) in order to better evidence intra-sequence differences in cytosine methylation analyzed with Methprimers vs. MIPs.
therefore evident that in experimental conditions in which DNA methylation is high MethPri-mers show low power of detection compared to MIPs, eventually failing to evidence differences between differential methylation in two samples.
Very similar results were obtained when studying DNA methylation pattern ofPSEN1in SK-N-BE cells grown in hypermethylating (S-adenosylmethionine supplemented) or hypo-methylating (B vitamin deficiency) conditions [11] (Fig. 1E and F) and in frontal cortex sam-ples from control subjects and patients with Alzheimer’s disease (AD) and control subjects (Fig. 1G and H). Mann-Withney test resulted in 10 out of 24 cytosines moieties significantly hypomethylated inPSEN1promoter of low methylated (Fig. 1F) vs. high methylated (Fig. 1E) SK-N-BE cells when MIPs were used [cytosines 974, 1019, 1035, 1141, 1154, 1172, 1191, 1217, 1224, 1226: U = 9.00,p<0.05]. On the contrary, only 1 cytosine resulted significantly
hypo-methylated in the same samples when MethPrimers were used [cytosines 1075: U = 9.00; p<0.05]. This result was, also for PSEN1, more evident in tissues: all the cytosines analyzed
were significantly hypomethylated in AD brains vs. controls [U = 16.00,p<0.05] whereas only
5 cytosines resulted hypomethylated when studied using MethPrimers [cytosines 1028, 1145, 1154, 1191, 1226: U = 16.00,p<0.05]. The inter-assay variation was confirmed by Wilcoxon
test also forPSEN1; as a matter of fact, all the cytosines resulted significantly hypomethylated when the assay was performed using MethPrimers vs. MIPs [SK-N-BE cells: Z = -2.52,p<0.05;
brain: Z = -2.52,p<0.02]. Therefore, assessing methylation with MethPrimers can result in
un-derestimation of the high methylation levels eventually biasing the detection of differences. The Sanger sequencing after bisulfite modification allows detecting the methylation level of any individual cytosine in the whole amplified region, including non-CpG cytosines [7,8]. As previously observed formyogeninpromoter [5] (S2 Fig.), when sequencing PCR products am-plified using MIPs we were able at evidencing discrete non-CpG methylation also inPSEN1 promoter (S3 Fig.) at least in the conditions of high methylation [myogenin: Z = -2.91,p<0.01;
PSEN1: Z = -3.13,p<0.01]. It is worth of note that, whereas MIPs allow discriminating between
conditions with high/discrete and low/absent non-CpG methylation, MethPrimers invariably fail to evidence it (S2andS3Figs.). This observation raises two considerations: i) from the tech-nical point of view it is evident that the described underestimation of DNA methylation when MethPrimers are used is due to the inability of these primers to bind non-CpG-methylated se-quences; ii) from a perspective point of view, it can be inferred that the use of these primers has been causing general underestimation of the non-CpG methylation.
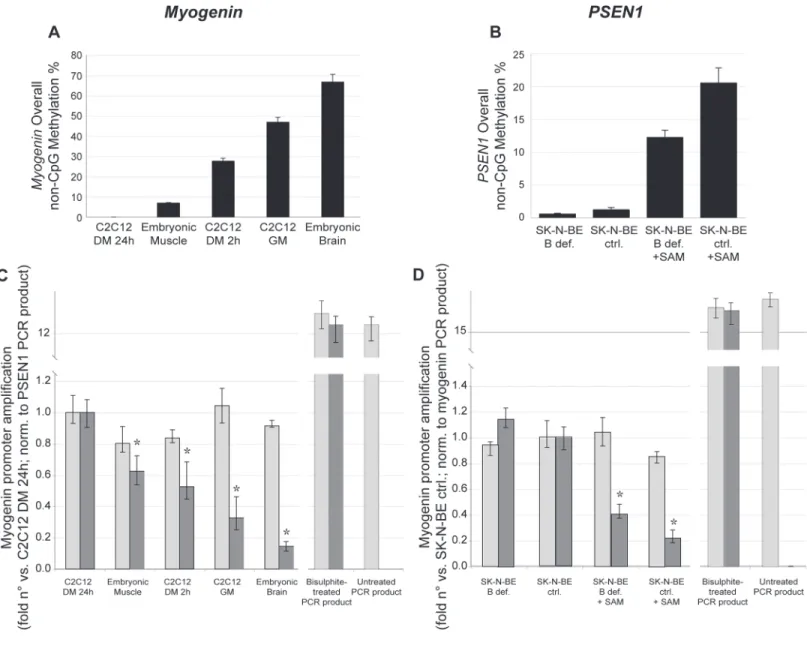
In order to confirm these observations by an independent approach, we also compared, by real-time PCR on bisulphite-modified genomic DNA, the amplification efficiency of each primer set respect to differential methylation statuses (Fig. 2).Fig. 2A and 2Bshow the overall non-CpG methylation levels measured, respectively, formyogeninandPSEN1promoter, in dif-ferent experimental conditions, ordered according to increasing methylation.Fig. 2C and 2D
demonstrate that whereasmyogeninandPSEN1MIPs correctly amplify with similar efficiency all bisulfite-modified DNA samples independently on their original non-CpG methylation sta-tus (light gray columns), MethPrimers show significant inverse correlation [myogenin: r = 0.94, p<0.001;PSEN1: r = 0.89,p<0.001] between amplification efficiency and DNA methylation
level. This result indicates that the more DNA is non-CpG methylated, the less MethPrimers are able to bind to the bisulfite-modified product indicating that these primers negatively select the high methylation (poorly modified) DNA fraction in the sample. As expected, MethPri-mers failed to amplify untreated PCR products whereas MIPs show similar amplification effi-ciency for both treated and untreated PCR fragments.
methylation-insensitive endonucleases. Endonuclease assays formyogeninwere already published [5], whereas the assay onPSEN1is shown inS4 Fig.The results also indicate that the cutting effi-ciency is impaired in DNA samples with high methylation.
These experiments show that MethPrimers, commonly used in the PCR step of several bi-sulfite-based assays for the study of DNA methylation, can give false negative results (no meth-ylation differences) due to their selective binding to the DNA fraction with lower methmeth-ylation. Fig 2. MethPrimers amplification efficiency is affected by DNA methylation.a)Myogeninand b)PSEN1overall non-CpG methylation. c) and d) Amplification efficiency of primers on samples with differential overall non-CpG methylation was assessed by Real-Time PCR assay using MIPs (light grey columns) or MethPrimers (dark grey columns) formyogenin(c) andPSEN1(d). Bisulphite-treated PCR products and untreated PCR products were used as control of amplification efficiency. Values are expressed as fold n° versus control (C2C12 in 1% 24 hours formyogenin, SK-N-BE in complete medium for
PSEN1 used as respective calibrators);myogeninamplification values were normalized usingPSEN1PCR product amplification (added to mouse samples and used as exogenous reference) whereasPSEN1amplification values were normalized tomyogeninPCR product amplification (in this case added to human samples and used as exogenous reference).*:p<0.001 vs. ctrl.
This problem particularly affects highly methylated samples whereas samples with low methyl-ation are unaffected; the use of MIPs allows bypassing this deficiency. We do not affirm that all the data so far obtained using MethPrimers are biased, but suggest being more cautious when “no differences”in methylation patterns are found. It is likely that a number of (mainly nega-tive) findings obtained with MethPrimers could benefit from a verification using MIPs. These data were obtained for two independent genes, in two different organisms, each one in two ex-perimental models; this approach appears sufficient to sustain the disclosure of the technical bias. A genome-wide confrontation between MIPs and MethPrimers appears beyond the scope of this technical report and could be probably not resolutive, since we demonstrated that the bias is evident only in conditions of high DNA methylation. However, the comparison of the epigenome as evaluated by the two kinds of primers would be a natural prosecution of the ex-periments here reported.
Finally, although the aim of this paper is not to evidence discrete non-CpG methylation in differentiated cells, we cannot ignore that our data strongly point out the idea that non-CpG methylation extent and role are probably underestimated. Indeed, recent evidences using unbi-ased techniques like Whole Genome Bisulphite Sequencing (WGBS) stress a functional role for non-CpG methylation [12–15]. Noteworthy, non-CpG methylation was demonstrated not just at genomic but at specific gene level [16–18] and particularly in brain [19,20]. We therefore suggest that unbiased approaches, not based on the use of MethPrimers, are used to further in-vestigate the role of non-CpG methylation in gene-specific and genome-wide analyses. As CpG and non-CpG DNA methylation patterns are largely variable depending on the species, devel-opmental stage, tissue and cell type, a variable extent of the bias is expected. The more the methylome is methylated, the greater is the extent of the bias, with a prevalent effect of non-CpG methylation.
DNA methylation patterns and quantitative levels of methylation are largely variable in different tissues and cell types, as well as during development and differentiation. Several ex-perimental evidences have been published on the fact that, despite similar levels of CpG meth-ylation, mouse embryonic stem cells (ESCs) have considerably higher levels of non-CpG methylation (from 15 to 20% of total cytosine methylation), depending to the ability of DNMT3a, DNMT3b and DNMT3L to catalyze and regulate it [1,14]. Even though these“first generation”studies were based on the analysis of a small fraction of the genome, they have been fully confirmed by subsequent“next generation”studies.
Genome-wide single-base-resolution maps of cytosine methylation in humans demonstrat-ed that in ESCs, as well as in inducdemonstrat-ed pluripotent stem cells (IPSCs), the 12–25% of the cytosine methylation is present in non-CpG context, is functionally linked to expression and is more prevalent in gene bodies than in protein binding sites and enhancers [15,21,22].
Several papers have demonstrated that from the 25% to the 35% of total DNA methylation in adult mouse and human brain resides in non-CpG sites, as measured by base-resolution analyses of respective methylomes [19,23–26]. These researches also demonstrated that this kind of methylation is usually established de novo during neuronal maturation, conserved and correlated with gene expression. It has also been demonstrated that a highly conserved non-CpG methylation accumulates in human neurons during fetal to young adult development, to even become, at some developmental stages, the dominant form of methylation (53%) of the human neuronal genome [25].
the bias introduced from the study of a reduced number of non-CpG and/or by the use of re-striction digestion-based approaches, such as RRBS [15] or LUMA [12].
From methodological point of view, bisulfite treatment is, at moment, an unavoidable step for studying DNA methylation at single-C level. If the subsequent experimental steps are based on strand-specific PCR performed by methylation-specific primers, the approach is potentially biased by non-CpG methylation. It depends on the primer design. Among recent approaches and analytical platforms used for genome wide methylation analysis (for a review see [28]), those based on methods of enrichment for methylated DNA able to recognize also non-CpG methylation and using bisulfite-insensitive adaptors, are expected to be unbiased. The compar-ison between data obtained by previous single-gene methods potentially biased and those ob-tained by the new unbiased approaches at methylome level, is likely to deserve amazing differences about the extent, dynamics and role of non-CpG methylation.
Materials and Methods
Media and cell cultures
Cell cultures were performed as previously described [5,10]. Briefly: murine myoblasts C2C12 and human neuroblastoma SK-N-BE cell were maintained in F14 medium with 10% FCS (Growth Medium, GM). SK-N-BE cell line was a kind gift by A. Confaloni and G. Poiana and was originally purchased from ATCC (American Type culture Collection, Rockville, MD, USA). According to the experimental plan, cells were plated in GM and, after 24 h of growth, were stopped or shifted to Differentiation Medium (DM) (time 0); the subsequent collection times in GM and DM are indicated in figure legends. SK-N-BE cells were also treated with dif-ferentiation medium deficient of folate, vitamin B12 and vitamin B6 (B deficient) or supple-mented with S-adenosylmethionine (SAM 100μM) according to the experimental design. Experiments were repeated at least three times.
Animals
CD1 mice were housed in an air-conditioned room (temperature 21±1°C, relative humidity 60±10%) with 12:12 h light:dark cycle (lights on from 8 AM to 8 PM) and food and water continuously available. Embryonic Brain and Muscle tissues were isolated from CD1 mouse embryos (Ed7); 4 pools of 2 brains or muscles were used for each experimental condition as previously described [10,11].
All the experiments were performed in such a way as to sacrifice the minimum number of animals required and were approved by author’s Institution (Sapienza University of Rome) in accordance with the European Communities Council Directive (86/609/EEC) and formally ap-proved by the Italian Ministry of Health (D.L. 92/116).
Human brain samples
following the approval of the local ethics committee according to the“Ley de la Ciencia" (Bole-tin Oficial del Estado: BOE-A-2011-9617) and the“Real Decreto de Biobancos” (BOE-A-2011-18919) for samples before the publication of the Real Decreto. All the samples obtained from this date onwards are obtained following written consent, which is kept at the archives of the HUB-ICO-IDIBELL biobank following the guidelines of the local Ethics Committee.
DNA methylation studies by bisulphite modification and genomic
sequencing
DNA was extracted from cells and tissues by classical phenol-chloroform method [5]. Bisul-phite analysis ofmyogeninandPSEN1promoter methylation was performed using the EpiTect Bisulphite kit; PCR products obtained after bisulphite treatment were cloned using the PCR Plus Cloning Kit (both from Qiagen). At least ten clones were analyzed per experimental con-dition using M13 primers for sequencing. Sequencing reactions of purified plasmid DNA were performed. Clones were sequenced by the cycle sequencing method using the ABI PRISM 3130xlgenetic analyzer (Applied Biosystems). Modified cytosine residues were recognized through comparison with the original DNA sequence and methylation status of any single cy-tosine in each sequenced clone were reported as 1/0 value in an excel spreadsheet (methylated: 1; unmethylated: 0). For each experimental sample we obtained the methylation % of each sin-gle cytosine by calculating the number of methylated cytosines divided by the number of clone sequenced per 100 ([n° methylC / n° sequenced clones] x100). Then, we calculated the average methylation % over the replicated cell culture experiments or over the 4 tissue samples for each experimental condition. Raw data related to DNA methylation results are shown inS5 Fig.
GenBank accession numbers, primer names, sequence and position, expected products and annealing temperatures of the Methylation Insensitive Primers (MIPs) used for bisulphite anal-ysis were already published [5,10]. Sequence, characteristics and position of both MIPs and MethPrimers are inS1 Fig.These primers allowed assessing methylation status of plus (5’->3’)
DNA strand.
We also used different bisulphite modification assays as random control in samples charac-terized by low and high (CpG and non-CpG) methylation to ensure that cytosine conversion was complete. In particular, standard bisulphite procedures [8] with modifications previously described [10,29] and a modified method with ammonium bisulphite [30] were used. In all these cases the methylation patterns we found were similar. As negative controls of bisulphite modifications we used unmethylated purified PCR products ofmyogeninandPSEN1promoter, obtained from genomic DNA as template with the same MIPs primers used for bisulphite PCR; the same purified PCR products where methylated in vitro with SssI methylase (New England Biochemistry), that methylates only cytosines in CpG dinucleotides, and were used as positive controls. We adopted all the possible cautions and controls to be sure that no methodological troubles could bias our analysis. In particular: 1) DNA samples to be compared were purified in parallel and modified in the same bisulfite assay; 2) amplifications with MIPs and with MethPri-mers were performed on two aliquots of the same bisulfite-modified sample; 3) PCR products obtained by both MIPs and MethPrimers were always cloned in the same assay; 4) positive and negative controls were always used in each bisulfite assay; 5) clones were sequenced using two different instruments (the in-lab Applied Biosystems instrument and in service by Primm).
Measurement of primers efficiency by PCR assay
presented as fold increase (ratio of the experimental gene value / exogenous reference gene value) over a control sample (the less methylated sample, used as calibrator). Since the assay re-sults in a relative measure of the efficiency, we amplified in parallel exogenous mousemyogenin as reference gene when assessing humanPSEN1amplification efficiency and exogenous humanPSEN1when assessing mousemyogeninamplification efficiency. To this end, standard amount (50 ng) of mousemyogeninor humanPSEN1PCR product were respectively added to each sample before splitting it in the tubes for the amplification. We preliminary verified that primers used to amplify mousemyogeninwere not able to amplifymyogeninin human samples and that those used to amplify humanPSEN1were not able to amplifyPSEN1in mouse sam-ples. Additionally, bisulphite-treated and bisulphite-untreated PCR products were amplified as controls; as expected, MethPrimers failed to amplify untreated PCR products.
DNA digestion and PCR assays
DNA digestion and PCR reactions were performed as previously described [31]. Briefly, 2μg of genomic DNA purified from SK-N-BE cells grown in condition of high and low methylation (HM and LM, respectively) were treated at 37°C overnight with 6U and for further 6 hours with other 4U of the PvuII, EcoNI and EcoRI restriction endonucleases. They have the follow-ing characteristics in the amplified region ofPSEN1promoter: i) PvuII has one recognition site at the cytosine 862 of the sequence and is sensitive to CpT methylation; ii) EcoNI has one rec-ognition site at the position 1204 and is methylation insensitive; iii) EcoRI has no recrec-ognition sites. The digested samples were then amplified as previously described by the same couple of MIPs primers used for bisulphite analysis. All the electrophoresis gels were analyzed using a computerized densitometer (Fluor-S, Bio-Rad). Controls with heat-inactivated endonucleases and on non-methylated PCR products were performed. Specificity of digested samples was confirmed by molecular weight comparison with DNA molecular weight markers and by sequencing.
Statistical analysis
Statview statistical software was used to calculate any significant difference reported in this paper. Histograms show the mean value ± s.d. Asterisks in figures evidence the statistically sig-nificant differences; differences lacking of remarks are to be considered non-sigsig-nificant.
Analysis on methylation data was performed using non-parametric tests since the experi-mental method we applied (sequencing of at least 10 clones for each experiexperi-mental replicate) re-sults in percent values (methylation %) for many cytosines (non-correlated values) in each sample. Mann-Wittney test was used to calculate inter-sample differences (i.e. when comparing HM and LM samples); Wilcoxon test was used to calculate intra-sample differences (i.e. when comparing MIPs and MethPrimers data).
One-way ANOVA was computed and Bonferroni post-test was used to evaluate any signifi-cant difference in the Real-Time PCR assays. To assess the correlation between quantitative variables, we computed the linear correlation coefficient r (Pearson’s) with the corresponding significance level.
Ethical issues
present study were collected in the Dept. of Surgery“P. Valdoni”, Sapienza University of Rome after Institutional and National approval according to the EU laws.
Supporting Information
S1 Fig.MyogeninandPSEN1promoters and PCR primers.a) Schematic representation of the investigated region in mousemyogenin(up) and humanPSEN1(down) 5’-flanking regions. Numbers on the left of the DNA sequences indicates the base-number as prorated in the Gene-Bank sequences. MethylC-Insensitive Primers (MIPs) are indicated in bold-blue and MethPri-mers are indicated in bold/underline. b) Characteristics of the oligonucleotides used as priMethPri-mers to investigate mousemyogeninand humanPSEN1methylation. The position of each primer is indicated below the sequence.
(PDF)
S2 Fig. Complete Cytosine methylation profile ofmyogeninpromoter.Histograms show the methylation percent measured for each (both CpG and non-CpG) cytosine in the investigated region of the mousemyogeninpromoter. Light grey columns represent the result obtained by using MIPs, whereas dark grey columns represent the results obtained by using MethPrimers. a) C2C12 in 10% FCS (high methylation); b) C2C12 in 1% FCS (low methylation); c) Embry-onic brain (high methylation); d) EmbryEmbry-onic muscle (low methylation). Detection of non-CpG methylation is clearly defective when MethPrimers are used, particularly in high
methylation conditions. (PDF)
S3 Fig. Complete Cytosine methylation profile ofPSEN1promoter.Histograms show the methylation percent measured for each (both CpG and non-CpG) cytosine in the investigated region of the humanPSEN1promoter. Light grey columns represent the result obtained by using MIPs, whereas dark grey columns represent the results obtained by using MethPrimers. a) SK-N-BE + SAM (high methylation); b) SK-N-BE in B vitamin deficient medium (low meth-ylation); c) Cortical brain tissue from control subjects (high methmeth-ylation); d) Cortical brain tis-sue from Alzheimer’s Disease subjects (low methylation). As formyogenin, it is evident, also in PSEN1promoter, that detection of non-CpG methylation is defective when MethPrimers are used, particularly in high methylation conditions.
(PDF)
S4 Fig. Restriction analysis ofPSEN1promoter.Non-CpG methylation was confirmed in SK-N-BE cells by methylation-sensitive endonuclease assay onPSEN1promoter in high meth-ylated (HM) and low methmeth-ylated (LM) samples. PvuII is inhibited when the target sequence is methylated on the CpT moiety, as schematized in the table. PCR after incubation with the en-zyme shows that HM sample and (at lower level) LM sample are incompletely cut, indicating the presence of non-CpG methylation. Use of methylation-insensitive endonuclease (EcoNI) and of unmethylated controls (PCR products) demonstrate that the DNA is not resistant for other intrinsic factors and that PvuII is able at cutting when the target sequence is unmethy-lated. MM: Molecular weight marker; PvuII Inact.: heat inactivated PvuII.
(PDF)
S5 Fig. Raw methylation data.Representation of the raw methylation data for each gene/ex-perimental condition/sample/sequenced clone. Black boxes represent methylated cytosines, white boxes represent unmethylated cytosines, as described in the graphic legend.
Author Contributions
Conceived and designed the experiments: AF ML. Performed the experiments: AF GF. Ana-lyzed the data: AF ML. Contributed reagents/materials/analysis tools: SS IF. Wrote the paper: AF IF ML.
References
1. Ramsahoye BH, Biniszkiewicz D, Lyko F, Clark V, Bird AP, Jaenisch R. Non-CpG methylation is preva-lent in embryonic stem cells and may be mediated by DNA methyltransferase 3a. Proc Natl Acad Sci USA. 2000; 97: 5237–5342. PMID:10805783
2. Fouse SD, Nagarajan RO, Costello JF. Genome-scale DNA methylation analysis. Epigenomics. 2010; 2: 105–117. doi:10.2217/epi.09.35PMID:20657796
3. Gupta R, Nagarajan A, Wajapeyee N. Advances in genome-wide DNA methylation analysis. Biotechni-ques. 2010; 49: iii–xi. doi:10.2144/000113493PMID:20964631
4. Tomizawa S, Kobayashi H, Watanabe T, Andrews S, Hata K, Kelsey G, et al. Dynamic stage-specific changes in imprinted differentially methylated regions during early mammalian development and preva-lence of non-CpG methylation in oocytes. Development. 2011; 138: 811–820. doi:10.1242/dev. 061416PMID:21247965
5. Fuso A, Ferraguti G, Grandoni F, Ruggeri R, Scarpa S, et al. Early demethylation of non-CpG, CpC-rich, elements in the myogenin 5’-flanking region: a priming effect on the spreading of active demethyla-tion. Cell Cycle. 2010; 9: 3965–3976. PMID:20935518
6. Li LC, Dahiya R. MethPrimer: designing primers for methylation PCRs. Bioinformatics. 2002; 18: 1427–1431. PMID:12424112
7. Frommer M, McDonald LE, Millar DS, Collis CM, Watt F, Grigg GW, et al. A genomic sequencing proto-col that yields a positive display of 5-methylcytosine residues in individual DNA strands. Proc Natl Acad Sci USA. 1992; 89: 1827–1831. PMID:1542678
8. Clark SJ, Harrison J, Paul CL, Frommer M. High sensitivity mapping of methylated cytosines. Nucleic Acids Res. 1994; 22: 2990–2997. PMID:8065911
9. Clark SJ, Harrison J, Frommer M. CpNpG methylation in mammalian cells. Nat. Genet. 1995; 10: 20– 27. PMID:7647784
10. Fuso A, Nicolia V, Pasqualato A, Fiorenza MT, Cavallaro RA, Scarpa S. Changes in Presenilin 1 gene methylation pattern in diet-induced B vitamin deficiency. Neurobiol Aging. 2011; 32: 187–199. doi:10. 1016/j.neurobiolaging.2009.02.013PMID:19329227
11. Fuso A, Nicolia V, Ricceri L, Cavallaro RA, Isopi E, Mangia F, et al. S-adenosylmethionine reduces the progress of the Alzheimer-like features induced by B-vitamin deficiency in mice. Neurobiol Aging. 2012; 33: 1482.e1–1482.e16.
12. Yan J, Zierath JR, Barrès R. Evidence for non-CpG methylation in mammals. Exp Cell Res. 2011; 317: 2555–2561. doi:10.1016/j.yexcr.2011.08.019PMID:21925168
13. Patil V, Ward RL, Hesson LB. The evidence for functional non-CpG methylation in mammalian cells. Epigenetics. 2014; 9: 823–828. doi:10.4161/epi.28741PMID:24717538
14. Arand J, Spieler D, Karius T, Branco MR, Meilinger D, Meissner A, et al. In vivo control of CpG and non-CpG DNA methylation by DNA methyltransferases. PLoS Genet. 2012; 8: e1002750. doi:10.1371/ journal.pgen.1002750PMID:22761581
15. Ziller MJ, Müller F, Liao J, Zhang Y, Gu H, Bock C, et al. Genomic distribution and inter-sample variation of non-CpG methylation across human cell types. PLoS Genet. 2011; 7: e1002389. doi:10.1371/ journal.pgen.1002389PMID:22174693
16. Nishino K, Hattori N, Sato S, Arai Y, Tanaka S, Nagy A, et al. Non-CpG methylation occurs in the regu-latory region of the Sry gene. J Reprod Dev. 2011; 57: 586–593. PMID:21636956
17. Teng C, Gladwell W, Raphiou I, Liu E. Methylation and expression of the lactoferrin gene in human tis-sues and cancer cells. Biometals. 2004; 17: 317–323. PMID:15222484
18. Barrès R, Osler ME, Yan J, Rune A, Fritz T, Caidahl K, et al. Non-CpG methylation of the PGC-1alpha promoter through DNMT3B controls mitochondrial density. Cell Metab. 2009; 10: 189–198. doi:10. 1016/j.cmet.2009.07.011PMID:19723495
20. Kozlenkov A, Roussos P, Timashpolsky A, Barbu M, Rudchenko S, Bibikova M, et al. Differences in DNA methylation between human neuronal and glial cells are concentrated in enhancers and non-CpG sites. Nucleic Acids Res. 2014; 42: 109–127. doi:10.1093/nar/gkt838PMID:24057217
21. Lister R, Pelizzola M, Dowen RH, Hawkins RD, Hon G, Tonti-Filippini J, et al. Human DNA methylomes at base resolution show widespread epigenomic differences. Nature. 2009; 462: 315–322. doi:10. 1038/nature08514PMID:19829295
22. Laurent L, Wong E, Li G, Huynh T, Tsirigos A, Ong CT, et al. Dynamic changes in the human methy-lome during differentiation. Genome Res. 2010; 20: 320–331. doi:10.1101/gr.101907.109PMID: 20133333
23. Xie W, Barr CL, Kim A, Yue F, Lee AY, Eubanks J, et al. Base-resolution analyses of sequence and par-ent-of-origin dependent DNA methylation in the mouse genome. Cell. 2012; 148: 816–831. doi:10. 1016/j.cell.2011.12.035PMID:22341451
24. Xie W, Schultz MD, Lister R, Hou Z, Rajagopal N, Ray P, et al. Epigenomic analysis of multilineage dif-ferentiation of human embryonic stem cells. Cell. 2013; 153: 1134–1148. doi:10.1016/j.cell.2013.04. 022PMID:23664764
25. Lister R, Mukamel EA, Nery JR, Urich M, Puddifoot CA, Johnson ND, et al. Global epigenomic reconfig-uration during mammalian brain development. Science. 2013; 341: 1237905. doi:10.1126/science. 1237905PMID:23828890
26. Guo W, Chung WY, Qian M, Pellegrini M, Zhang MQ. Characterizing the strand-specific distribution of non-CpG methylation in human pluripotent cells. Nucleic Acids Res. 2014; 42: 3009–3016. doi:10. 1093/nar/gkt1306PMID:24343027
27. Varley KE, Gertz J, Bowling KM, Parker SL, Reddy TE, Pauli-Behn F, et al. Dynamic DNA methylation across diverse human cell lines and tissues. Genome Res. 2013; 23: 555–567. doi:10.1101/gr. 147942.112PMID:23325432
28. Lister R, Ecker JR. Finding the fifth base: genome-wide sequencing of cytosine methylation. Genome Res. 2009; 19: 959–966. doi:10.1101/gr.083451.108PMID:19273618
29. Fuso A, Scarpa S, Grandoni F, Strom R, Lucarelli M. A reassessment of semiquantitative analytical pro-cedures for DNA methylation: Comparison of bisulfite- and HpaII polymerase-chain-reaction-based methods. Anal Biochem. 2006; 350: 24–31. PMID:16445884
30. Genereux DP, Johnson WC, Burden AF, Stöger R, Laird CD. Errors in the bisulfite conversion of DNA: modulating inappropriate- and failed-conversion frequencies. Nucleic Acids Res. 2008; 36: e150. doi: 10.1093/nar/gkn691PMID:18984622