www.ache.org.rs/CICEQ
Chemical Industry & Chemical Engineering Quarterly 18 (2) 283−293 (2012) CI&CEQ
A. GHADERI1 S. ABBASI1 A. MOTEVALI2 S. MINAEI2
1Department of Food Science and Technology, Faculty of Agriculture, Tarbiat Modares University, Tehran, Iran 2
Department of Agricultural Machinery Engineering, Faculty of Agriculture, Tarbiat Modares University, Tehran, Iran
SCIENTIFIC PAPER
UDC 635.8:66.047.4/.6 DOI 10.2298 / CICEQ110823005G
COMPARISON OF MATHEMATICAL MODELS
AND ARTIFICIAL NEURAL NETWORKS FOR
PREDICTION OF DRYING KINETICS OF
MUSHROOM IN MICROWAVE–VACUUM
DRIER
Drying characteristics of button mushroom slices were determined using mic-rowave–vacuum drier at various powers (130, 260, 380 and 450 W) and abso-lute pressures (200, 400, 600 and 800 mbar). To select a suitable mathema-tical model, 6 thin-layer drying models were fitted to the experimental data. The fitting rates of models were assessed based on three parameters: highest R2, lowest χ2 and root mean square error (RMSE). In addition, using the experi-mental data, an ANN trained by standard back-propagation algorithm was de-veloped in order to predict moisture ratio (MR) and drying rate (DR) values based on the three input variables (drying time, absolute pressure, microwave power). Different activation functions and several rules were used to assess percentage error between the desired and the predicted values. According to our findings, the Midilli et al. model showed a reasonable fitting with experi-mental data, while the ANN model showed its high capability to predict the MR and DR quite well with determination coefficients (R2) of 0.9991, 0.9995 and 0.9996 for training, validation and testing, respectively. Furthermore, their pre-dictions mean square error were 0.00086, 0.00042 and 0.00052, respectively.
Keywords: microwave–vacuum drier, mushroom, mathematical model, artificial neural networks.
Drying is a well known method to preserve fruits and vegetables since water removal during this pro-cess can prevent harmful chemical reactions as well as growth of microorganisms which all together lead to a longer storage time [1].
Amongst the available drying methods, fan-as-sisted convection driers are the most common ones used for drying, but they usually have some unde-sirable effects such as surface burning, shrinkageand discoloration on the dried product. In addition, long drying periods and high energy consumption are other disadvantages associated with these driers. There-fore, over the recent years the researchers have tried to modify the available methods as well as elucidate
Correspondening author: S. Abbasi, Department of Food Sci-ence and Technology, Faculty of Agriculture, Tarbiat Modares University, P. O Box 14115-336, Tehran, Iran.
E-mail: [email protected] Paper received: 23 October, 2011 Paper revised: 9 January, 2012 Paper accepted: 11 January, 2012
the capability of other types of driers in order to over-come the abovementioned issues. The most exami-ned modifications were the use of vacuum as well as novel heating methods namely microwave in order to decrease the drying temperature as well as to improve the qualitative properties of the dried product [2,3].
Microwave drying is a relatively inexpensive me-thod and has attracted many researchers in recent years. In a microwave drier, electromagnetic energy is directly converted to kinetic energy of water mole-cules and heat is produced within the product. Since the electromagnetic waves can penetrate into the ma-terial therefore the whole volume of the treated mate-rial can be heated and the occurrence of this phenol-menon can increase the drying rate [4]. Moreover, microwave driers can be combined with vacuum sys-tems in order to achieve the benefits of both [5,6].
to convective air drying were reported [7]. In some other studies, the potential of mathematical modeling as a measure by which one can predict and improve the efficiency of the processes where the relationship between interfering factors and final outputs is of great value for researchers and technicians [8].
Apart from mathematical modeling, the efficacy of artificial neural networks (ANN), as a novel ap-proach, has been successfully approved in resolving a wide variety of issues in science and engineering, particularly for some areas where the conventional modeling methods fail. A well-trained ANN can be used as a predictive model for a specific application, which is a data-processing system inspired by biolo-gical neural system [9]. Prediction of heat and mass transfer in the drying process of mango and cassava was achieved using neural networks [10]. Erenturka et al. [11] reported on the comparison of neural net-works and the regression analysis for the estimation of drying behavior of Echinacea anguishfolia. Neural networks as an approximation approach has been also used for the prediction of microwave-assisted drying process [12], prediction of drying kinetics [13], solar drying performance [14], tomato drying [15], po-megranate arils drying with microwave pretreatment [16] and mushroom slice [17].
Therefore, the main objectives of this study were to investigate the drying kinetics as well as comparing the capabilities of artificial neural network and mathe-matical models for describing the prediction of thin-layer drying of mushroom slices in a microwave–va-cuum drier under various microwave powers and ab-solute pressures.
EXPERIMENTAL
Materials. The fresh button mushroom was pur-chased from a local supermarket and kept in a refri-gerator (5 °C) prior to the experiments. To measure the initial moisture content, the mushroom (15 g) was dried using an oven (105±2 °C for 7 h) until there was no change in weight between the weightings. This process was repeated five times. The initial moisture content of the mushroom was about 94.1±0.4% on wet basis.
Microwave–vacuum drier (Figure 1). A schematic description and the set up of the laboratory equipment utilized for button mushroom drying are shown in Figure 1. This system consisted of a domestic mic-rowave oven (Micromat 725, 0.36×0.33×0.23 m, 2.45 GHz, AEG, Germany) with variable power output set-tings (130, 260, 380 and 450 W) where a glass de-siccator (150 mm I.D.) was embedded inside the mic-rowave cavity as vacuum chamber connected to
eva-cuation pump. The rotation speed of the desiccator was 12 rpm and its absolute pressure was monitored and regulated using a vacuum tester (VT1 NP, Italy, 0.1 mbar). A water load (approximately 80 g in a Py-rex beaker) was used to protect the magnetron from overheating by standing waves when the product moisture was low, especially during the latter stages [18–19]. The weight (Sarturius, TE214S, AG Ger-many, 0.0001 g) and thickness (micrometer, 1 µm) of samples were 15±1 g and 4.2±0.6 mm, respectively. In addition, drying process performed without any pre-treatment. The drying was carried out until reaching moisture content about 8% on wet basis. All treat-ments were replicated 3 times unless stated.
(a)
(b)
Figure 1. Microwave-vacuum drying system; a) schematic and b) practical set-up.
Modeling based on moisture ratio. For mathe-matical modeling purposes, the following equation was used for calculating the moisture ratio (MR) of mushroom during the drying process:
e
0 e
t
M M
MR
M M
− =
− (1)
where MR stands for moisture ratio (dimensionless); Mt, the mean moisture content of mushroom at any
time (kg water/kg dry matter); M0, the initial moisture
content of mushroom (kg water/kg dry matter); and Me, the equilibrium moisture content of mushroom (kg
As the value of Me is negligible compared to that
of M0 and Mt, the error of omitting Me is often
insi-gnificant, so the equation simplified as follows [20]:
0
t
M MR
M
= (2)
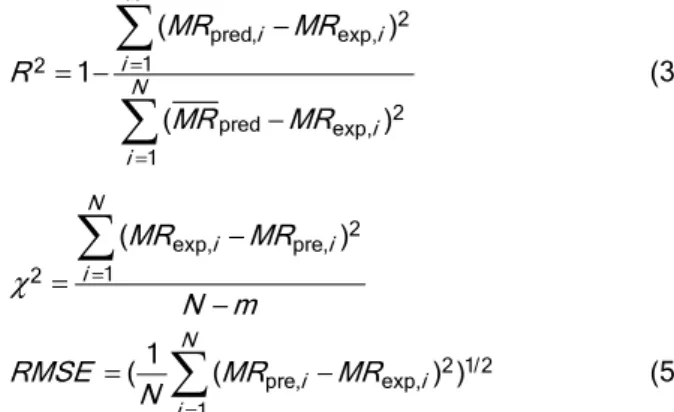
Selected mathematical models (Table 1) were fitted to experimental data (moisture ratio versus dry-ing time) usdry-ing MATLAB 2007 software. To determine the best model to represent the drying behavior of mushroom slices, the following equations were used for calculation of determination coefficient (R2
), chi square (χ2) and root mean square error (RMSE) para-meters:
2 pred, exp, 1
2
2 pred exp, 1
( )
1
( )
N
i i
i N
i i
MR MR
R
MR MR
=
=
−
= −
−
(3)2 exp, pre, 1
2
( )
N
i i
i
MR MR
N m
χ =
−
=
−
2 1/2 pre, exp, 1
1
( ( ) )
N
i i
i
RMSE MR MR
N =
=
− (5)where MRexp,i and MRpre,i are experimental and
pre-dicted dimensionless moisture ratios, respectively; N is the number of observations; and m is the number of drying constants. The most suitable mathematical model for describing drying characteristics of mush-room slice would be a model with the highest R2
and the lowest χ2 and RMSE values.
Modeling based on drying rate. The following equation has already been reported for the calculation of the drying rate of mushroom [21]:
d
d
t t t
MC MC
DR
t
+ −
= (6)
where DR is the drying rate, MCt+dt is moisture content
at time oft+dt, MCt is moisture content at time of t and
dt is the time interval between two weightings.
Since at the very early stages of drying process, the drying rate rapidly increases and continuously decreases therefore, it was suggested to employ the following equation to describe the drying rate [22]:
max( )exp(1 )
t t
DR DR
l l
= − (7)
where l represents the time when the highest drying rate is occurred, DR is the drying rate in a given time, DRmax ismaximum drying rate and t is the drying time.
It is noteworthy that in many cases the values of k and DRmax can be directly obtained from the
mea-sured data of drying rate.
The three aforementioned criteria (R2, χ2 and
RMSE) were used to verify the fitting rate of the mo-dels.
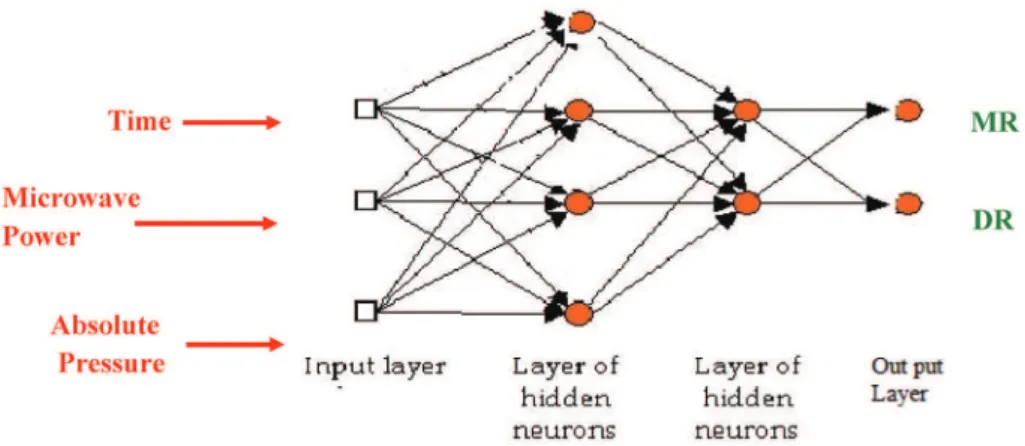
Artificial neural network design. To obtain the best prediction by the network, several architectures were evaluated and trained using the experimental data. The back-propagation algorithm was utilized in training of all ANN models. This algorithm uses the supervised training technique where the network weights and biases are initialized randomly at the be-ginning of the training phase. The error minimization process is achieved using the gradient descent rule. There were three inputs: time (t, min), microwave power (P, W), absolute pressure (abs P, mbar) and two outputs: moisture ratio (MR) and drying rate (DR) in the developed ANN model (Figure 2).
Several transfer functions including sigmoid, lo-garithmic and linear functions together with super-vised training algorithms and feed forward back-pro-pagation approach were evaluated. To ensure that each input variable provides an equal contribution to the ANN, the inputs of the model were preprocessed and normalized, after which, 65 and 25% of 165 input patterns were devoted to training and validation data sets, respectively. The remaining 10% of the data was utilized for the tests. The learning rate of 0.2 and momentum of 0.1 were adjusted to all the tested net-works. Optimum topologies were defined based on the highest R2 and lowest mean square error (MSE) values. The complexity and size of the network was
Table 1. Selected mathematical models for describing the drying kinetics of button mushroom
Model Mathematical Expression
Lewis [31]
exp( )
MR = −kt
Henderson and Pabis [32-33]
exp( )
MR=a −kt
Page [34]
exp( n) MR= −kt
Logarithmic [35] exp( ) (1 )exp( )
MR=a −kt + −a −kbt
Verma et al. [36-37] exp( ) (1 )exp( )
MR=a −kt + −a −gt
Midilli et al. [38] exp( n)
important, therefore the smaller ANNs had the priority to be selected [16,23]. The required codes were deve-loped using MATLAB 2007.
RESULTS AND DISCUSSION
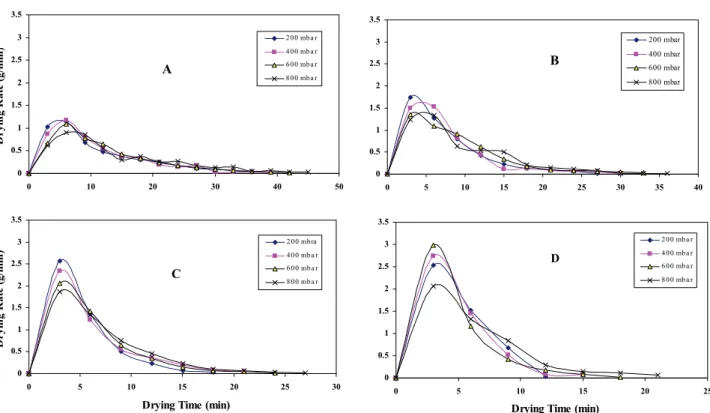
At the beginning of the drying process, due to the high initial moisture content of the mushroom, the drying rate was also high. Over time, the drying rate decreased owing to the reduction of moisture content (Figure 3). It can clearly be seen that mushroom lost the majority of its moisture within the first few minutes of drying while a long time is required to remove the remaining moisture. It is noteworthy that high
micro-wave power and low absolute pressure led to lower moisture ratio at a reasonably shorter time (Figure 3). The highest drying rate is obtained at a reasonably high microwave power level (450 W). Rotation of di-pole molecules (e.g., water) is the main mechanism which explains the heat production in an object placed inside a microwave field. These molecules generally have a random direction but when inside a microwave field, they adapt themselves to the polarity of the field. It needs to be noted that with increasing the micro-wave power level, although the frequency is the same, but the energy density increases therefore produces more heat which leads to faster drying. Also, applying vacuum during drying results in the expansion of air Figure 2. Configuration of multilayer (t, P, abs P) neural network for predicting MR and DR.
A
0 0.2 0.4 0.6 0.8 1 1.2
0 10 20 30 40 50
M
o
is
tu
re
R
a
ti
o
(
M
R
)
2 0 0 mb a r 4 0 0 mb a r 6 0 0 mb a r 8 0 0 mb a r
B
0 0.2 0.4 0.6 0.8 1 1.2
0 5 10 15 20 25 30 35 40
2 0 0 mb a r 4 0 0 mb a r 6 0 0 mb a r 8 0 0 mb a r
C
0 0.2 0.4 0.6 0.8 1 1.2
0 5 10 15 20 25 30
Drying Time (min)
M
o
is
tu
re
R
a
ti
o
(
M
R
) 2 0 0 mb a r
4 0 0 mb a r 6 0 0 mb a r 8 0 0 mb a r
D
0 0.2 0.4 0.6 0.8 1 1.2
0 5 10 15 20 25
Drying Time (min)
2 0 0 mb a r 4 0 0 mb a r 6 0 0 mb a r 8 0 0 mb a r
and steam inside the foodstuff which forms a puffy structure. This structure of foodstuff leads to easier escape of moisture.
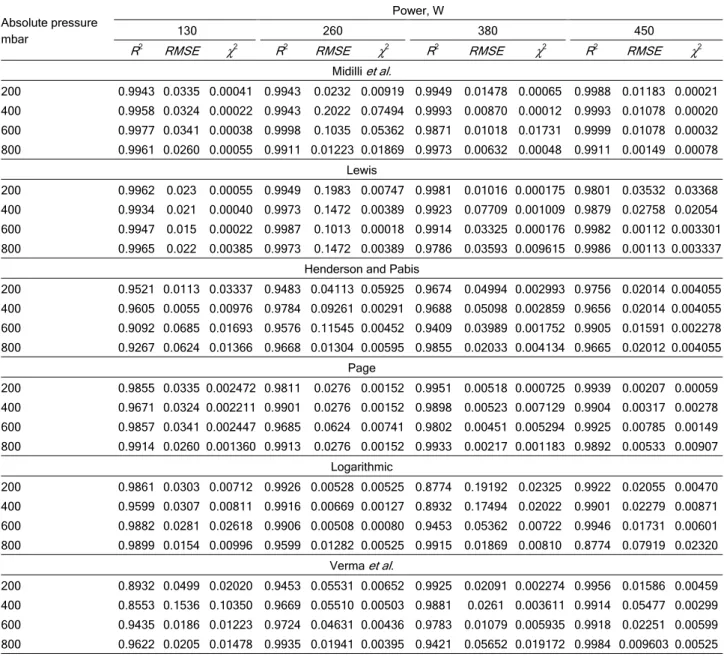
In the next step, the experimental data (the moisture ratios obtained at different absolute pres-sures and microwave powers) were fitted with various mathematical models (Table 1) and goodness of fit was evaluated based on R2
, χ2 and RMSE values. The results showed that the model developed by Mi-dilli et al. could predict mushroom thin layer drying ki-netics more accurately than the others (Table 2).
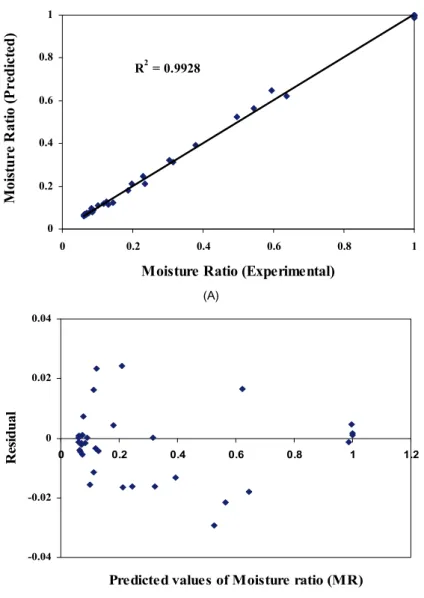
Validation of the determined model was estab-lished by comparing the experimental data, for drying curve (in 380 W microwave power), with the values predicted by the Midilli et al. model and the results are
plotted in (Figure 4a). The closeness of experimental data with regression line demonstrates the suitability of the model in describing the thin-layer drying be-havior of the mushroom slice. In order to confirm the suitability of the selected model, the residual versus predicted values of moisture ratio were plotted (Figure 4b). As it can be seen, the proximity of residuals around zero line shows the sufficiency of the derived model. In this regard, it has been reported [24,25] that the fall of data points in a horizontal band centered on zero line displays no systematic tendencies toward a clear pattern. Therefore, there was no systematic pat-tern.
Figure 5 also shows the effects of absolute pres-sure and microwave power on the drying rate of
mush-Table 2. Fitting rate of mushroom drying kinetics (moisture ratio) with Midilli et al. model at various microwave power and absolute pressures
Power, W Absolute pressure
mbar 130 260 380 450
χ2 RMSE R2 χ2 RMSE R2 χ2 RMSE R2 χ2 RMSE R2
Midilli et al.
0.00021 0.01183 0.9988 0.00065 0.01478 0.9949 0.00919 0.0232 0.9943 0.00041 0.0335 0.9943 200 0.00020 0.01078 0.9993 0.00012 0.00870 0.9993 0.07494 0.2022 0.9943 0.00022 0.0324 0.9958 400 0.00032 0.01078 0.9999 0.01731 0.01018 0.9871 0.05362 0.1035 0.9998 0.00038 0.0341 0.9977 600 0.00078 0.00149 0.9911 0.00048 0.00632 0.9973 0.01869 0.01223 0.9911 0.00055 0.0260 0.9961 800 Lewis 0.03368 0.03532 0.9801 0.000175 0.01016 0.9981 0.00747 0.1983 0.9949 0.00055 0.023 0.9962 200 0.02054 0.02758 0.9879 0.001009 0.07709 0.9923 0.00389 0.1472 0.9973 0.00040 0.021 0.9934 400 0.003301 0.00112 0.9982 0.000176 0.03325 0.9914 0.00018 0.1013 0.9987 0.00022 0.015 0.9947 600 0.003337 0.00113 0.9986 0.009615 0.03593 0.9786 0.00389 0.1472 0.9973 0.00385 0.022 0.9965 800
Henderson and Pabis
0.004055 0.02014 0.9756 0.002993 0.04994 0.9674 0.05925 0.04113 0.9483 0.03337 0.0113 0.9521 200 0.004055 0.02014 0.9656 0.002859 0.05098 0.9688 0.00291 0.09261 0.9784 0.00976 0.0055 0.9605 400 0.002278 0.01591 0.9905 0.001752 0.03989 0.9409 0.00452 0.11545 0.9576 0.01693 0.0685 0.9092 600 0.004055 0.02012 0.9665 0.004134 0.02033 0.9855 0.00595 0.01304 0.9668 0.01366 0.0624 0.9267 800 Page 0.00059 0.00207 0.9939 0.000725 0.00518 0.9951 0.00152 0.0276 0.9811 0.002472 0.0335 0.9855 200 0.00278 0.00317 0.9904 0.007129 0.00523 0.9898 0.00152 0.0276 0.9901 0.002211 0.0324 0.9671 400 0.00149 0.00785 0.9925 0.005294 0.00451 0.9802 0.00741 0.0624 0.9685 0.002447 0.0341 0.9857 600 0.00907 0.00533 0.9892 0.001183 0.00217 0.9933 0.00152 0.0276 0.9913 0.001360 0.0260 0.9914 800 Logarithmic 0.00470 0.02055 0.9922 0.02325 0.19192 0.8774 0.00525 0.00528 0.9926 0.00712 0.0303 0.9861 200 0.00871 0.02279 0.9901 0.02022 0.17494 0.8932 0.00127 0.00669 0.9916 0.00811 0.0307 0.9599 400 0.00601 0.01731 0.9946 0.00722 0.05362 0.9453 0.00080 0.00508 0.9906 0.02618 0.0281 0.9882 600 0.02320 0.07919 0.8774 0.00810 0.01869 0.9915 0.00525 0.01282 0.9599 0.00996 0.0154 0.9899 800
Verma et al.
room during thin layer drying. As can be seen (Figure 5), at the early stages of drying (up to 5 min) the dry-ing rate sharply increased followed by a steady de-crease over time (falling rate period). Similar results have been reported for drying of other crops [26–29].
The fitting of drying rates at various levels of microwave power and absolute pressure with the pre-sented model (Table 3) confirmed its suitability. Even though, the occurrence of some irregular variations, shallow depth of mushroom slice, was unable to keep moist the top layer during the whole drying time.
Artificial neural network modeling. Our findings (Figure 6) showed that the back propagation training algorithm was well suited for prediction of moisture ra-tio and drying rate based on different drying time, ab-solute pressure and microwave power levels. The prediction mean square error (MSE) values for
train-ing, validation and testing were 0.00086, 0.00042 and 0.0052, respectively.
ANN predictions for the MR and DR yielded de-termination coefficients (R2) of 0.9991, 0.9995 and 0.9996 for training, validation and testing, respectively (Table 4). Furthermore, their predictions for MSE were 0.00086, 0.00042 and 0.00052, respectively.
Figure 7 shows the correlation between the ex-perimental and prediction data in the test (for MR and DR) by the developed ANN model (test data) for mushroom slices dried at various microwave powers and absolute pressures. It can be seen that the de-termination coefficient is quite high for both MR and DR, which implies the desirability of ANN for predic-tion of drying kinetics of mushroom slices dried in a microwave drier. Similar results have been reported for other agriculture products [11,15–16,23].
R2 = 0.9928
0 0.2 0.4 0.6 0.8 1
0 0.2 0.4 0.6 0.8 1
Moisture Ratio (Experimental)
Moi
st
u
re
R
a
ti
o (
P
re
d
ict
ed
)
(A)
-0.04 -0.02 0 0.02 0.04
0 0.2 0.4 0.6 0.8 1 1.2
Predicted values of Moisture ratio (MR)
R
es
idual
(B)
B
0 0.5 1 1.5 2 2.5 3 3.5
0 5 10 15 20 25 30 35 40
200 mbar 400 mbar 600 mbar 800 mbar
C
0 0.5 1 1.5 2 2.5 3 3.5
0 5 10 15 20 25 30
Drying Time (min)
Dr
y
in
g
Ra
te
(
g
/m
in
)
2 0 0 mb ra 4 0 0 mb a r 6 0 0 mb a r 8 0 0 mb a r
D
0 0.5 1 1.5 2 2.5 3 3.5
0 5 10 15 20 25
Drying Time (min)
2 0 0 mb a r 4 0 0 mb a r 6 0 0 mb a r 8 0 0 mb a r A
0 0.5 1 1.5 2 2.5 3 3.5
0 10 20 30 40 50
Dr
y
in
g
Ra
te
(
g
/m
in
)
2 0 0 mb a r 4 0 0 mb a r 6 0 0 mb a r 8 0 0 mb a r
Figure 5. Influence of absolute pressure (200
♦
, 400■
, 600▲
and 800×
mbar) on drying rate of mushroom slices during drying process at various microwave powers, A) 130, B) 260, C) 380 and D) 450 W/Table 3. Fitting rate of mushroom drying kinetics (drying rate) with Eq. (7) at various microwave power and absolute pressure Power, W
Pressure, mbar 130 260 380 450
χ2
RMSE R2
χ2
RMSE R2
χ2
RMSE R2
χ2
RMSE R2
0.02493 0.03531
0.9771 0.00875 0.01871
0.9862 0.00913 0.01426
0.9076 0.0133 0.0263
0.8324 200
0.02581 0.03787
0.9363 0.01252 0.02282
0.9345 0.01046 0.01933
0.8832 0.02055 0.0422
0.8052 400
0.01979 0.03228
0.9496 0.01839 0.02892
0.9091 0.01561 0.02324
0.8631 0.02145 0.04732
0.7809 600
0.02915 0.01024
0.9548 0.01026 0.02159
0.9549 0.00345 0.01131
0.8956 0.02693 0.05601
0.7688 800
0.0001 0.001 0.01 0.1 1 10
0 20 40 60 80 100 120
Epoch
P
erf
o
rm
a
n
ce
Tra n in g Va lid a tio n Te s t
Table 4. Summary of the various ANN networks evaluated to yield the best determination coefficient (R2) and mean square error
Epoch MSE (test) MSE
(validation) MSE
(training) R2
(test) R2
(validation) R2
(training) Training
error Neurons in
hidden layer 2 Neurons in
hidden layer 1 Activation
function
51 0.00373 0.00060
0.00028 0.8968
0.8775 0.9016
0.00025 0
5 Log/Tan
62 0.00239 0.00891
0.00059 0.9393
0.9041 0.9535
0.00064 0
10 Log/Tan
69 0.01264 0.00010
0.00059 0.9595
0.9404 0.9478
0.00013 0
15 Log/Tan
59 0.00735 0.00377
0.00071 0.9386
0.9662 0.9218
0.00085 0
25 Log/Tan
77 0.05605 0.00775
0.00081 0.9886
0.9341 0.9008
0.00096 0
40 Log/Tan
89 0.00308 0.00249
0.00011 0.8997
0.8571 0.8621
0.00014 10
5 Log/Tan/Tan
96 0.00220 0.00141
0.00044 0.9291
0.9486 0.9147
0.00053 15
10 Log/Tan/Tan
134 0.00307 0.00111
0.00021 0.9533
0.9529 0.9364
0.00034 30
20 Log/Tan/Tan
149 0.00056 0.00107
0.00054 0.9792
0.9943 0.9831
0.00070 25
25 Log/Tan/Tan
174 0.00388 0.00811
0.00011 0.8935
0.9287 0.9031
0.00070 40
30 Log/Tan/Tan
112 0.00052 0.00042
0.00037 0.9996
0.9995 0.9991
0.00086 15
15 Log/Tan/Tan
124 0.00811 0.00338
0.00069 0.9906
0.9983 0.9923
0.00015 10
20 Log/Tan/Tan
129 0.00373 0.00060
0.00072 0.9829
0.9083 0.9424
0.00044 15
25 Log/Tan/Tan
89 0.00239 0.00891
0.00012 0.9964
0.9971 0.9954
0.00082 5
10 Log/Tan/Tan
(A)
(B)
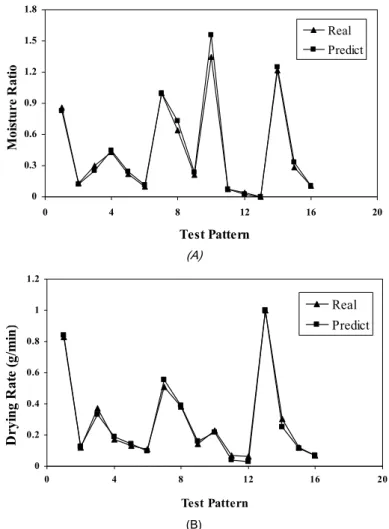
Figure 8 shows that the accuracy of predicted value is excellent for the moisture ratio and drying rate. The accuracy of ANN model is tested through the comparison of predicted and experimental mush-room slice moisture ratio and drying rate with test pattern during microwave–vacuum drying process. This figure shows the results of analysis for moisture ratio and drying rate, respectively. As can be seen, all the investigated prediction models simulate the ex-periments satisfactorily for both moisture ratio and drying rate. The developed network had a good gene-ralization in predicting the drying quality (MR and DR) of the mushroom slice for test data during drying pro-cess. Thus, this network model could be used to de-termine the moisture ratio and drying rate of the agri-culture product under the dynamic drying system. Si-milar results have been reported [14,30]. Moreover, our results have shown that the indicators for good-ness of fit of the proposed ANN model are better than the values obtained by the mathematical model (com-parison of Figures 4 and 7 and Tables 2 and 4). There-fore, the proposed ANN model was selected to repre-sent the thin-layer drying behavior of mushroom.
CONCLUSION
Non-linear regression analysis was used to evaluate the capability of six thin-layer drying models to simulate microwave–vacuum drying of mushroom. Experimental data were obtained over wide range of microwave powers (130, 260, 380 and 450 W) and absolute pressures (200, 400, 600 and 800 mbar) in a laboratory microwave–vacuum drier. The mathemati-cal model developed by Midilli et al. showed the best fit with the experimental data. Regarding the ANN algorithm, the selected model, 3-15-15-2 (3 neurons in input layer, 15 neurons in the hidden layer 1, 15 neurons in the hidden layer 2 and 2 neurons in the output layer) successfully learned the relationship bet-ween input and output parameters. The ANN results were quite satisfactory; R2
values in this model were close to one, while mean square errors (MSE) were found to be very low. Analysis of the experimental data by the ANN revealed a good correlation between the ANN-predictions and the experimental data. Ge-nerally speaking, artificial neural networks performed better than mathematical models in predicting
mois-0 0.3 0.6 0.9 1.2 1.5 1.8
0 4 8 12 16 20
Test Pattern
Moi
st
u
re
R
a
ti
o
Real
Predict
(A)
0 0.2 0.4 0.6 0.8 1 1.2
0 4 8 12 16 20
Test Pattern
Dr
y
in
g
Ra
te
(
g
/m
in
)
Real Predict
(B)
ture ratio and drying rate of mushroom slice during the drying process.
REFERENCES
[1] G.V. Barbosa-Canovas, H. Vega-Mercado, Dehydration of Foods, Chapman and Hall, New York, 1996, p. 29
[2] S. Jaya, H. Das, Drying Tech. 21 (2003) 1215–1234 [3] E. Kompany, J. Benchimol, K. Allaf, B. Ainseba, J.M.
Bou-vier, Drying Tech. 11 (1993) 451–470
[4] M. Krulis, S. Kuhnert, M. Leiker, H. Rohm, Eur. Food Res. Tech. 221 (2005) 803–808
[5] H. Schubert, M. Regier, 1st
ed., Woodhead Publishing Ltd.,. Sawston, Cambridge, 2005, pp. 1–110
[6] Y. Li, S.Y. Xu, D.W. Sun, J. Food Eng. 83 (2007) 76–83 [7] S.K. Giri, P. Suresh, J. Food Eng. 78 (2007) 512–521 [8] G.W. Collins, Astrophys. Data Syst. (2003) 254–328 [9] J. Hertz, A. Krogh, R. G. Palmer, Introduction to the Theory
of Neural Computation, Addison-Wesley Publishing Com-pany, Boston, MA, 1991, p. 313
[10] J.A. Hernandez-Perez, M.A. Garca-Alvarado, G. Trystram, B. Heyd, Innov. Food Sci. Emerg. Tech. 5 (2004) 57–64 [11] K. Erenturka, S. Erenturkb, L.G. Tabilc, Comput. Electron.
Agr. 45 (2004) 71–90
[12] J.L. Pedren, T. O-Molinaa, J. Monzo-Cabreraa, A. Toledo-Moreob, D. Sanchez-Rnandez, Int. Commun. Heat Mass 32 (2005) 1026–1033
[13] E. Tomczak, W. Kaminski, Handbook of Conveying and Handling of Particulate Solids, Elsevier Science, New York, 2001, p. 569
[14] P.P. Tripathy, S. Kumar, Int. J. Thermal Sci. 48 (2009) 1452–1459
[15] K. Movagharnejad, M. Nikzad, Comput. Electron. Agr. 59 (2007) 78–85
[16] A. Motevali, S. Minaei, M.H. Khoshtaghaza, M. Kazemi, A.M. Nikbakht, Intl. J. Food Eng. 6 (2010) 1–19
[17] P. Poonpat, T. Ampawan, C. Manjeet, Chem Product & Process Modeling 2 (2007) 3, 25
[18] S. Abbasi, S. Azari, Int. J. Food Sci. Tech. 44 (2009) 974– 979
[19] W. A. M. McMinn, J. Food Eng. 72 (2006) 113–123 [20] I. Doymaz, J Food Eng. 78 (2007) 1291-1297 [21] B. Zbek, G. Dadali, J. Food Eng. 83 (2007) 541–549 [22] M. Aghbashlo, M. H. Kianmehr, A. Arabhosseini, H.
Sa-mimi, H. Mehravar, The 5th national congress of mecha-nization, Mashha, Iran, 2009
[23] A. Motevali, G.H. Najafi, S. Abbasi, S. Minaei, A. Ghaderi, J. Food Sci. Tech. 12 (2011) 42, DOI: 10.1007/s13197-011-0393-1
[24] G. Xanthopoulos, N. Oikonomou, G. Lambrinos, J. Food Eng. 81 (2007) 553–559
[25] C.C. Chen, R.V. Morey, Transac. ASAE 32 (1989) 983–990 [26] A. Kaya, O. Aydin, C. Demirtas, Biosystems Eng. 96 (2007)
517–524
[27] P. Rajkumar, R. Kailappan, R. Viswanathan, G.S.V. Rag-havan, J. Food Eng. 79 (2007) 1452–1459
[28] S.M. Tasirin, S.K. Kamarudin, K. Jaafar, K.F. Lee, J. Food Eng. 79 (2007) 695–705
[29] Z. Wang, J. Sun, X. Liao, F. Chen, G. Zhao, J. Wu, X. Hu, Food Res. Int. 40 (2007) 39–46
[30] L. Xueqiang, Ch. Xiaoguang, W. Wenfu, P.Guilan, Food Control 18 (2007) 928–933
[31] W. K. Lewis, Ind. Eng. Chem. 13 (1921) 427–432
[32] S. Lahsasni, M. Kouhila, M. Mahroz, L. Aitmahmamad, B. Agorram, J. Food Process Eng. 27 (2004) 103–117 [33] S.M. Henderson, S. Pabis, J. Agr. Eng. Res. 6 (1961) 169–
–170
[34] G.E. Page, M.Sc. Thesis, Purdue University, 1949 [35] I.T. Togrul, D. Pehlivan, J. Food Eng. 65 (2004) 413–425 [36] L.R. Verma, R.A. Bucklin, J.B. Endan, F.T. Wratten, T.
ASAE 28 (1985) 296–301
[37] H. O. Menges, C. Ertekin, J. Food Eng. 77 (2005) 119–125 [38] A. Midilli, H. Kucuk, Z. Yapar, Drying Tech. 20 (2002)
A. GHADERI1 S. ABBASI1 A. MOTEVALI2 AND S. MINAEI2
1
Department of Food Science and Technology, Faculty of Agriculture,
Tar-biat Modares University, Tehran, Iran 2
Department of Agricultural Machinery Engineering, Faculty of Agriculture, Tarbiat Modares University, Tehran, Iran NAUČNI RAD
PORE
Đ
ENJE MATEMATI
Č
KIH MODELA I
VEŠTA
Č
KIH NEURONSKIH MREŽA ZA PREDIKCIJU
KINETIKE SUŠENJA GLJIVA U MIKROTALASNOJ
VAKUUM SUŠNICI
Određene su karakteristike sušenja kolutova šampinjona u mikrotalasnoj vakuum sušnici pri različitim snagama (130, 260, 380 i 450 W) i apsolutnim pritiscima (200, 400, 600 i 800 mbar). Da bi se izabrao odgovarajući matematički model, 6 modela sušenja u tan-kom sloju su poređena sa eksperimentalnim podacima. Prihvatljivost modela je proce-njena na osnovu tri parametra: najviši R2, najniži Hi-kvadrat (
χ2) i korena srednje kva-dratne greške (RMSE). Takođe, korišćenjem eksperimentalnih podataka, ANN, obučena po standardnom algoritmu povratne propagacije, razvijena je u cilju predikcije vrednosti odnosa vlage (MR) i brzine sušenja (DR)na osnovu tri ulazne promenljive veličine (vre-me sušenja, apsolutni pritisak, snaga mikrotalasa). Različite aktivacione funkcije i nekoli-ko pravila su nekoli-korišćeni za procenu procentualne greške između željenih i predviđenih vrednosti. Prema dobijenim rezultatima, model Midilli-ja i saradnika solidno fituje eksperi-mentalne podatke. Sa druge strane, ANN model ima veliku mogućnost vrlo dobre predik-cije MR i DR vrednosti sa odlučujućim koeficijentima (R2) treniranja, validacije i testira-nja od 0,9991, 0,9995 i 0,9996, respektivno. Osim toga, njegove prognoze srednje kva-dratne greške su 0,00086, 0,00042 i 0,00052, respektivno.