ISSN 1546-9239
© 2010 Science Publications
Corresponding Author: Khairayu Badron, Department of Electrical and Computer Engineering, Faculty of Engineering, International Islamic University Malaysia, Malaysia
V-Band Fade Dynamics Characteristics Analysis in Tropical Region
1
Khairayu Badron,
1Ahmad Fadzil Ismail,
2Jafri Din and
2Ahmad Tharek Abdul Rahman
1Department of Electrical and Computer Engineering,
Faculty of Engineering, International Islamic University Malaysia, Malaysia
2Wireless Communication Centre, Faculty of Electrical Engineering,
University Technology Malaysia, Johor Bahru, Malaysia
Abstract:Problem statement: Satellite operations at V-band in tropical and equatorial regions are constrained as a result of attenuation from rain. Approach: Statistics for 20 consecutive months of V-band terrestrial link signal attenuation measurements in Malaysia were presented in this analysis. Such information was considered very pertinent for Earth-space communication link design and can be used for initial groundwork plan for the engineers as well as researchers. Results: The measured statistics were then fittingly scaled up to fit Earth-satellite link. The statistics were then broken down to examine diurnal variations. Characteristics of rain events such as fade duration and inter-fade interval were presented. Conclusion/Recommendations: It is essential to identify such characteristics for the design and implementation of future fade countermeasure techniques on satellite links.
Key words: Rain attenuation, V-band satellite communication system, fade duration, inter-fade interval, tropical region
INTRODUCTION
The high attenuation experienced in these areas is caused by significantly higher rainfall rates compared to other parts of the world. Due to the intensification in the use of frequency spectrum, new and existing satellite operators in the tropics may soon have no other alternative but to progress up to frequencies as high as the V-band (Brussaard and Watson, 1995). Nonetheless, the effects of rainfall on satellite signals at such high frequencies in the tropical region have not yet been fully detailed. Additional measured data, researches, experiments and investigations are considered essential in order to obtain more insights in this issue.
The databases made available to the research from a measurement campaign in Malaysia provide invaluable opportunities to examine the V-band propagation characteristics in the tropical region. Measurements acquired from a microwave link establishment should be able to offer some initial impressions of the V-band link’s characteristics in the absence of an actual satellite-Earth link. The information is deemed very critical for future Earth space communication link design and can be exploited as preliminary groundwork plan for the researchers as well as engineers.
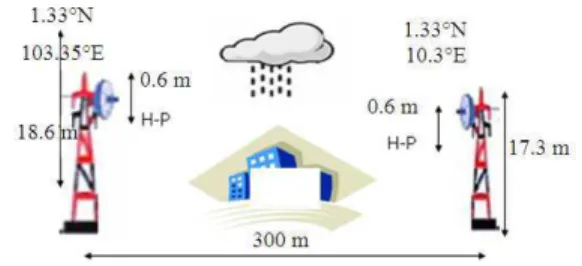
Experimental setup and background: A 38GHz experimental Ericsson MINI-LINKS was installed at University Technology Malaysia (UTM) Johor Bahru, Malaysia in 1998. 0.6 m diameter antennas with horizontal polarization covered by radomes were assembled. The antennas were separated 300 m apart from one another. The transmitter was installed on a tower located at 103.38 and 1.33°N. The receiver was positioned on a roof-top at 103.35 and 1.33°N. The line of sight of this set up was at approximately 18 m Above Sea Level (ASL). The Automatic Gain Control (AGC) output level of the RF unit was interfaced with a PC through a data acquisition card. During clear sky condition data were sampled every 10 min and during rainy condition, they were sampled at every second. The signal measurements campaign is shown in Fig. 1.
MATERIALS AND METHODS
Fade duration statistics: Fade duration statistics are usually presented as conditional distributions of the number of fades exceeding certain durations, given that a specified fade threshold has been exceeded. According to ITU-R model (ISH, 2005), the mean duration, D0 of the log normal distribution of the
fraction of fading times given the attenuation is greater than A is:
D0 = 80ϕ−0.4 f1.4A−0.39 (1)
Where:
F = Frequency (Ghz)
ϕ = Elevation angle (degrees) A = Attenuation threshold (dB)
This representation provides information on the number of outages and system availability due to propagation on a link. The average fade duration for a given fade level can be calculated from the accumulated time at that fade level divided by the number of events that occurred at that fade level.
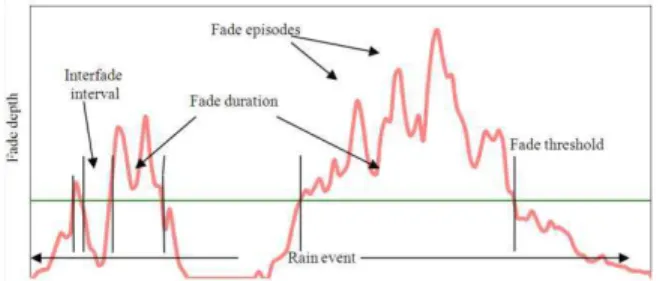
Inter-fade interval: Inter fade interval is the duration between the fade threshold goes back to the same level of the thresholds. Since the interval between fades of a given level can be calculated as the inter fade duration, that is the complement of the fade duration, the average inter-fade interval can also be found. Figure 2 illustrates the features commonly used in characterizing precipitation events.
Cumulative Distribution for diurnal variability: In designing communications links, cumulative distributions are the most effective presentation format for long-term data. For instance, link availability or exceedance at a point can be determined from its annual cumulative distribution (Badron et al., 2009). Thus,
appropriate rain induced attenuation margins can be put into the system to acquire the desired link performance. The attenuations exceeded for 99.7, 99.9 and 99.99% of the average year are reported in Table 1 and compared with data from the nearest stations in terms of climate and location. Noted that the remarkably low year to year variability of the annual cumulative distributions for the two years over the 0.1% exceedance range detected in Malaysia. The data measured in Abakaliki, Nigeria (Omotosho and Oluwafemi, 2009) and in Rio de Janeiro, Brazil (Pontes et al., 2005), both in equatorial region, show considerably more fading than Malaysia. With the variety of rain climates to be characterized, considerably more data are thus required for the development of satisfactory physically based models for prediction. The effects from extended analyses demonstrate that attenuation in an equatorial country such as Malaysia is subjected not only to seasonal, but also to diurnal variations. Significant diurnal variations for attenuation are also been observed. The diurnal variations of attenuation may have important influence on certain particular applications. For example, at point rainfall in climates where possibilities of severe signal degradations due to rainfall are higher at certain time of the day, the uplink power can be pre-programmed with additional margins to combat the uplink rain induced attenuation.
Fig. 2: Features commonly used in characterizing precipitation events
Table 1: Comparison of measured annual cumulative statistics of slant path attenuation measured in equatorial climate
Attenuation exceeded for specific % times (dB) ---
Site and reference D (m) Period of measurement Instrument type 0.3% 0.1% 0.01%
Johor Bahru, Malaysia 300 Jan. 1999-Sept. 2000 Beacon receiver 13.00 16.00 22.0
Badron et al. (2009)
Nigeria Abakaliki 300 Jan 1991-Dec. 2000 Beacon receiver 0.78 2.75 8.84
Omotosho and Oluwafemi (2009)
Rio De Jeneiro, Brazil 300 1987-2005 Beacon 6.03 7.35 9.24
Pontes et al. (2005)
Milan, Italy 300 Jan. 1991-Jan. 2001 Beacon receiver 0.90 1.58 3.32
Fiebig and Riva (2004)
Munich, Germany 300 Jan. 1991-Jan. 2001 0.80 1.44 3.80
Fiebig and Riva (2004)
Athens, Greece 300 2003 0.90 1.46 3.53
These cumulative distributions are very important since they provide information concerning the estimation of rain induced attenuation margins required for a given link reliability.
RESULTS AND DISCUSSION
Fade duration analysis: The statistics of fade duration for the period of campaign are shown in Fig. 3. The selected fade thresholds presented are of 5, 8, 10, 13, 15, 18, 20, 23, 25 and 27 dB. The fade duration is measured for 1 sec and above. From these statistics there could be 23 occasions within the twenty consecutive months when a 10 dB fade depth lasts for longer than 600 sec (equivalent to 10 min). Such analyses of the fade duration for different fade thresholds observed at 38 GHz link is used to evaluate the effects of rain induced attenuation on the operational aspect of various satellite services like the telecommunication services and television broadcasting.
Attenuation and rain fade characteristics compilation are important findings that have to be addressed in determining the effect of signal fading during rainfall events. This is especially true for the V-band satellite-Earth link services to be embarked in tropical region. The further analysis of the fade duration for various fade depths observed at the experimentation station can be used to study the effects of rain induced attenuation on operational aspect of various Earth-space satellite services like TV broadcasting, VSAT and other telecommunication services.
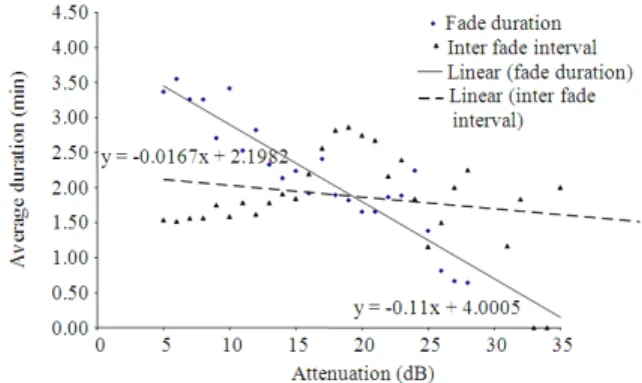
Average fade duration and inter-fade interval: The corresponding average fade duration and the inter-fade interval as the function of fade depth on a tropical satellite-Earth link are given in Fig. 4. From the analyses of the twenty months data, the average fade duration is found to be almost independent of the fade depth. The average values is obtained by dividing total measured time with number of fades equal or exceeding each fade level (with duration equal to or exceeding 1 sec).
Similar findings have also been reported in several locations in Spain by Garcia del Pino et al. (2006). The frequency of fading increases with the decrease of fade threshold as can be observed in Fig. 4 with noticeable relationship between these two parameters. It is suggested that the average inter-fade duration is independent from the fade value because the larger time percentage for which lower fade threshold is exceeded is distributed among a larger numbers of fades, whereas the lower time percentage at higher fade threshold is distributed among fewer numbers of fades.
Fig. 3: Statistics of fade duration of rain induced attenuation measured for 01/99-10/2000
Fig. 4: Average fade duration and inter-fade interval for V-band link at 300 m length transmission (Badron et al., 2010)
Average fade duration of approximately 2.4 min for most fade threshold can be observed in the Fig. 4. The spread of fade duration around the average value is expected to increases with the decrease of fade threshold because of the region is subjected to extreme and severe widespread events. The results at the lower fade threshold are very much dependent to the integration time applied, since the events are influenced by scintillation spikes. A shorter integration time will definitely detect a higher number of occurrences of specific fade threshold compared to a longer one. The variation of inter-fade interval with fade depth is also included in Fig. 3. It can be observed that the inter-fade interval lies between 1 and 3 min above the 10 dB fade threshold. As observed in this measurement, fade duration and inter-fade duration of the link can be characterized in the below Eq. 1 and 2:
tfd = -0.11a+4.0005 (1)
Where:
tfd = The fade duration
tif = The average inter-fade interval
a = The attenuation during rain events
Diurnal variability: The effects from extended analyses demonstrate that attenuation in an equatorial country such as Malaysia is subjected not only to seasonal (Badron et al., 2009) but also to diurnal variations. Significant diurnal variations for attenuation have been observed. The diurnal variations of attenuation may have important influence on certain particular applications. For example, at point rainfall in climates where possibilities of severe signal degradations due to rainfall are higher at certain time of the day, the uplink power can be pre-programmed with additional margins to combat the uplink rain induced attenuation.
Comparisons were made between findings from Malaysia with other previously reported experimental results in equatorial region. This is in order to investigate any possible similarity or distinct pattern of rain fade diurnal characteristics. Investigators (Fiebig and Riva, 2004) reported that based on their measurement campaign data, a greater probability for excess attenuation is expected during the hours from 12:00-18:00 detected at Milan, Italy. Milan is classified as humid subtropical country. In addition, Fig. 5 shows the hourly variation for the same measurements.
Probability of exceeding specific attenuation: The depths of selected fades over the twenty months are presented in detail to highlight the severity of rain-induced attenuation encountered in tropical region. Investigation results are presented below by the probability of exceeding a specific threshold of attenuation level statistics. The outcomes that are presented through this type of statistics were derived from the cumulative distribution of attenuation. The results are more suitable for the presentation of diurnal effects than the cumulative distribution of attenuation because comparisons between specific attenuation levels at a specific time interval are easier to observe.
Figure 6 presented the probabilities that a specific attenuation level such as 5, 10, 15, 20, 25, 30, 35 and 40 dB are exceeded. The respective probability was denoted in the process of revealing and determining the monthly or seasonal and detailed diurnal variations. The statistics for selected rain induced attenuation fades for twenty consecutive months are shown in Fig. 6. Figure 6 is the presentation of monthly variations.
From Fig. 6, it can be observed that probabilities of getting denoted attenuation levels are higher in the month of October 1999 therefore confirming the existence of
‘worst month’ of attenuation. On the other hand, denoted attenuation levels can be observed with extremely low values in the month of September 1999, justifying the month as ‘best’ month’. This is the month experiencing very limited rain induced attenuation with zero probability of getting attenuation level exceeding 20 dB.
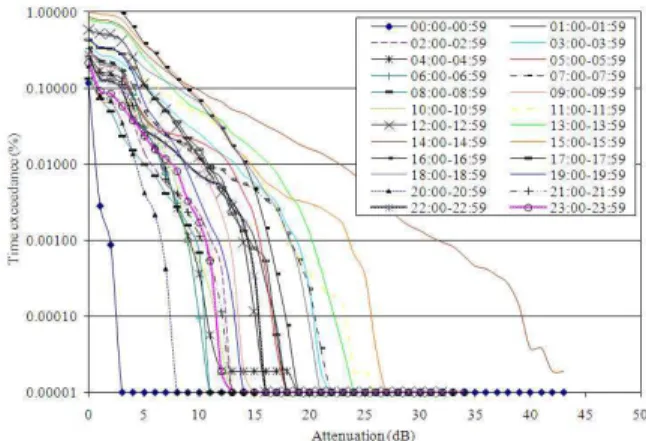
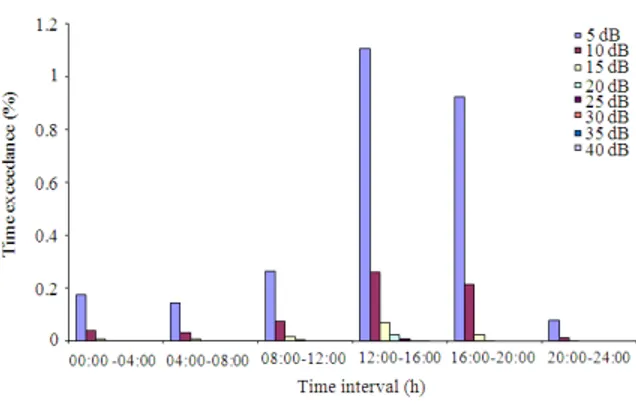
Figure 7 on the other hand is the histograms for the percentage time exceedance of specific attenuation of 5, 10, 15, 20 25, 30, 35 and 40 dB for diurnal characteristics. Figure 8 shows the corresponding probability of exceeding specific attenuation level with respect to diurnal variations for whole period of measurements.
The resolution concerned in the analysis is a 4 h time interval such as there are 6 measured values for a day. Probability of getting specific threshold of attenuation 10 dB and above level detected is at value of extremely low. Probability of exceeding specific threshold of attenuation levels denoted perceived in general depended on actual time of the day. It can be concluded that the probabilities are smallest during the first half of the day and largest in the sec half. Probability of exceeding higher attenuation level reveals even stronger diurnal variations with large peaks in the late afternoon and early evening hours.
Fig. 5: Hourly variation of beacon attenuation
Fig. 7: Histogram of specific threshold of attenuation is exceeded diurnally (Badron et al., 2010)
Fig. 8: Probability of specific threshold of attenuation is exceeded
The specific attenuation level even at 5 dB is strongly subjected to diurnal variation. In other words, it can be assume that rain induced attenuations lower than that of 5dB are typically due to normal rainfalls as opposed to heavy rainfalls. Heavy rainfalls are rainfalls that typically take place during thunderstorms. Note was also made where normal rainfall may be seen as being independent of the time of the day, where heavy rainfalls (thunderstorms) are most likely to occur in the evening hours (Ismail and Watson, 2000). Furthermore, normal rainfall usually lasts considerably longer than heavy rainfall. Thus normal rainfall contributes much more to the probability of exceeding 5 dB than thunderstorm rainfall.
CONCLUSION
Fade characteristics of V-band frequency link in a tropical country are presented. These introductory results are fundamental in developing the best fade mitigation technique for the future satellite to Earth link in the tropics. The diurnal variability of signal loss due to rain can be the basis for both the determination of link availabilities and the development of novel fade
countermeasures in reducing communication link outages. Fade mitigation techniques that incorporate modulation selections or forward error correction coding for upcoming satellite communications can be very much dependable on information relating to fade dynamics and long-term fade occurrence statistics.
ACKNOWLEDGEMENT
The studies are part of contributions to Malaysian Communication and Multimedia Commission (MCMC) of Malaysian Government in a spectrum research project entitled “Issues on Reliable Communications at Frequency Bands above 25 GHz in the Tropics”; a collaboration project between International Islamic University (IIUM), University Putra Malaysia (UPM), University Technology Malaysia (UTM) and University Sains Malaysia (USM).
REFERENCES
Badron, K., A.F. Ismail, J. Din and A.R. Tharek, 2009. Rain induced attenuation studies for V-band frequency in tropical regions. Proceeding of the Antennas and Propagation Conference, Nov. 16-17, IEEE Xplore Press, Loughborough, pp: 689-692. DOI: 10.1109/LAPC.2009.5352470
Badron, K., A.F. Ismail, M.R. Islam, K. Abdullah and J. Din et al., 2010. Rain fade characteristics analyses for V-band link in tropical region. Proceeding of the International Conference on Microwave and Millimeter Wave Technology, May 8-11, IEEE Xplore Press, Chengdu, China, pp: 121-124. DOI: 10.1109/ICMMT.2010.5525273 Brussaard, G. and P.A. Watson, 1995. Atmospheric Modeling and Millimeter Wave Propagation. 1st Edn., Springer, London, ISBN: 10: 0412562308, pp: 368.
Fiebig, U.C. and C. Riva, 2004. Impact of seasonal and diurnal variations on satellite system design in V band. IEEE Trans. Antenn. Propag., 52: 923-932. DOI: 10.1109/TAP.2004.825650
Garcia del Pino, P., J.M. Riera and A. Benarroch, 2006. Dynamic characteristics of fading on a 50 GHz slant path. Proceeding of the 1st European Conference on Antennas and Propagation, Nov. 6-10, IEEE Xplore Press, Nice, pp: 1-6. DOI: 10.1109/EUCAP.2006.4584795
ISH, 2005. ITU-R P.1623-1 prediction method of fade dynamics on earth-space paths. ITU. http://electronics.ihs.com/document/abstract/PCDS HBAAAAAAAAAA
Omotosho, T.V. and C.O. Oluwafemi, 2009. Impairment of radio wave signal by rainfall on fixed satellite service on Earth-space path at 37 stations in Nigeria. J. Atmosph. Solar-Terrest.
Phys., 71: 830-840. DOI:
10.1016/j.jastp.2009.03.016
Panagopoulos, A.D., P.D.M. Arapoglou and P.G. Cottis, 2004. Satellite communications at KU, KA and V bands: Propagation impairments and mitigation techniques. Commun. Surveys Tutor., IEEE, 6: 2-14. DOI: 10.1109/COMST.2004.5342290
Pontes, M.S., L. da Silva Mello, R.S.L de Souza and E.C.B. Miranda, 2005. Review of rain attenuation studies in tropical and equatorial regions in Brazil. Proceeding of the 5th International Conference on Information, Communications and Signal Processing, (ICSP’05), IEEE Xplore Press,
Bangkok, pp: 1097-1101. DOI: