1National Institute for Space Research – INPE, São José dos Campos (SP), Brazil. E-mails: [email protected]; [email protected], [email protected],
[email protected], [email protected] *Corresponding author.
Manuscript ID: 20170006. Received in: 01/16/2017. Approved in: 04/18/2017.
This work was supported by the [FAPESP – Foundation for Research Support of the State of São Paulo] under Grant [number 2010/51267‑9]. ABSTRACT: Carajás Mineral Province, Amazon region, is the most
important one in Brazil. Vale S.A. Company has the right to operate in the area of the N5E mine. he work is conducted on rock alter-ation products of low geomechanical quality related to sandstones, siltstones, and a lateritic cover. In order to monitor ground defor-mation, 33 TerraSAR-X images covering the period of March 2012– April 2013 were used in the investigation. An interferometric syn-thetic aperture radar (InSAR) approach based on permanent scatterer interferometry (PSI) using an interferometric point target analysis algorithm was applied. Results demonstrated that most of the area was considered stable during the time span of the image acquisition. However, persistent scatterers (PSs) with high deformation rates were mapped over a landill probably related to settlements. To validate the PSI data, graphs were generated with the displaced information based on topographic measurements in the ield. he graphs showed that the surface deformations during TSX-1 runway coverage are within the miner’s safety threshold and do not present a risk of ma-jor problems. he PSI data provided a synoptic and detailed view of the deformation process that afects the mining complex without the need of ield campaign or instrumentation.
KEYWORDS: TerraSAR-X; interferometry; Amazon; deformation; radar.
RESUMO: A Província Mineral de Carajás, região amazônica, é a mais importante do Brasil. A Vale S.A. tem o direito de operar na área da mina N5E, que é conduzida em produtos de alteração de rochas de baixa qualidade geomecânica relacionados a arenitos, siltitos e uma co-bertura laterítica. Para monitorar a deformação do solo, foram utilizadas 33 imagens de TerraSAR-X cobrindo o período de março de 2012 a abril de 2013. Foi aplicada uma abordagem interferométrica de radar de abertura sintética (InSAR) baseada em interferometria de espalhadores persistentes (PSI) utilizando um algoritmo de análise de alvo pontual. Os resultados mostraram que a maior parte da área foi considerada es-tável durante o período de aquisição de imagens, entretanto os espalha-dores persistentes (PSs) com altas taxas de deformação foram mapeados em aterro, provavelmente relacionado a assentamentos. Para validar os dados PSI, foram gerados gráicos com os dados de deslocamento medidos em campo. Os gráicos mostraram que as deformações supericiais durante a cobertura das imagens TSX-1 estão conforme o limiar de segurança do minerador e não apresentam risco de problemas maiores. Os dados PSI forneceram uma visão sinóptica e detalhada do processo de deformação que afeta o complexo de mineração sem a necessidade de campanha de campo ou instrumentação.
PALAVRAS-CHAVE: TerraSAR-X; interferometria; Amazônia; deformação; radar.
Application of persistent scatterers
interferometry for surface
displacements monitoring in N5E open
pit iron mine using TerraSAR‑X data,
in Carajás Province, Amazon region
Aplicação de interferometria por espalhadores
persistentes para monitoramento de deformações de
superfície na mina de ferro a céu aberto N5E utilizando
dados TerraSAR-X, na Província Carajás, região amazônica
Filipe Altoé Temporim1*, Fábio Furlan Gama1, José Cláudio Mura1,
Waldir Renato Paradella1, Guilherme Gregório Silva1
INTRODUCTION
he Brazilian mining industry is very diverse, with at least 55 mineral commodities currently explored in the coun-try (DNPM 2015). he Mining Production Index (MPI), which measures the change in the quantity produced, grew 15.5% in the irst half of 2015, if compared to the same period in the previous year. his performance was achieved mainly due to increased amounts of copper, manganese and iron (DNPM 2015).
Operations in open pit mines normally occupy large areas, including adjacent land portions of the pit. According to Stacey and Read (2009), instabilities can occur in these areas due to the mass movement of rocks and soils, steep slope of the mine stands, torrential rains and other fac-tors that occur at regular mining operations. his sce-nario becomes worse in the Amazon region due to deep excavation in soils and saprolites with low geomechani-cal quality along with blasting practices and intense pre-cipitation, with negative efects on the overall stability (Paradella et al. 2015).
According to Brito (2011), the main element of an open pit mine is the slope of benches. he geology of the deposit deines the area coverage and the depth of the mine pit, whereas the geotechnical characteristics deine the steep-ness that the ore can be excavated. Mining benches are designed with safety factors to control the risks to personnel and equipment from possible instabilities. However, due to its need to obtain the highest possible economic gains, the ore exploitation involves the inal slope increasingly steep by decreasing the removal of waste material. Taking these aspects, the surface deformation on information and slope stability are important items in the mining industry, for legal reasons, security, planning and production.
Currently, the most commonly used ield surface dis-placement monitoring methods are optical leveling, total station relective prisms or Global Positioning System (GPS) (Vaziri,Moore and Ali 2010). hese types of survey provide updated information with sub-millimetric to centimetric resolution from localized areas. However, radar imaging systems based on Synthetic Aperture Radar (SAR) are capa-ble of operating in all weather conditions and collect data, both during the day and at night, particularly orbital sys-tems, which provide a synoptic vision of the area without the need for ground instrumentation and ield campaigns (Ng
et al. 2011). he integration of SAR imaging techniques, geographic information systems (GIS) and geotechnical measurements to monitor surface subsidence induced by mining as a complementary tool to traditional survey meth-ods was discussed by Ge,Chang and Rizos (2007) and Ng
et al. (2009). An integration of SAR techniques to monitor
distinct displacements regimes (small to high deformation rates) was proposed by Paradella et al. (2015).
he interferometry technique using Synthetic Aperture Radar (InSAR) is based on a combination of two SAR complex images (SLC) acquired over the same area with a somewhat diferent acquisition geometries to ensure a phase diference (interference) between the scenes (Zebker and Villasenor, 1992). With this approach, it is possible to extract surface displacement along the Line of Sight (LoS) of the SAR for common pixels in the same position on the ground. However, this technique is only possible in areas with good interferometric coherence spatially distributed (as low vegetated terrain).
he technique of Permanent Scatterer Interferometry (PSInSAR) was proposed by Ferretti, Prati and Rocca (2000) and deals with the identiication and monitoring of a point-wise persistent scatter (PS), pixels that show stable amplitude and coherent phase throughout a tem-poral sequence of images. PS have stable backscatter like structures built by man (street poles, transmission towers, buildings, bridges, exposed pipelines, roof, objects that are associated with dihedral of trihedrons responses) and nat-ural targets (rock outcrops, soils and not vegetated surfaces etc.). A minimum of 15 images (stack) is used, and the accuracy of the deformation detected in this time series is of the order of a few millimeters per year on the imaging LoS. Current studies demonstrate the efectiveness of this tech-nique when applied to the monitoring of surface deforma-tion, as present by Gama et al. (2013), Pinto et al. (2015), and Costantini et al. (2016). In this paper, we present the results of the application of interferometry persistent scat-terer (PSI) for surface displacement mapping in N5E iron mine, using TerraSAR-X (TSX-1) data.
STUDY AREA
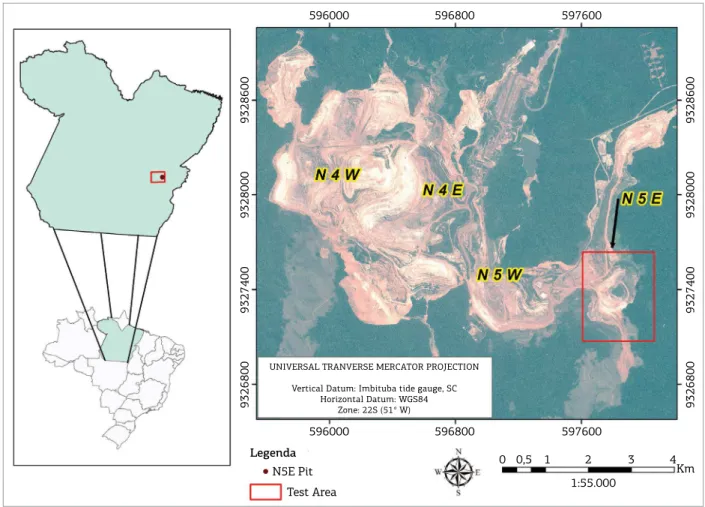
he Carajás Mineral Province (CMP) is the most import-ant of Brazil and includes the largest iron deposits in the world; it is located on the eastern border of the Amazon, in the state of Pará. It covers an area of 120,000 km2 and
is one of the four active mines, located on the easternmost part of the N5 iron ore, as shown in Figure 1.
he CMP is considered the largest one in Brazil and includes signiicant iron deposits (e.g., N4, N5), Cu (e.g., Salobo, Sossego, Serra Verde), Au (e.g., Serra Pelada), Mn (e.g., Azul, Buritirama) and Ni (e.g., Vermelho, Onça Puma). he CMP is part of an Archean block (> 2.5 Ga) in the southeastern portion of the Amazonian Craton. Its northern domain corresponds to the Carajás rift afected by the E–W trending Archean Itacaiunas Shear Belt (ISB). he ISB is characterized by two lithostructural domains: a set of imbri-cated ductile oblique thrusts in the southern sector and two strike-slip systems (Carajás and Cinzento) in the northern sector, according to Holdsworth and Pinheiro (2000) and Veneziani, Santos and Paradella (2004). he Carajás strike-slip system is the largest fault system recognized within the ISB.
he N5E mine falls within the domain of Parauapebas and Carajás Formations (Beisiegel et al. 1973, Meireles et al. 1984). Parauapebas Formation consists of metavolcanic rocks (metabasalts and metadiabases) with a high degree of weathering, forming clayey to earthy saprolite packages.
In the ield nomenclature, they were diferentiated into “Weathered Maic” (WM), “Semiweathered Maic” (SWM) and “Unweathered Maic” (UM), and include the iron for-mations in the south, north, east and west portions of the mine. he rocks show features of ductile and brittle defor-mations (shear event).
he ironstones of the Carajás Formation are character-ized by hematites (HM). hey are distinguished by bodies of soft hematite (laminated and powdery hematite); as well as by outcrops of hard hematite (HD) with plates of com-pact hematite with 5 cm thickness, interleaved with soft hematite (SH), and low content iron ore. In the study area, HD occurs in the central portion, while SH crops out as small lenses in the northwest portion of the mine oriented to NE-SW and NW-SE, which are the main shear direc-tions. hese units are covered by layered iron duricrusts and lateritic soils. he ore duricrust (OD) is character-ized by having high iron content and consists of hematitic blocks cemented by hydrated iron oxide. Chemical duric-rust (QD) has low iron content and is normally overlying maic rocks cemented by goethite. Finally, basic dykes and
Figure 1. Location of the study area (N5E mine).
596000
9326800
9327400
9328000
9328600
9326800
9327400
9328000
9328600
596800
596800 596000
N5E Pit
Test Area
0 0,5 1 2 3 4
Km 1:55.000
Legenda
597600 597600
UNIVERSAL TRANVERSE MERCATOR PROJECTION
Vertical Datum: Imbituba tide gauge, SC Horizontal Datum: WGS84
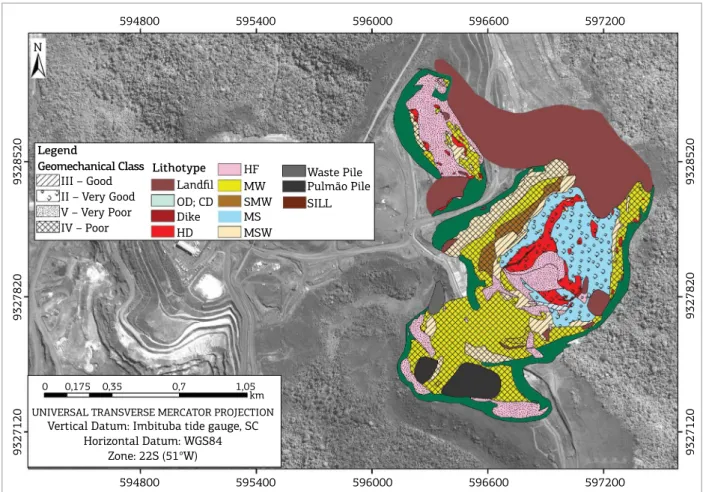
sills afected by low metamorphic grade are also mapped. he most detailed available account of the geological and geomechanical information for the N5E mine was produced by BVP Engineering (BVP 2011), including surface outcrop mapping at a 1:2000 scale, presented in Figure 2.
DATASET
A stack with 33 TSX-1 StripMap images acquired during March 20, 2012 until April 07, 2013 was used in this paper. he single look complex (SLC) images were acquired under ascending passes (look azimuth 78 deg), incidence angle range of 39.89 to 42.21 deg, spatial resolution of 1.7 × 3.49 m (rg × az), pixel spacing of 1.36 × 1.90 m (rg × az), and width swath of 30 km. In order to minimize the topography phase error in the interferometric process, a high-resolution digi-tal elevation model (DEM) was produced from a panchro-matic GeoEye-1 stereo-pair acquired over the study area on July 1, 2012, with a vertical accuracy of 1.5 m (Paradella and Cheng, 2013).
METHODOLOGICAL APPROACH
he pluviometric record during the TSX-1 passes was provided by the Vale S.A company. It indicated a total of 3,149 mm for cumulative precipitation. he dry season encompassed the interval from the end of March 2012 up to the beginning of October 2012, whereas the rainy season covered the period from October 2012 up to April 2013. Taking into account these values and the probable inluence of rainfall in the SAR coherence, the PSI analysis was con-ducted in two stages: a irst step using the irst 19 TSX-1 images related to the dry season (March 20 to October 4, 2012); and a second step based on the last 15 TSX-1 scenes covering the wet season (October 4, 2012 to April 20, 2013).
he PSI technique is based on a series of diferential inter-ferograms, in which it is sought to identify spreaders targets whose dispersion properties vary little with time and angle of view, allowing a temporal analysis of the interferometric phase of individual points. Besides, it provides precise infor-mation related to the displacements of the surface in ques-tion. hese highly coherent targets, PSs, identiied in multiple
Figure 2. Lithological and geomechanical units in N5E mine.
Acronyms: OD: ore duricrust; CD: chemical duricrust; HD: hard hematite; HF: lamellar hematite; MW: mafic weathered; SMW: superior mafic weathered; IMW: inferior mafic weathered; MSW: mafic semiweathered; MS: mafic shan.
9327120
9327820
9328520
9327120
9327820
9328520
594800 595400 596000 596600 597200
594800
Legend
N
Geomechanical Class
UNIVERSAL TRANSVERSE MERCATOR PROJECTION
Vertical Datum: Imbituba tide gauge, SC Horizontal Datum: WGS84
Zone: 22S (51°W)
0 0,175 0,35 0,7 1,05
km
595400 596000 596600 597200
III – Good II – Very Good V – Very Poor IV – Poor
Lithotype Landfil
OD; CD Dike HD
MW HF
SMW
Pulmão Pile Waste Pile
SILL MS
interferograms, allow to minimize and solve some of the prob-lems related to the processing and the phase unwrapping, as well as a better discretization of the signals that occur in the interferometric phase, in addition to allowing the estimation and removal of orbital errors, and topography phase, deforma-tion and atmosphere efects of the interferogram phase values, through their diferent behaviors in time and space (Ferretti, Prati and Rocca2001, Werner et al. 2003; Hooper et al. 2004).
he Interferometric Point Target Analysis (IPTA), imple-mentation of the PSI at the Gamma Remote Sensing software (Werner et al. 2003), was used to estimate the deformation vector (Ødef) of each PS point, represented in equation Eq. 1, and con-sists in exploring some characteristics of the phase components, aiming at the separation or attenuation of each one of them.
DØPSj = ØPSj_def + Øpsj_eh + ØPSj_atm + ØPSj_noise
DØj,1 = Ødef_1 + Øeh_1 + Øatm_1 + Ønoise_1
DØj,2 = Ødef_2 + Øeh_2 + Øatm_2 + Ønoise_2
DØj,M = Ødef_M + Øeh_M + Øatm_1M + Ønoise_M
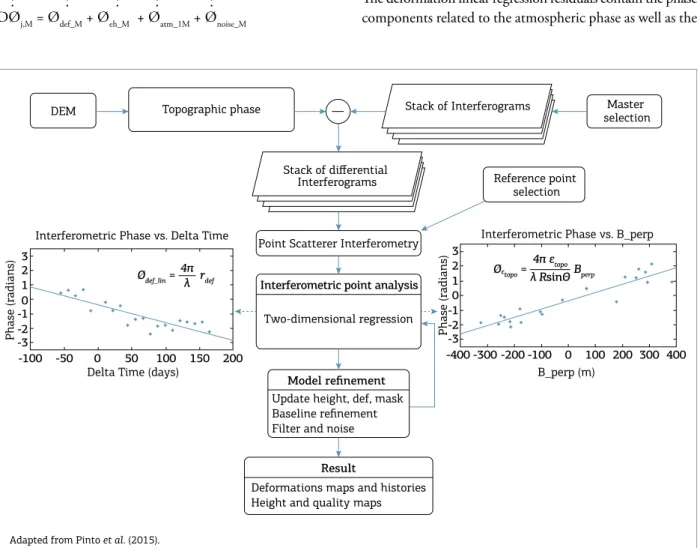
he processing initially consisted in generating a stack of images registered in the SLC format, for the construction of interferometric pairs. As shown in Figure 3, in the PSI approach a reference image (master image) was selected for the construction of interferometric pairs. his image was chosen based on a coniguration that presents low perpen-dicular baseline diversity values and close to the temporal center of the image sequence, to ensure good interferometric coherence between the pairs. Following the processing, the phases corresponding to the topography extracted from the DEM were subtracted from the interferogram stack, result-ing in a new stack of diferential interferograms in relation to a selected stable reference point in the image coverage area. An important step in the PSI methodology is the iden-tiication of the persistent return points, which consists of consistent and stable point locations over a long period of time to allow the historical analysis of the phase.
he IPTA software is based on a two-dimensional regres-sion model, since there is a linear dependence of the topo-graphic phase with the perpendicular baseline, and also a linear dependence of the deformation with time is assumed. he deformation linear regression residuals contain the phase components related to the atmospheric phase as well as the
Figure 3. Flowchart of the IPTA processing. Adapted from Pinto et al. (2015).
Stack of Interferograms
Stack of differential Interferograms
Master
selection
Reference point
selection
Point Scatterer Interferometry Interferometric Phase vs. B_perp
Interferometric point analysis
Two-dimensional regression
Result
Deformations maps and histories
Height and quality maps Model reinement
Update height, def, mask
Baseline refinement Filter and noise
B_perp (m)
Interferometric Phase vs. Delta Time
Delta Time (days)
-100 -400
-3 -2 -1 0 1 2 3
-300 -200 -100 0 100 200 300 400
Phase (radians)-3-2 Phase (radians)
-1 0 1 2 3
-50 0 50 100 150 200
Ødef_lin = 4π rdef
λ
Øεtopo = Bperp 4π εtopo
λ RsinΘ
phase components related to the nonlinear deformations and noise. hese residues are spatially iltered to minimize the atmospheric phase as well as the phase noise, enabling the recovery of the phase component related to the nonlin-ear deformation. he PSI analysis is performed for all per-sistent return points, allowing the generation of a deforma-tion map of the work area, as well as a map of the quality of each analyzed point.
RESULTS AND DISCUSSIONS
Surface deformations at each PS position were expressed in terms of displacement rate and PSs were detected in relation to a reference point (coordinate 596148,449E; 9328050,899N of the World Geodetic System 84). he pos-itive values, which correspond to the cold colors, indicate movement towards the satellite (uplift), while the negative values, pertaining to the warm colors, indicate the move-ment away from the satellite (subsidence).
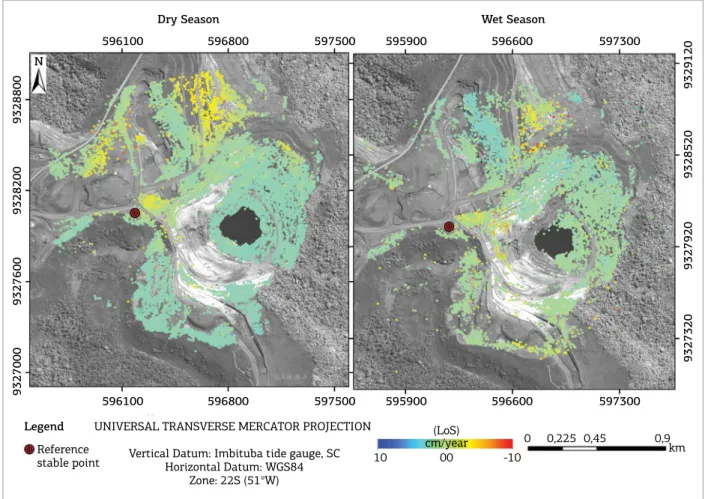
he IPTA analysis for the dry season allowed the detec-tion of 24,466 PSs in an area of 12.6 km2, with an average
density of ~ 1.942 PS/km2. he use of the data stack for
the wet season allowed the detection of 14,297 PSs, with an average density of ~ 1.135 PS/km2. he deformation
maps for both periods can be seen in Figure 4. here is a large diference in the number of points in relation to the two sets of images, due to the amount of rain in the wet season, which increases the temporal decorrelation due to the alteration of the dielectric constant of the targets, reduc-ing the interferometric coherence. he PSs distribution was not homogeneous, since there was no PSs in vegetation areas (low coherence), while detection was very good in the mining areas (including the pit, processing facilities and related mining infrastructures). he IPTA results provided a synoptic view of the ongoing deformation process in the mining area and showed that most of the investigated site was stable during the TSX-1 coverage period (yellow-green regions in the maps of Fig. 4). he coherence loss of these sites can be caused by:
Figure 4. Spatial distribution of persistent scatterers (PS) for N5E mine, visualized by the average line of sight (LoS) velocity on the panchromatic GeoEye-1 scene for dry and wet seasons. The reference stable point is shown in both set of images.
Dry Season Wet Season
596100
N
9327000
9327320
9327920
9328520
9329120
9327600
9328200
9328800
596800 597500 595900 596600 597300
596100 596800 597500 595900 596600 597300
UNIVERSAL TRANSVERSE MERCATOR PROJECTION
Vertical Datum: Imbituba tide gauge, SC Horizontal Datum: WGS84
Zone: 22S (51°W) Reference
stable point
Legend (LoS)
cm/year
10 -10
0 0,225 0,45 0,9
■ intense surface movement due to the mining processes; ■ deformation occurring at a very high rate, beyond the sensitivity limit of the technique that is λ/4 (λ equals to 3,1 cm);
■ inluence of precipitation, particularly in the rainy sea-son, with a change in backscattering characteristics.
For the areas around the mines, the lack of coherence is mainly associated with the presence of vegetation.
The accumulated values obtained in LoS that express subsidence are within the limits expected for an open pit operation of this size. The highest subsidence dis-placement values were identified north of the pit, in an area geologically mapped as a landfill, which justifies a greater displacement due to material accommodation over time. The maximum values of displacement rate at the landfill reached -94.92 mm during the dry season (March 20, 2012 until October 4, 2012) and -118.76 mm for the rainy season (October 4, 2012 until April 20, 2013). These values were negative, corresponding to the reddish spots in Figure 4, and therefore are indica-tive of subsidence. However, it is important to mention
that, for the landfill, displacement with positive value expressing motion toward the satellite characterized by bulging at the dump toe indicative of terrain instabili-ties was not detected.
here is a general absence of PSs on the benches of the pit on the left side, as this synthetic structure underwent intense surface changes due to the ongoing mining oper-ation, expressed by the low coherence. Another import-ant fact that may be responsible by this lack of PSs at this site in both set of images is the geomechanical quality of local rocks, which is usually classiied as “poor” and “very poor”, which can also explain the low coherence (as shown in Fig. 5).
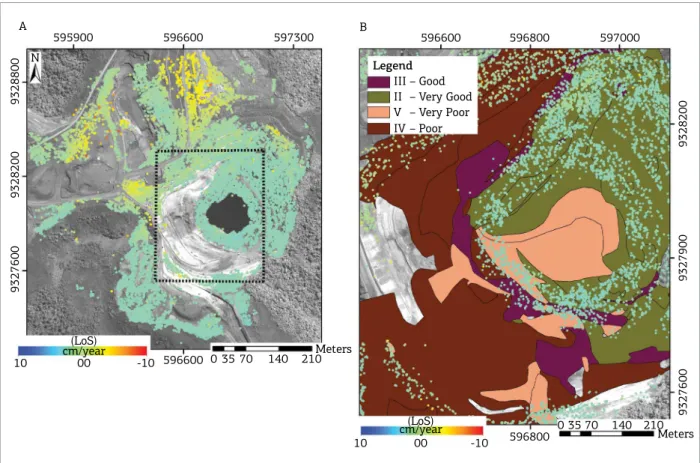
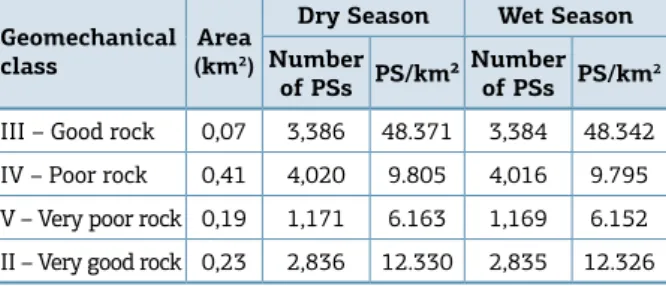
In the GIS environment, using ArcGIS software, the IPTA information and geomechanical map for N5E mine were compared in order to explore spatial relationships. Table 1 shows that the highest amount of PS was associated with the geomechanical classes of the largest areas, but not necessarily with the highest densities (class II). he highest density of points is class III (good rock), which is related to regions with less intense exploration activities. he regions with more intense exploration activities (classes IV and V)
Figure 5. (A) Spatial distribution of persistent scatterers (PSs) for N5E mine, visualized by the average line of sight (LoS) velocity on the panchromatic GeoEye-1 for the dry season; (B) geomechanical map under the PSs on the panchromatic GeoEye-1.
A
N
595900
9327600
9328200
9328800
596600 597300
(LoS) cm/year
10 00 -10 0 35 70 140 210
Meters 596600
596600 596800
596800
597000
9328200
9327900
9327600
10 00 -10
(LoS)
cm/year 0 35 70 140 210Meters
III – Good
Legend
presented lower density of points, both for the dry sea-son and for the set of images of the wet seasea-son. his can be explained due to the fact these areas present a greater removal of material, causing a greater temporal uncorrela-tion between the images and, consequently, decreasing the interferometric coherence.
In an attempt to validate the diferential SAR inter-ferometry (DInSAR) time-series results restricted to the monitoring of the benches with ield surface displacements,
topographic measurements were also used. Geotechnical ield measurements were available based on seven relective prisms located on the east side of the benches (Fig. 6A, B). N5E mine is not commonly afected by intense mining activity as the remainder N4W, N4E and N5W mines. herefore, the removal of material is done sporadically, so the extracted ore is blending with the material removed from other mines of the CMP. Due to this reason, the slopes of the eastern region present an apparent stability with green-ish colors in the processing of IPTA, both for dry season and for rainy season.
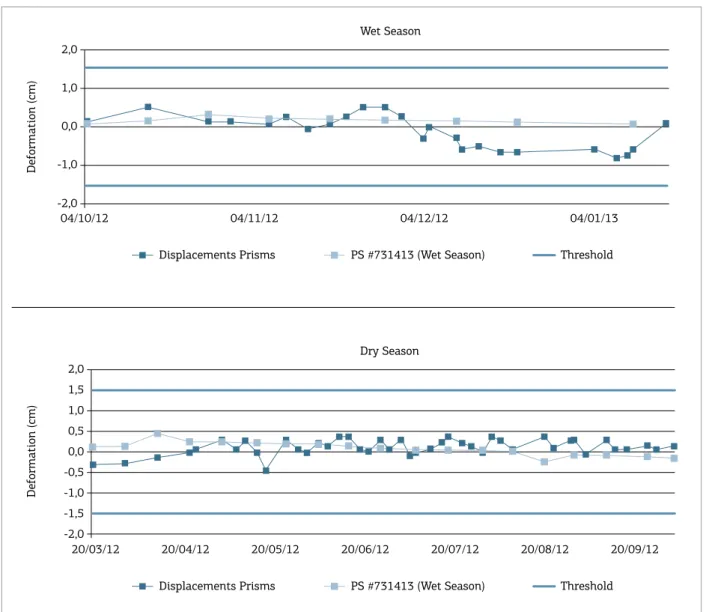
In order to explore the relations of displacements and to validate the data generated by IPTA, two graphs (Fig. 7) were generated with the displacement data of the topographic measurement (total station and relective prisms) and IPTA. Considering that measurements with satellite radar (TSX-1) and topographic data have diferent line of sight (LoS) monitoring, the prism vertical values were projected along the satellite LoS by multiplying these values by the cosine of the incidence angle. he ield measurement chosen for the validation in this paper was referent to prism # 3 (Fig. 6B) Geomechanical
class
Area (km2)
Dry Season Wet Season
Number of PSs PS/km²
Number of PSs PS/km2 III – Good rock 0,07 3,386 48.371 3,384 48.342 IV – Poor rock 0,41 4,020 9.805 4,016 9.795 V – Very poor rock 0,19 1,171 6.163 1,169 6.152 II – Very good rock 0,23 2,836 12.330 2,835 12.326 Table 1. Relationship between persistent scatterers (PS) and geomechanical classes for N5E mine.
Figure 6. (A) Spatial distribution of persistent scatterers (PSs) for N5E mine, visualized by the average line of sight (LoS) velocity on the panchromatic GeoEye-1 for the dry season; (B) seven prisms on the panchromatic GeoEye-1.
A
N
596100 596800
9327600
9328200
9328800
596800 (LoS)
cm/year 00
10 -10
0 0,10,2 0,4 0,6km
0 0,1 0,2 0,4 0,6
km
597110
Legend
Prisms Location
597200 597290
6 4 1
2
5
3 7
597200
9327920
9327820
9327720
597290 (LoS)
cm/year 00
10 -10
012,525 50 Meters75 B
0 12,5 25 50 75
and the correspondent PS was # 73143, both with the same geographical coordinates (597244,25E; 9327793,943N). he Vale S.A company that owns the mining right of the CMP deines as a safety threshold values of vertical dis-placement within +/- 2 cm for ield measurement along the walls of the pit benches. hat is, displacements greater than this threshold pose a risk for operation. he threshold was projected along the satellite LoS by multiplying these values by the cosine of the incidence angle, resulting in +/- 1,53 cm. he graphs show that, for both the dry season and the rainy season, the deformations on the surface measured by PS, during TSX-1 passage coverage, are within the miner’s safety threshold and do not pose a risk of major problems. According to Vale’s geotechnical team, the highest defor-mation value measured by the topographic surveying was
-0.956 cm, which is considered a normal subsidence value for an active open pit.
his stability is due to the fact that N5E is not very active comparing with the other mines of the CMP (N5W, N4E, N4W), as was previously mentioned, mainly in the eastern portion of the pit, where the prisms were located, as shown in Figure 6B. he PS is located in a geologically mapped location as OD (Fig. 8), that covers iron ore and is formed by blocks of hematite (hard and semi-hard) cemented by hydrated oxides of iron. his type of rock is very hard, that is why it is normally expected there not to be large deformations on its surface. Unlike locations mapped as a landill, which, as previously mentioned, is the lithology with the greatest deformations, due to the accommodation of material.
Figure 7. Temporal evolution of the LoS-projected deformation for the PS # 731413, ield displacements (prism # 3)
covering dry and wet seasons and mining company security threshold.
Wet Season 2,0
1,0
0,0
-1,0
-2,0
04/10/12 04/11/12 04/12/12 04/01/13
Def
ormation (cm)
Displacements Prisms PS #731413 (Wet Season) Threshold
Dry Season 2,0
1,5
1,0
0,5
0,0
-0,5
-1,0
-1,5
-2,0
20/03/12 20/04/12 20/05/12 20/06/12 20/07/12 20/08/12 20/09/12
Def
ormation (cm)
CONCLUSIONS
he IPTA results showed that most of the mining area was stable during the TSX-1 coverage period, according the validation carried out using topographic surveying (total station and relecting prisms).
he validation analysis during both dry and rainy sea-son pointed out that the surface deformations during TSX-1 runway coverage are within the miner’s safety threshold and do not present a risk of major problems.
he highest soil displacement values indicative of sub-sidence were measured in a landill in the northern part of the pit and were interpreted as expected settlements, without additional evidence major terrain instability. he IPTA infor-mation and geomechanical map of the N5E mine were com-pared to explore spatial relationships. he highest density of points was related to Class III (good rock), which refers to less intense areas of exploitation activities. he region with more
intense mining activities (Classes IV and V) presented lower density of points due to a decrease interferometric coherence.
he PSI data provided a synoptic and detailed view of the deformation process that afects the mining complex with-out the need of ield campaign or instrumentation. he PSI approach, providing data with high displacement accuracy over a dense grid and large area, can be used for long-term operational monitoring planning and predictive solutions for mining operations and risk assessment. Since the space-based DInSAR information is not a real time approach, a complementary use of ield monitoring systems is funda-mental from an operational perspective.
ACKNOWLEDGMENTS
he authors would like to thank São Paulo Research Foundation (FAPESP) (Grant # 2010/51267-9), and Figure 8. (A) Spatial distribution of persistent scatterers (PS) for N5E mine, visualized by the average line of sight (LoS) velocity on the panchromatic GeoEye-1 for the dry season; (B) geological map under the PS on the panchromatic GeoEye-1.
Acronyms: OD: ore duricrust; CD: chemical duricrust; HD: hard hematite; MW: mafic weathered; MS: mafic shan.
B
(LoS) cm/year
00
10 -10
597200 597290
597290
9327720
9327820
Landfill
Displacement Point Legend
Lythotype
OD; CD
MS HD MW
5
0 10 20 30
Meters
596100 A
N
596800
596800 (LoS)
cm/year 00
10 -10
9327600
9328200
9328800
0,1
0 0,2 0,4 0,6
Beisiegel V.R., Bernardelli A.L., Drumond N.F., Ruf A.W., Tremaine J.W. 1973. Geology and Mineral Resources of Serra dos Carajás.
Brazilian Journal of Geosciences, 3:215‑242.
Brito S. 2011. The Slopes of Mining: Importance and Risks. Workshop
II: Geotechnics and Hydrogeology Applied to Mining. 14 Brazilian Congress of Mining.
BVP Engenharia. Lithostructural and Lithogeomechanical Mapping of N5E Mine. VL 070‑10‑E‑CA‑RT‑03‑102‑00. Internal Vale Report. October 2011, 76 p.
Costantini F., Mouratidis A., Schiavon G., Sarti, F. 2016. Advanced InSAR techniques for deformation studies and for simulating the PS assisted calibration procedure of Sentinel‑1 data: case study from Thessaloniki (Greece), based on the Envisat/ASAR archive.
International Journal of Remote Sensing,37:729‑744.
DNPM – National Department of Mineral Production. Mineral Report. Jan/Jun 2015.
Ferretti A., Prati C., Rocca F. 2000. Nonlinear Subsidence Rate Estimation Using Permanent Scatterers in Diferential SAR Interferometry. IEEE Transactions on Geoscience and Remote Sensing,38:2202‑2212. doi:10.1109/36.868878.
Ferretti A., Prati C., Rocca F. 2001. Permanent Scatterers in SAR Interferometry. IEEE Transactions on Geoscience and Remote Sensing,39:8‑20. doi:10.1109/36.898661.
Gama F.F., Paradella W.R., Mura J.C., Santos A.R. 2013. Técnicas de interferometria radar na detecção de deformação supericial utilizando dados orbitais. XVI Brazilian Symposium on Remote Sensing. Foz do Iguaçu. v. 1. p. 8405‑8812.
Ge L., Chang H., Rizos C. 2007. Mine subsidence monitoring using multi‑source satellite SAR images. Photogrammetric Engineering and Remote Sensing,73:259‑266.
Holdsworth R., Pinheiro R.V.L. 2000. The anatomy of shallow‑crustal transpressional structures: insights from the Archean Carajás Fault Zone, Amazon, Brazil. Journal of Structural Geology,22:1105‑1123. Hooper A., Zebker H., Segall P., Kampes B. 2004. A New Method for Measuring Deformation on Volcanoes and Other Natural Terrains Using Insar Persistent Scatterers. Geophys Researcher Letters,
31:1‑5. doi: 10.1029/2004GL021737.
Meireles E.M., Hirata W.K., Amaral A.F., Medeiros Filho C.A., Gato W.C. 1984. Geology of Carajás and Rio Verde Folios, Carajás Mineral Province, State of Pará. 33 Brazilian Congress of Geology. Rio de Janeiro, p. 2164‑2174.
Ng A.H.M., Chang H.C., Ge L., Rizos C., Omura M. 2009. Assessment of radar interferometry performance for ground subsidence
REFERENCES
monitoring due to underground mining. Earths, Planets and Space,
61:733‑745.
Ng A.H.M, Ge L., Zhang K., Chang H.C., Li X., Rizos C., Omura, N. 2011. Deformation mapping in three dimensions for underground mining using InSAR – Southern highland coalield in New South Wales, Australia. International Journal of Remote Sensing,22:7227‑7256. doi: 10.1080/01431161.2010.519741
Paradella W.R., Cheng P. 2013. Using GeoEye‑1 Stereo Data in Mining Applications: Automatic DEM Generation. Geoinformatics, 16:10‑12.
Paradella W.R., Ferretti A., Mura J.C., Colombo D., Gama F.F., Tamburini A., Santos A.R. 2015. Mapping surface deformation in open pit iron mines of Carajás Province (Amazon Region) using an integrated SAR analysis. Engineering Geology,193:61‑78.
Paradella W.R., Silva M.F.F., Rosa N.A., Kushigbor C.A. 1994. A geobotanical approach to the tropical rain forest environment of the Carajás Mineral Province (Amazon region, Brazil) based on digital TM‑Landsat and DEM data. International Journal of Remote Sensing,
15:1633‑1648.
Pinto C.A., Paradella W.R., Mura J.C., Gama F.F., Santos A.R., Silva G.G., Hartwig M.E. 2015. Applying persistent scatterer interferometry for surface displacement mapping in the Azul open pit manganese mine (Amazon region) with TerraSAR‑X StripMap data. Journal of Applied Remote Sensing, 9:095978‑1‑095978‑18. doi: 10.1117/1.
JRS.9.095978.
Stacey P., Read J. 2009. Guidelines for Open Pit Slop Design. CSIRO publishing, Australia.
Vaziri A., Moore L., Ali H. 2010. Monitoring systems for warning impending failures in slopes and open pit mines. Natural Hazards,
55:510‑512.
Veneziani P., Santos A.R., Paradella W.R. 2004. A evolução tectono‑ estratigráica da Província Mineral de Carajás: um modelo com base em dados de sensores remotos orbitais (SAR‑C RADARSAT‑1, TM LANDSAT‑5), aerogeofísica e dados de campo. Brazilian Journal of Geoscience, 34:67‑78.
Werner C., Wegmuller U., Strozzi T., Wiesmann A. 2003. Interferometric point target analysis for deformation mapping. IEEE Geoscience and Remote Sensing Symposium. Toulouse,
7:4362‑4364.
Zebker H.A., Villasenor J. 1992. Decorrelation in interferometric
radar echoes. IEEE Transactions on Geoscience and Remote Sensing,
30:950‑959.
Available at www.sbgeo.org.br
the National Council for Scientific and Technological Development (CNPq) is also acknowledged for grants received by the irst and fourth authors during this inves-tigation. he authors are particularly grateful to the geo-technical Vale’s team from Carajás, particularly geologist