AMTD
7, 6971–7011, 2014Forecast indices from ground-based
microwave radiometer
D. Cimini et al.
Title Page
Abstract Introduction
Conclusions References
Tables Figures
◭ ◮
◭ ◮
Back Close
Full Screen / Esc
Printer-friendly Version Interactive Discussion
Discussion
P
a
per
|
Discus
sion
P
a
per
|
Discussion
P
a
per
|
Discussion
P
a
per
Atmos. Meas. Tech. Discuss., 7, 6971–7011, 2014 www.atmos-meas-tech-discuss.net/7/6971/2014/ doi:10.5194/amtd-7-6971-2014
© Author(s) 2014. CC Attribution 3.0 License.
This discussion paper is/has been under review for the journal Atmospheric Measurement Techniques (AMT). Please refer to the corresponding final paper in AMT if available.
Forecast indices from ground-based
microwave radiometer for operational
meteorology
D. Cimini1,2, M. Nelson3, J. Güldner4, and R. Ware3,5
1
CNR-IMAA, Potenza, Italy
2
CETEMPS, University of L’Aquila, L’Aquila, Italy
3
Radiometrics, Boulder, Colorado, USA
4
DWD, Meteorological Observatory Lindenberg, Lindenberg, Germany
5
UCAR, Boulder, Colorado, USA
Received: 20 June 2014 – Accepted: 30 June 2014 – Published: 14 July 2014 Correspondence to: D. Cimini ([email protected])
AMTD
7, 6971–7011, 2014Forecast indices from ground-based
microwave radiometer
D. Cimini et al.
Title Page
Abstract Introduction
Conclusions References
Tables Figures
◭ ◮
◭ ◮
Back Close
Full Screen / Esc
Printer-friendly Version Interactive Discussion
Discussion
P
a
per
|
Discus
sion
P
a
per
|
Discussion
P
a
per
|
Discussion
P
a
per
Abstract
Today, commercial microwave radiometers profilers (MWRP) are robust and unat-tended instruments providing real time accurate atmospheric observations at∼1 min temporal resolution under nearly all-weather conditions. Common commercial units operate in the 20–60 GHz frequency range and are able to retrieve profiles of
tempera-5
ture, vapour density, and relative humidity. Temperature and humidity profiles retrieved from MWRP data are used here to feed tools developed for processing radiosonde observations to obtain values of forecast indices (FI) commonly used in operational meteorology. The FI considered here includeK index, Total Totals, KO index, Showal-ter index, T1 Gust, Fog Threat, Lifted Index, S Index (STT), Jefferson Index, MDPI,
10
Thompson Index, TQ Index, and CAPE. Values of FI computed from radiosonde and MWRP-retrieved temperature and humidity profiles are compared in order to quanti-tatively demonstrate the level of agreement and the value of continuous FI updates. This analysis is repeated for two sites at midlatitude, the first one located at low alti-tude in Central Europe (Lindenberg, Germany), while the second one located at high
15
altitude in North America (Whistler, Canada). It is demonstrated that FI computed from MWRP well correlate with those computed from radiosondes, with the additional advan-tage of nearly continuous update. The accuracy of MWRP-derived FI is tested against radiosondes, taken as a reference, showing different performances depending upon index and environmental situation. Overall, FI computed from MWRP retrievals agree
20
well with radiosonde values, with correlation coefficients usually above 0.8 (with few exceptions). We conclude that MWRP retrievals can be used to produce meaningful FI, with the advantage (with respect to radiosondes) of nearly continuous update.
1 Introduction
Commercial microwave radiometers profilers (MWRP) are robust instruments
per-25
AMTD
7, 6971–7011, 2014Forecast indices from ground-based
microwave radiometer
D. Cimini et al.
Title Page
Abstract Introduction
Conclusions References
Tables Figures
◭ ◮
◭ ◮
Back Close
Full Screen / Esc
Printer-friendly Version Interactive Discussion
Discussion
P
a
per
|
Discus
sion
P
a
per
|
Discussion
P
a
per
|
Discussion
P
a
per
at ∼1 min temporal resolution under nearly all-weather conditions. MWRP perform measurement of thermal emission from downwelling brightness temperature (Tb) in the atmosphere. Most common commercial units operate in the 20–60 GHz frequency (0.5 to 1.5 cm wavelength) range, in which atmospheric thermal emission is influenced by atmospheric temperature, humidity and the presence of hydrometeors. From
cali-5
brated MWRP Tb, atmospheric thermodynamic profiles can be retrieved using a variety of inversion methods, as multivariate regression, neural networks, and variational ap-proaches (Solheim et al., 1998; Ware et al., 2003; Löhnert et al., 2004; Cimini et al., 2006, 2010) with an accuracy that is compatible with most of meteorology applications, especially in the lower troposphere (Güldner and Spänkuch, 2001; Hewison, 2007;
10
Cimini et al., 2011; Ware et al., 2013). Due to the increasing distribution, networks of MWRP are being established for climate and meteorology applications (Cadeddu et al., 2013; Cimini et al., 2014).
Currently operational radiosonde launches are normally performed twice daily by Na-tional and/or regional Weather Services (NWS) at hundreds of sites world wide.
Rela-15
tively few sites perform launches four times a day. Radiosondes are usually launched at synoptic hours (00:00–12:00 or 00:00–06:00–12:00–18:00 UTC) and the observed thermodynamic profiles are assimilated into Numerical Weather Prediction (NWP) model analysis. In addition, the same radiosonde observations are processed locally at NWS to compute forecast indices (FI) developed starting from some 60 years ago
20
(Showalter, 1947; Fawbush and Miller, 1954; Galway, 1956; George, 1960) which are still broadly used for operational meteorology and local short-term forecast (Anders-son et al., 1989; Haklander and Van Delden, 2003; Holtslag et al., 2010). Although the FI based on sounding observations are rather simple, they perform reasonably well, especially once optimized for site specific conditions, and show forecast skills that
of-25
AMTD
7, 6971–7011, 2014Forecast indices from ground-based
microwave radiometer
D. Cimini et al.
Title Page
Abstract Introduction
Conclusions References
Tables Figures
◭ ◮
◭ ◮
Back Close
Full Screen / Esc
Printer-friendly Version Interactive Discussion
Discussion
P
a
per
|
Discus
sion
P
a
per
|
Discussion
P
a
per
|
Discussion
P
a
per
retrievals (König, 2002; König and de Coning, 2009; de Coning et al., 2010). Though they are limited to clear sky conditions, satellite-based FI offer the advantage to cover large areas (at continental scale). On the other hand, satellite-based FI suffer from the lack of quality data in the boundary layer due to the low vertical resolution of satellite observations in the lower troposphere.
5
The US National Research Council (NRC) recently reported that continuous bound-ary layer temperature, humidity, and wind observations provide a practical and cost-effective means to improve local high-impact weather forecasting (NRC 2008, 2010). In fact, the structure and variability of the lower troposphere is currently not well known because vertical profiles of water vapor, temperature, and winds are not systematically
10
observed with sufficient spatial or temporal resolution. This lack of observations results in the planetary boundary layer being the single most important under-sampled part of the atmosphere. Consequently, short-term forecast skill may be poor due to a lack of pertinent data, particularly in the lower troposphere where severe weather originates.
Conversely, traditional FI developed for radiosondes can be generated from MWRP
15
retrievals continuously and under nearly all weather conditions. Temperature and hu-midity profiles are available from MWRP data at ∼1 min resolution. Note that most of the information content resides within the planetary boundary layer (Cimini et al., 2011, 2013) and that useful information is provided even under precipitation (Cimini et al., 2011; Xu et al., 2014). The high-temporal resolution MWRP retrievals have
re-20
cently been exploited in support of nowcasting low-level windshear at Hong Kong air-port (Chan and Lee, 2011), dynamic weather conditions in US (Knupp et al., 2009), and intense convective weather in Hong Kong (Chan and Hon, 2011) and South-east India (Madhulatha et al., 2013; Venkat Ratnam et al., 2013). A similar approach is reported by Feltz and Mecikalski (2002), though using a ground-based infrared interferometer.
25
AMTD
7, 6971–7011, 2014Forecast indices from ground-based
microwave radiometer
D. Cimini et al.
Title Page
Abstract Introduction
Conclusions References
Tables Figures
◭ ◮
◭ ◮
Back Close
Full Screen / Esc
Printer-friendly Version Interactive Discussion
Discussion
P
a
per
|
Discus
sion
P
a
per
|
Discussion
P
a
per
|
Discussion
P
a
per
Thus, the MWRP-retrieved profiles can be used to feed tools for computing FI devel-oped for radiosondes profiles, providing timely and continuous FI data. These timely FI data are particularly important for thunderstorm forecast in the 0 to 6 h range, as recently shown for two tropical sites (Chan, 2009; Chan and Hon, 2011; Madhulatha et al., 2013; Venkat Ratnam et al., 2013). In this paper we extend the application to
5
two sites at midlatitude and to few additional FI, demonstrating the ability of MWRP retrievals to provide quality FI similar to radiosonde, as well as the added value of continuous FI data.
This paper is organized as follows: Sect. 2 describes the data set under consid-eration, Sect. 3 summarizes the methodology used for data intercomparison, Sect. 4
10
reports the results of the data analysis. Section 5 summarises the results and draws final conclusions, suggesting possibilities for additional advancements and application of MWVR observations.
2 Data set
2.1 Radiosonde data
15
The radiosondes used in this analysis are Global Position System (GPS) enabled RS92-SGP systems, manufactured by Vaisala, providing vertical profiles of pressure, temperature, relative humidity, dew point temperature, and wind at 2 s resolution. These data are then used to calculate the dew-point temperature and the geopotential height according to hydrostatic equilibrium. Although depending upon sensor type,
radioson-20
des suffer of some error sources, including daytime solar radiation dry bias, horizon-tal drift, time lag and calibration errors at low temperatures. Nevertheless, radioson-des remain the de facto standard for upper air monitoring and presently provide the most widely available information on the vertical structure of the troposphere and lower stratosphere. For the type used during the experiment, the specifications for total
mea-25
AMTD
7, 6971–7011, 2014Forecast indices from ground-based
microwave radiometer
D. Cimini et al.
Title Page
Abstract Introduction
Conclusions References
Tables Figures
◭ ◮
◭ ◮
Back Close
Full Screen / Esc
Printer-friendly Version Interactive Discussion
Discussion
P
a
per
|
Discus
sion
P
a
per
|
Discussion
P
a
per
|
Discussion
P
a
per
5 % for relative humidity, and 0.2 m s−1 for wind speed (Vaisala, 2013). Four radioson-des per day were launched at standard synoptic hours (00:00, 06:00, 12:00, and 18:00 UTC) from the two sites considered in this study.
2.2 MWRP data
The MWRP data used in this analysis are provided by two MP-3000A units
manu-5
factured by Radiometrics. The MP-3000A units include a scanning multichannel mi-crowave radiometer, a one-channel broad-band infrared (IR) radiometer, and surface pressure, temperature, and humidity sensors. The MWRP IR radiometer (one channel covering approximately 9.6–11.5 µm) measures sky IR temperature and gives infor-mation on cloud-base temperature. The MWRP meteorology sensors measure
tem-10
perature (Ts), pressure (Ps), and relative humidity (RHs) at the instrument level. The multichannel microwave radiometer can observe Tb at up to 35 channels in the 20– 60 GHz frequency (0.5 to 1.5 cm wavelength). In this frequency range, atmospheric thermal emission comes from atmospheric gases (primarily oxygen and water vapour) and hydrometeors (mainly liquid water particles, since ice emission is negligible). The
15
Rayleigh scattering regime applies up to sizes of small raindrops and in general the scattering contribution is negligible up to light precipitation.
When properly calibrated, a MWRP provides Tb with an absolute accuracy of∼0.3– 0.7 K (Cimini et al., 2003; Löhnert and Maier, 2012; Maschwitz et al., 2013). Atmo-spheric temperature and humidity profiles can be retrieved from MWRP Tb with a
va-20
riety of inversion methods, including multivariate regression, neural networks, and variational approaches (Solheim et al., 1998; Löhnert et al., 2004; Hewison, 2007; Cimini et al., 2006, 2010). Typical root-mean-square accuracy for tropospheric tem-perature and absolute humidity profiles during non-precipitating conditions are respec-tively∼0.5–2.0 K and 0.2–1.5 g m−3(Güldner and Spänkuch, 2001; Cimini et al., 2011).
25
AMTD
7, 6971–7011, 2014Forecast indices from ground-based
microwave radiometer
D. Cimini et al.
Title Page
Abstract Introduction
Conclusions References
Tables Figures
◭ ◮
◭ ◮
Back Close
Full Screen / Esc
Printer-friendly Version Interactive Discussion
Discussion
P
a
per
|
Discus
sion
P
a
per
|
Discussion
P
a
per
|
Discussion
P
a
per
For the data set used in this analysis, the MWRP observed Tb at 22 channels and at 2 elevation angles (zenith and 15◦ elevation) and one fixed azimuth angle. The mi-crowave radiometer is calibrated using noise diode injection to measure the system gain continuously. The noise diode effective temperature is determined by observing an external cryogenic target less frequently (once every three to six months). The main
5
characteristics of the MWRP microwave radiometer are reported in Table 1.
3 Methodology
3.1 MWRP retrieval techniques
Atmospheric temperature and humidity profiles are retrieved from MWRP observations using any of the above mentioned inversion methods. The MP-3000A proprietary
al-10
gorithm deploys a neural networks (NN) method (Solheim et al., 1998), trained with thousands of profiles generated from historical data sets of operational radiosondes. The proprietary software offers two versions of the NN retrievals, which may run sep-arately and in parallel, one ingesting zenith observations (NNz) and the other ingest-ing the available slant observations (NNa). Alternatively, other methods can be
ap-15
plied to retrieve temperature and humidity profiles from MP-3000A data, as multivari-ate regression or variational approaches. Observation-based multivarimultivari-ate regression (ObsREG), using MWRP and radiosonde measurements from the past to calculate regression operators, has been successfully demonstrated to remove systematic er-rors and produce weak-biased retrievals with respect to radiosondes (Güldner and
20
Spänkuch, 2001; Cimini et al., 2006). More recently, the use of a one-dimensional vari-ational (1-DVAR) technique, coupling radiometric observations with outputs from a nu-merical weather prediction (NWP) model, has been demonstrated (Cimini et al., 2006, 2009, 2011; Hewison, 2007). The 1-DVAR method combines observed and forward-modelled Tb with measurement and background error covariance matrices to optimize
25
AMTD
7, 6971–7011, 2014Forecast indices from ground-based
microwave radiometer
D. Cimini et al.
Title Page
Abstract Introduction
Conclusions References
Tables Figures
◭ ◮
◭ ◮
Back Close
Full Screen / Esc
Printer-friendly Version Interactive Discussion
Discussion
P
a
per
|
Discus
sion
P
a
per
|
Discussion
P
a
per
|
Discussion
P
a
per
of temperature and humidity profile retrievals in the boundary layer and lower tropo-sphere depends primarily on the MWRP observations, while in the upper tropotropo-sphere depends primarily on the NWP model output. Thus, the 1-DVAR approach avoids the error inherent in methods initialized with local climatology and benefits from recent sur-face, radiosonde, satellite, radar, and other data assimilated in the local NWP analysis
5
and forecast.
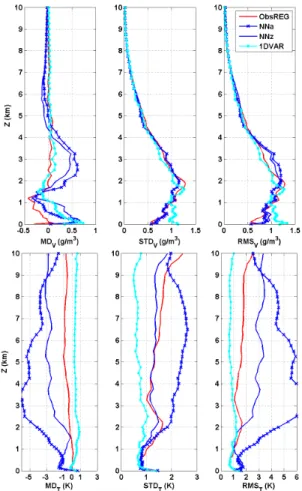
Figure 1 shows the statistical results for water vapour and temperature profiles com-puted using the above methods as compared with radiosondes profiles. In Fig. 1 are reported the mean difference (MD), standard deviation (STD), and root-mean-square (RMS) difference for simultaneous profiles (from ObsREG, NNa, NNz, and 1-DVAR),
10
using radiosonde as the reference. These results are obtained in the period May– June 2010 for a continental site at midlatitude, the Richard-Aßmann-Observatorium in Lindenberg, Germany, belonging to the German Weather Service (Deutscher Wetter-dienst, DWD). Figure 1 shows the results from the 233 cases in which all the data sources (radiosondes and MWRP) are simultaneously available. All observations
dur-15
ing all weather conditions are included in the statistical comparison. Concerning tem-perature profiles, Fig. 1 suggests that both ObsREG and 1-DVAR show a small bias (MD within 1 K) relatively to NNa and NNz (MD within 3 and 6 K, respectively for NNz and NNa). Although the methods show similar STD in the boundary layer, this tends to separate for altitudes higher than 1 km: STD remains within 1 K up to 10 km for
20
1-DVAR, while it increases with height for ObsREG, NNz and specially NNa. The re-sulting RMS remains within 1 K up to 10 km for 1-DVAR, within 2 K for ObsREG and 3 K for NNz, while it exceeds 6 K between 2.5–4 km for NNa. Figure 1 confirms that 1-DVAR outperforms the other considered methods for temperature profiling, minimis-ing both the systematic and random errors by benefitminimis-ing from recent data assimilated
25
AMTD
7, 6971–7011, 2014Forecast indices from ground-based
microwave radiometer
D. Cimini et al.
Title Page
Abstract Introduction
Conclusions References
Tables Figures
◭ ◮
◭ ◮
Back Close
Full Screen / Esc
Printer-friendly Version Interactive Discussion
Discussion
P
a
per
|
Discus
sion
P
a
per
|
Discussion
P
a
per
|
Discussion
P
a
per
2013), specifically for the mountain site in Whistler, Canada, which will be introduced in Sect. 4.
3.2 Forecast indices
Forecast indices are used at various airports and NWS as tools for operational meteo-rology, e.g. to provide a quantitative and objective way to assist forecasters in issuing
5
weather hazard alerts (Haklander and Van Delden, 2003). There are a number of FI that have been developed and are currently used, depending upon the particular cli-matology of various sites. A quite comprehensive review can be obtained from Miller (1972), Peppier (1998), and Haklander and Van Delden (2003). FI are usually com-puted from radiosonde profiles of temperature, humidity, and wind (if available). When
10
only temperature and humidity profiles are available, a reduced set of FI can be com-puted. This is the case for PTU (pressure, temperature, relative humidity) radiosondes, which are not equipped for wind estimation, as well as for MWRP. Therefore, temper-ature and humidity profiles retrieved by MWRP may be given in input to forecast tools developed for computing FI from PTU radiosondes. FI from temperature and humidity
15
profiles are also estimated from geostationary satellites retrievals (König, 2002; König and de Coning, 2009; de Coning et al., 2010). These satellite FI estimates are pro-duced operationally and cover most of the Earth surface at some 3–10 km resolution. However, satellite FI are based on infrared sounding channels, which tend to saturate in presence of clouds, and thus are only available in clear sky conditions. Moreover,
20
the reliability of satellite FI is hampered by the rather coarse vertical resolution of tem-perature and humidity profile retrievals from geostationary satellites, particularly in the lower troposphere.
More details on the FI considered in this paper are provided in Appendix A. Note that these simple methods have the advantages that they are based on
reproduc-25
AMTD
7, 6971–7011, 2014Forecast indices from ground-based
microwave radiometer
D. Cimini et al.
Title Page
Abstract Introduction
Conclusions References
Tables Figures
◭ ◮
◭ ◮
Back Close
Full Screen / Esc
Printer-friendly Version Interactive Discussion
Discussion
P
a
per
|
Discus
sion
P
a
per
|
Discussion
P
a
per
|
Discussion
P
a
per
the universal RAwinsonde OBservation (RAOB) program software (www.raob.com). FI from radiosondes and MWRP were computed independently. Note that it is beyond the scope of this paper to demonstrate the use and the forecast skills of the various FI. This topic is discussed in the review papers mentioned above (e.g. Haklander and Van Delden, 2003), and it is still object of debate within the weather forecast community
5
(e.g. Doswell and Schultz, 2006). The aim of this paper is to investigate the feasibility of producing good quality FI from MWRP observations and to quantify the agreement and correlation with analogous FI estimated from radiosondes. If the agreement is deemed satisfactory, we shall conclude that MWRP can deliver additional valuable products that may complement radiosondes, or even supply for the lack thereof, in support to
10
operational meteorology.
4 Results
This Section presents the results of computing FI from MWRP temperature and hu-midity profiles and their agreement with the analogous FI computed from radiosonde profiles. The results are given for two sites corresponding to different environmental
15
conditions. The first site is in Lindenberg (Germany) at the Meteorological Observa-tory Lindenberg – Richard-Assmann-ObservaObserva-tory (MOL-RAO) operated by the Ger-man Meteorological Service (Deutscher Wetterdienst, DWD). Lindenberg is located at midlatitude (52.17◦N, 14.12◦E) and low altitude (98 m above sea level (a.s.l.)) in a rather flat rural area in Central Europe. The second site is in Whistler (Canada) at the
20
meteorological station operated by Environment Canada – Meteorological Service of Canada – in support of nowcasting and short-term weather forecasting during the Van-couver 2010 Olympic and Paralympic Winter Games (Mailhot et al., 2010). Whistler is located at midlatitude (50.09◦N, 122.98◦W) and relatively high elevation (776 m a.s.l.) in a mountainous environment along the Pacific Ranges of the Coast Mountains in
25
AMTD
7, 6971–7011, 2014Forecast indices from ground-based
microwave radiometer
D. Cimini et al.
Title Page
Abstract Introduction
Conclusions References
Tables Figures
◭ ◮
◭ ◮
Back Close
Full Screen / Esc
Printer-friendly Version Interactive Discussion
Discussion
P
a
per
|
Discus
sion
P
a
per
|
Discussion
P
a
per
|
Discussion
P
a
per
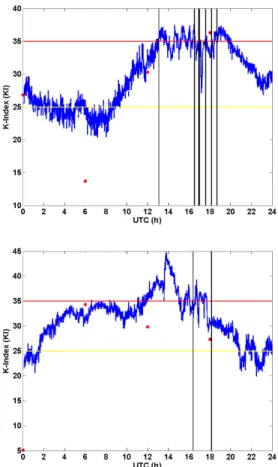
Two 24 h time series ofK index as computed from radiosonde and MWRP profiles in Lindenberg are shown in Fig. 2. These are typical continental summer-time cases (12 and 15 August 2010), in which convection starts to develop after the sunrise, generat-ing thunderstorms in the afternoon. As explained in Appendix A, theK index is such that the higher the value, the higher the probability of thunderstorms. In particular,
5
empirical thresholds are often used to separate weak (K index<25K) from moder-ate (25K < K index<35K) and finally strong thunderstorm potential (K index>35K). Although it is beyond the scope of this paper to demonstrate the skills of FI and the applied thresholds, Fig. 2 shows how increasing values of K index correspond to in-creasing instability, eventually culminating into a thunderstorm. In fact, we seeK index
10
values increasing from below the weak-potential threshold in the morning to above the high-potential threshold in the afternoon, and then decaying down in the evening. Mul-tiple thunders were reported nearby Lindenberg in the afternoon of both days. These time series suggest that theK index computed from MWRP profiles follows quite rea-sonably the trend given by the radiosondes, launched 4 times a day. Moreover, it can
15
be appreciated the value of the nearly continuous (∼1 min resolution)K index provided by the MWRP with respect to the information provided by the radiosondes at a rather coarse time spacing (6 h). For example, considering the trend ofK index suggested by the radiosondes between 06:00 and 18:00 UTC of 15 August 2010, the thunderstorm potential seems to be decreasing steadily from nearly strong to weak values. By
look-20
ing at radiosondeK index only, a forecaster would have missed the rapid increase in instability after 12:00 UTC indicated by the MWRP, which largely overshoot the strong potential and likely generated the thunderstorm reported right after 16:00 UTC.
For the present analysis, a total of 61 days of MWRP data and 244 radiosonde as-cents at 6 h intervals are used for Lindenberg, while a total of 17 days of MWRP data
25
AMTD
7, 6971–7011, 2014Forecast indices from ground-based
microwave radiometer
D. Cimini et al.
Title Page
Abstract Introduction
Conclusions References
Tables Figures
◭ ◮
◭ ◮
Back Close
Full Screen / Esc
Printer-friendly Version Interactive Discussion
Discussion
P
a
per
|
Discus
sion
P
a
per
|
Discussion
P
a
per
|
Discussion
P
a
per
However, the K index computed from MWRP retrievals shows a pick exceeding the high-potential threshold on 16 February (Julian day 47), which was followed by a snow storm (Cimini et al., 2011; Ware et al., 2013). Other snow storms were experienced during the periods between 12–15 and 24–27 February (Julian day 43–46 and 55– 58), in which the K index from both radiosondes and MWRP occasionally exceeds
5
the moderate-potential threshold. Note that the trend of K index indicated by the ra-diosonde is followed better by the 1-DVAR then the NNz retrievals. This is especially evident during clear sky and fair weather conditions (as for example between Julian day 49–55). In fact, these conditions were associated with decreased moisture at 850– 700 mbar levels and increased static stability between 850 and 500 mbar, causing
ex-10
tremely low values ofK index. This is a direct consequence of the situation pictured in Fig. 1, which shows lower systematic and random errors for 1-DVAR than for NNz retrievals in the upper air, where the 850–500 mbar pressure levels reside. Note also that during clear nocturnal conditions the MWR observations were particularly useful to detect a cold bias in the analysis boundary layer temperature (Ware et al., 2013),
15
which were used as initial condition for 1-DVAR. This confirmed the large uncertainty associated to gridded analysis in the nocturnal boundary layer (Hart et al., 1998; Hart and Forbes, 1999).
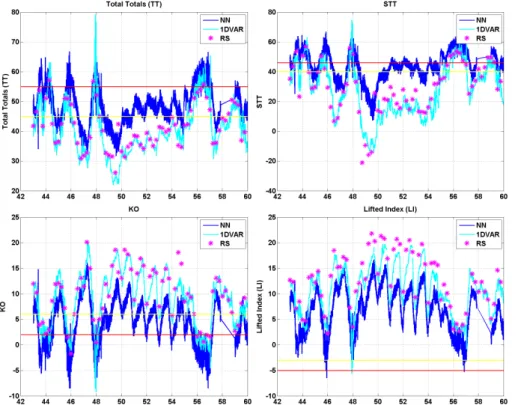
Similarly, Figs. 4 and 5 show the time series for the same period but for other forecast indices, namely the Total Totals, STT, KO, Lifted Index, Showalter Index, Fog Threat,
20
T1 Gust, and finally Jefferson Index. Note that, as detailed in Appendix A, some FI have inverted trend, i.e. the lower the value, the higher the potential. For Total Totals, KO, Showalter Index, Lifted Index, STT, and Jefferson Index the same considerations for Fig. 3 apply: the trend indicated by radiosondes is well captured by the MWRP esti-mates, specially those computed from 1-DVAR retrievals, both for the diurnal and extra
25
AMTD
7, 6971–7011, 2014Forecast indices from ground-based
microwave radiometer
D. Cimini et al.
Title Page
Abstract Introduction
Conclusions References
Tables Figures
◭ ◮
◭ ◮
Back Close
Full Screen / Esc
Printer-friendly Version Interactive Discussion
Discussion
P
a
per
|
Discus
sion
P
a
per
|
Discussion
P
a
per
|
Discussion
P
a
per
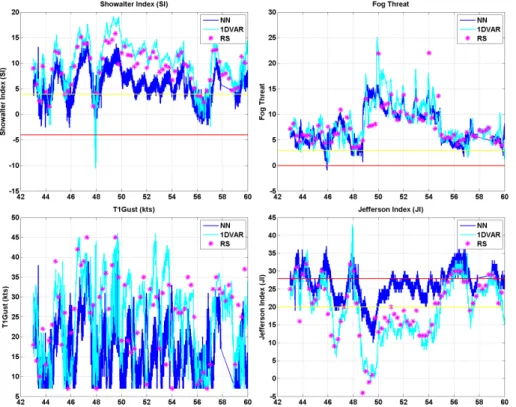
For other two of the considered FI, specifically Fog Threat and T1 Gust, MWRP estimates again follows quite well the trend indicated by radiosondes, but the difference between 1-DVAR and NNz is difficult to appreciate. The Fog Threat values indicate low potential throughout the period, except for 15 February (Julian day 46), few hours before a sudden fog event occurred. However, other few fog/mist events were reported
5
(e.g. Julian days 43, 45, 48, 59), in correspondence of which the Fog Threat shows values from low to moderate potential. The T1 Gust shows maximum wind gust up to 45 knots (∼23 m s−1), though reported winds at the radiosonde launching site did not exceed 20 knots (∼10 m s−1).
In order to make a quantitative statement on the agreement of the considered FI
10
as computed from radiosonde and MWRP retrieved profiles, we process the data in order to match the independent datasets and compute statistical scores, such as the average (AVG), standard deviation (STD), and root-mean-square (RMS) differences, the correlation coefficient (COR), and finally the slope (SLP) and intercept (INT) of a least-square linear fit. The statistical scores forK index in Whistler are summarized in
15
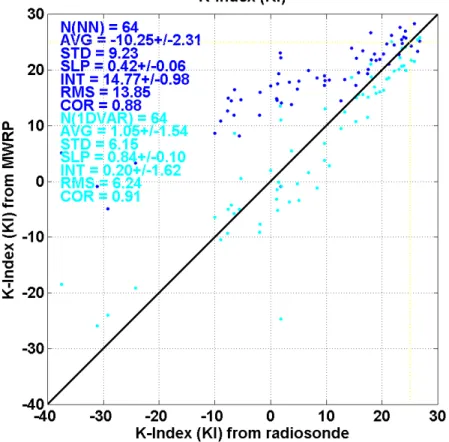
Fig. 6. For higher values (K index>15), it is evident that both NNz and 1-DVAR agree fairly well with the values computed from radiosondes. For lower values the 1-DVAR gives much better agreement than NNz, as anticipated above. Overall, the comparison in Whistler ofK index computed from 1-DVAR temperature and humidity retrievals with
K index computed from radiosonde profiles shows RMS error within 6.1 K (less than
20
10 % of the total range) with a correlation coefficient better than 0.9. With respect to NNz retrievals, 1-DVAR reduces significantly both the systematic (AVG roughly from 10 to 1 K) and the random (STD by a factor of 1.5, RMS by a factor of 2) error components. Note that the results for NNz are still fairly good (0.88 correlation), and tend to agree with 1-DVAR for higher values, where theK index is more interesting for forecasting
25
purposes.
AMTD
7, 6971–7011, 2014Forecast indices from ground-based
microwave radiometer
D. Cimini et al.
Title Page
Abstract Introduction
Conclusions References
Tables Figures
◭ ◮
◭ ◮
Back Close
Full Screen / Esc
Printer-friendly Version Interactive Discussion
Discussion
P
a
per
|
Discus
sion
P
a
per
|
Discussion
P
a
per
|
Discussion
P
a
per
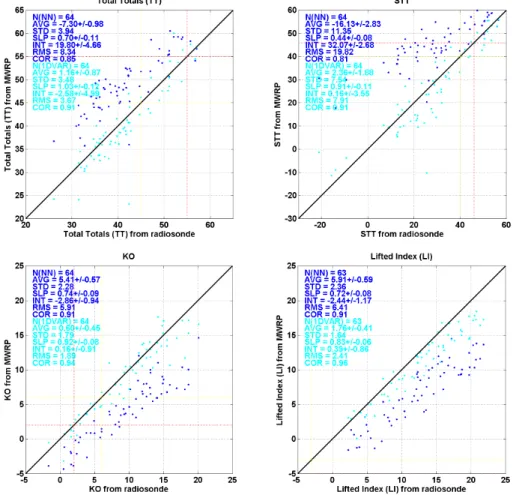
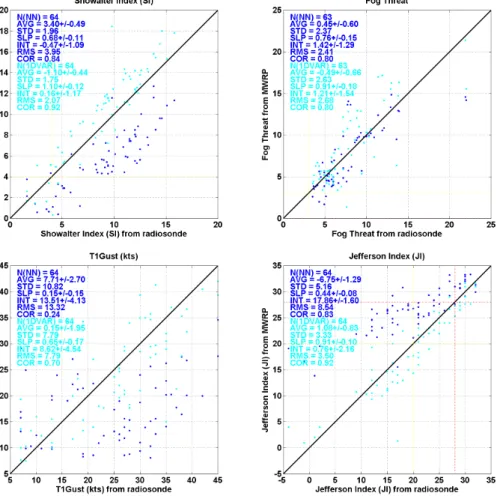
radiosonde and MWRP retrievals results in (a) a significant improvement of the statis-tical scores for 1-DVAR with respect to NNz, and (b) correlation coefficients better than 0.9 and RMS within 10 % of the range (considering 1-DVAR). As for theK index, results for NNz are still fairly good (correlation between 0.8–0.9 depending on FI), and tend to agree with 1-DVAR in the most significant range. For the Fog Threat and T1 Gust, the
5
correlation coefficients are much lower (respectively 0.8 and 0.7, considering 1-DVAR) and the RMS exceeds 10 % of the range (respectively 12 % and 19 %, considering 1-DVAR). The improvement brought by 1-DVAR with respect to NNz is significant for T1 Gust (a factor of 1.5 for STD and RMS, a factor∼3 for correlation), while it becomes negligible for the Fog Threat. The latter result can be explained by looking at the similar
10
results for NNz and 1-DVAR in Fig. 1 for the lower levels, which mainly determine the value of the Fog Threat index.
The statistics of the difference between FI computed from radiosonde and MWRP retrievals in Whistler are summarized in Table 2. In addition to the FI discussed above, Table 2 shows the results for four more FI, namely the Convective Available Potential
15
Energy (CAPE), the Microburst Day Potential Index (MDPI), the Thompson Index, and finally the TQ Index. For CAPE, the 1-DVAR retrievals show 0.94 correlation coefficient and 102.5 J kg−1RMS (less than 10 % of the range), with an improvement factor of 1.7 and 3.7, respectively, with respect to NNz. For MDPI, results are similar for NNz and 1-DVAR retrievals, showing 0.80–0.83 correlation coefficient, respectively. For
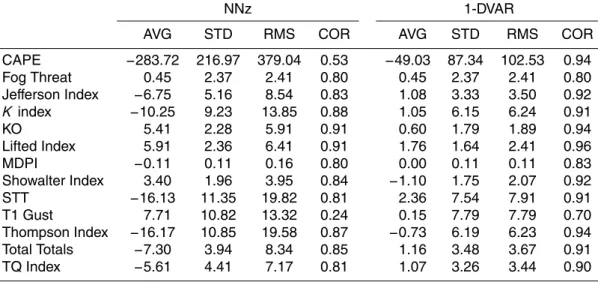
Thomp-20
son Index and TQ Index, 1-DVAR retrievals show correlation coefficient exceeding 0.9 and RMS within 10 % of the total range, somewhat better than the NNz retrievals. Thus, similarly to other FI, CAPE, MDPI, Thompson Index, and TQ Index show good correlation between radiosondes and MWRP estimates (either NNz or 1-DVAR), with a tangible improvement for 1-DVAR with respect to NNz.
25
AMTD
7, 6971–7011, 2014Forecast indices from ground-based
microwave radiometer
D. Cimini et al.
Title Page
Abstract Introduction
Conclusions References
Tables Figures
◭ ◮
◭ ◮
Back Close
Full Screen / Esc
Printer-friendly Version Interactive Discussion
Discussion
P
a
per
|
Discus
sion
P
a
per
|
Discussion
P
a
per
|
Discussion
P
a
per
Figure 9 shows the results for KI, for which the three MWRP retrievals agree fairly well, with 0.81–0.88 (ObsREG and NNz/1-DVAR, respectively) correlation coefficient with respect to radiosonde values. Figures 10 and 11 show the results for Total Totals, STT, KO, Lifted Index, Showalter Index, Fog Threat, T1 Gust, and Jefferson Index. These results are consistent with the ones in Whistler for the most. In terms of correlation
5
coefficient, 1-DVAR retrievals usually outperforms the other two, though the differences are less significant than in Whistler. However, 1-DVAR shows the lowest correlation of the three retrievals for two FI (CAPE and Fog Threat), while it shows lower correlation than NNz for a TQ Index.
5 Summary and conclusions
10
Forecast indices based on radiosonde soundings have been developed over many decades as local weather prediction tools. However, FI typically lose their value dur-ing six hour and longer intervals between traditional radiosonde sounddur-ings. Contin-uous tropospheric thermodynamic profiles can be retrieved on a minute time scale from a ground-based microwave radiometer profiler (MWRP) working in the 20–60 GHz
15
range. Forecast indices (FI) developed for radiosonde TPU profiles can be derived from the MWRP thermodynamic profiles. The present analysis demonstrates good agree-ment between FI derived from MWRP and radiosonde soundings. The analysis is per-formed for two midlatitude sites: one residing in a low-elevation flat rural area in Central Europe (Lindenberg, Germany) and the other in a mountainous environment along the
20
Pacific Ranges of the Coast Mountains in western North America (Whistler, Canada). The analysis revealed:
AMTD
7, 6971–7011, 2014Forecast indices from ground-based
microwave radiometer
D. Cimini et al.
Title Page
Abstract Introduction
Conclusions References
Tables Figures
◭ ◮
◭ ◮
Back Close
Full Screen / Esc
Printer-friendly Version Interactive Discussion
Discussion
P
a
per
|
Discus
sion
P
a
per
|
Discussion
P
a
per
|
Discussion
P
a
per
– FI derived from 1-DVAR retrievals usually outperform neural network and observation-based regression retrievals in terms of correlation, mean, and ran-dom difference with respect to FI values derived from radiosondes.
– FI time series derived from MWRP retrievals provide promising new tools for lo-cal high impact weather prediction (Madhulatha et al., 2013) based on
uninter-5
rupted surveillance of local tropospheric thermodynamics in all weather condi-tions (Cimini et al., 2011; Ware et al., 2013; Xu et al., 2014), capturing the entire diurnal cycle and providing fresh and timely data to forecasters.
Therefore, we conclude that MWRP retrievals are able to deliver valuable FI, with the certain advantage (with respect to radiosondes) of nearly continuous update. FI time
10
series are promising new tools for high impact local weather forecasting, complement-ing and augmentcomplement-ing 6/12 h indices derived from radiosonde soundcomplement-ings.
Appendix A: Definitions of forecast indices
In this Appendix we summarise the definitions of the forecast indices considered in our analysis. In the following definitions, Txxx is the temperature at the pressure level xxx 15
(in mb), Tdxxx is dew point temperature,θexxx is the equivalent potential temperature, θWBxxx is the wet bulb potential temperature at the same pressure level. The Forecast
Index definition below were extracted from review papers (Peppler, 1998; Haklander and Van Delden, 2003; de Coning et al., 2010) as well as from American Meteorological Society glossary (AMS, 2013) and RAOB software manual. According to Haklander
20
AMTD
7, 6971–7011, 2014Forecast indices from ground-based
microwave radiometer
D. Cimini et al.
Title Page
Abstract Introduction
Conclusions References
Tables Figures
◭ ◮
◭ ◮
Back Close
Full Screen / Esc
Printer-friendly Version Interactive Discussion
Discussion
P
a
per
|
Discus
sion
P
a
per
|
Discussion
P
a
per
|
Discussion
P
a
per
CAPE
The Convective Available Potential Energy (CAPE) defines the maximum energy avail-able to an ascending air parcel, and it is often used to indicate instability and the pos-sibility of thunderstorms. There exists many different definitions of CAPE in literature (Haklander and Van Delden, 2003). Here, CAPE is calculated by integrating vertically
5
the local buoyancy of a parcel (expressed introducing the virtual temperature of the parcel Tvp and that of the environment Tve) from the level of free convection (LFC) to the equilibrium level (EL):
CAPE=−Rd EL Z
LFC
(Tvp−Tve)d(lnp)
whereRd=287.05 J (kg K)− 1
is the gas constant for dry air and CAPE is measured in
10
joules per kilogram of air (J kg−1). Any value greater than 0 J kg−1 indicates instability and the possibility of thunderstorms.
Fog Threat
The Fog Threat (FT) index indicates the potential for radiation fog and it is based on the definition of Fog Point (FP), which is the temperature at which radiation fog will form.
15
The fog point is determined by following the saturation mixing ratio line from the dew point curve at the lifting condensation level (LCL) to the surface temperature. Then, the Fog Threat is given by the difference of the wet bulb potential temperature at 850 mbar
θWB850 and the Fog Point computed as above:
FT=θWB850−FP 20
AMTD
7, 6971–7011, 2014Forecast indices from ground-based
microwave radiometer
D. Cimini et al.
Title Page
Abstract Introduction
Conclusions References
Tables Figures
◭ ◮
◭ ◮
Back Close
Full Screen / Esc
Printer-friendly Version Interactive Discussion
Discussion
P
a
per
|
Discus
sion
P
a
per
|
Discussion
P
a
per
|
Discussion
P
a
per
Jefferson index
The Jefferson index (JI) was designed originally for maritime and arid areas (Haklander and Van Delden, 2003, and references therein). JI is defined as:
JI=1.6·θWB850−T500−0.5·(T700−Td700)−8
Non-frontal thunderstorms can be expected for values above 28. Significant showers
5
with thunderstorm are expected for values above 30.
K index
TheK index is due to George (1960) and it is defined by:
KI=(T850−T500)+Td850−(T700−Td700)
The first term is the lapse rate, while the second and third are related to the moisture
10
between 850 and 700 mbar, and are strongly influenced by the temperature–dewpoint spread at the 700 mbar level. The K index increases with decreasing static stability between 850 and 500 hPa, increasing moisture at 850 hPa, and increasing relative hu-midity at 700 hPa. The higher theK index, the higher the probability of thunderstorms. AsK index increases from a value of 20 or so, the likelihood of showers and
thunder-15
storms is expected to increase. TheK index was developed for forecasting air mass thunderstorms, particularly useful in predicting non-frontal thunderstorm situations.
KO index
KO index was developed for estimating thunderstorm potential in Europe (Andersson et al., 1989). The KO index describes the potential instability between lower and higher
20
levels of the atmosphere and it is thus based on the equivalent potential temperature
θeas:
AMTD
7, 6971–7011, 2014Forecast indices from ground-based
microwave radiometer
D. Cimini et al.
Title Page
Abstract Introduction
Conclusions References
Tables Figures
◭ ◮
◭ ◮
Back Close
Full Screen / Esc
Printer-friendly Version Interactive Discussion
Discussion
P
a
per
|
Discus
sion
P
a
per
|
Discussion
P
a
per
|
Discussion
P
a
per
If the surface level is above 1000 mbar, thenθesrfis used instead ofθe1000. The KO is
more sensitive to moisture than other stability indices and it is best used in cooler, moist climates. The thunderstorm potential increases as the KO index decreases. Values smaller than 2 generally indicate strong thunderstorm potential.
Lifted Index
5
The Lifted index (LI), developed by Galway (1956), is nominally identical to the Showal-ter index, except for the deShowal-termination of the level from which the parcel is lifted.
LI=T500−TL
The LI was defined by lifting the parcel adiabatically from the midpoint of the surface layer to 500 mbar, where its temperature, considered the updraft temperature within
10
a developing cloud, was compared to that of the environment. The parcel being lifted is defined by the dry adiabat running through the predicted surface afternoon temperature maximum and the mean mixing ratio in the lowest 900 m. The values of this index tend to be somewhat lower than those of Showalter.
Microburst day potential index (MDPI)
15
The microburst day potential index (MDPI) was developed in part on the results from the Microburst and Severe Thunderstorm (MIST) project (Atkins and Wakimoto, 1991). MDPI is based on the vertical profiles of equivalent potential temperature and it is defined follows:
MDPI=(maxθe(Sfc−850 mbar)−minθe(660−<500 mbar))/30
20
AMTD
7, 6971–7011, 2014Forecast indices from ground-based
microwave radiometer
D. Cimini et al.
Title Page
Abstract Introduction
Conclusions References
Tables Figures
◭ ◮
◭ ◮
Back Close
Full Screen / Esc
Printer-friendly Version Interactive Discussion
Discussion
P
a
per
|
Discus
sion
P
a
per
|
Discussion
P
a
per
|
Discussion
P
a
per
Showalter index
The Showalter index (SI) was designed originally for thunderstorm forecasting in the southwester US (Showalter, 1947). It estimates the potential instability of the 850 to 500 mbar layer by measuring the buoyancy at 500 mbar of an air parcel lifted to that level. Thus, it is defined as:
5
SI=T500−TL
where TL is the temperature (◦C) of a parcel lifted from 850 to 500 mbar,
dry-adiabatically to saturation and moist-dry-adiabatically above that. As the index decreases to zero and below, the likelihood of showers and thunderstorms is considered to in-crease. SI values ≤+3 are indicative of possible thunderstorm activity, while values
10
≤ −3 are associated with severe convective activity. The SI has been one oft he most frequently applied stability indices.
Sindex (STT)
The S index (STT) was introduced by the German Military Geophysical Office as an improvement on the Total Totals index (Haklander and Van Delden, 2003, and
refer-15
ences therein) including a variable parameterAbased on Vertical Totals (VT). The S
index is defined as:
STT=TT−(T700+Td700)−A=T850+Td850−2·T500−(T700−Td700)−A
where TT indicates Total Totals index (see below) andA depends on VT such that it penalizes cases with low values of VT (i.e. low vertical temperature gradients):
20
A=
AMTD
7, 6971–7011, 2014Forecast indices from ground-based
microwave radiometer
D. Cimini et al.
Title Page
Abstract Introduction
Conclusions References
Tables Figures
◭ ◮
◭ ◮
Back Close
Full Screen / Esc
Printer-friendly Version Interactive Discussion
Discussion
P
a
per
|
Discus
sion
P
a
per
|
Discussion
P
a
per
|
Discussion
P
a
per
Note that theSindex takes the same variables into account as theK index, but in other proportions, and thus it can also be written as:
STT=KI−T500−A
T1 Gust
The T1 Gust (also called Dry Stability Index) method was developed with the intent of
5
giving forecasters a way to estimate maximum thunderstorm wind gusts (Fawbush and Miller, 1954). The T1 method is still used to predict the maximum wind gust in air mass thunderstorms, relying on evidence that most convective wind gusts at the surface appear to result from downdraft air originating in the lower portion of a thunderstorm. Thus, the T1 method is computed as the difference between the temperature of a parcel
10
of moist surface air raised moist adiabatically to 600 mbar (TMA600) and the observed
dry bulb temperature at the 600 mbar level.
T1=TMA600−T600
In case of a temperature inversion within 150–200 hPa above the surface, the moist adiabat is followed from the warmest point in the inversion to 600 mbar (Miller, 1972).
15
Finally, the speed of maximum wind gust (in knots) is given by the empirical formula
V ≈13·√T1.
Thompson Index
The Thompson Index (TI) is primarily used to determine thunderstorm potential in the Rocky Mountains. It is defined as:
20
TI=KI−LI
AMTD
7, 6971–7011, 2014Forecast indices from ground-based
microwave radiometer
D. Cimini et al.
Title Page
Abstract Introduction
Conclusions References
Tables Figures
◭ ◮
◭ ◮
Back Close
Full Screen / Esc
Printer-friendly Version Interactive Discussion
Discussion
P
a
per
|
Discus
sion
P
a
per
|
Discussion
P
a
per
|
Discussion
P
a
per
Total Totals
Total Totals (TT) index is attributable to Miller (1972) and it is defined by the combination of the vertical totals (VT=T850−T500) and the cross totals (CT=Td850−T500), resulting
in:
TT=T850+Td850−2·T500 5
The TT index is commonly used as a severe weather indicator. The higher the number, the more unstable the atmosphere. Values lower than 45◦C generally indicate weak thunderstorm potential, while values larger than 55◦C indicate high possibility of severe thunderstorms, though value interpretation varies with season and location.
TQ Index
10
The TQ index (TQ) is used to assess the potential for low-topped convection. It is defined as:
TQ=(T850+Td850)−1.7·(T700).
Values larger than 12 indicate unstable lower troposphere where thunderstorm and rainfall are possible outside of stratiform clouds, while for values larger than 17
thun-15
derstorm and rainfall are possibile in presence of stratiform clouds.
Acknowledgements. Part of this work has been stimulated through the EU COST Actions ES0702 EG-CLIMET and ES1303 TOPROF. Environment Canada and the German Weather Service (Deutscher Wetterdienst) conducted microwave profiler and radiosonde data collection in Whistler and Lindenberg, respectively, and provided grant support for data analysis.
AMTD
7, 6971–7011, 2014Forecast indices from ground-based
microwave radiometer
D. Cimini et al.
Title Page
Abstract Introduction
Conclusions References
Tables Figures
◭ ◮
◭ ◮
Back Close
Full Screen / Esc
Printer-friendly Version Interactive Discussion
Discussion
P
a
per
|
Discus
sion
P
a
per
|
Discussion
P
a
per
|
Discussion
P
a
per
References
AMS: American Meteorological Society Glossary of Meteorology, available at: http://glossary. ametsoc.org/wiki/Main_Page (last access: 6 November 2013), 2013.
Andersson, T., Andersson, M., Jacobsson, C., and Nilsson, S.: Thermodynamic indices for forecasting thunderstorms in southern Sweden, Meteorol. Mag., 116, 141–146, 1989.
5
Atkins, N. T. and Wakimoto, R. M.: Wet microburst activity over the southeastern United States: implications for forecasting, Weather Forecast., 6, 470–482, 1991.
Baker, R., Cramer, J., and Peters, J.: Radiation Fog: UPS Airlines Conceptual Models and Forecast Methods, 10th Conference on Aviation, Range, and Aerospace Meteorology, 5, 11, available at: https://ams.confex.com/ams/pdfpapers/39165.pdf (last access: 8 November
10
2013), Portland, USA, May, 2002.
Cadeddu, M. P., Liljegren, J. C., and Turner, D. D.: The Atmospheric radiation measurement (ARM) program network of microwave radiometers: instrumentation, data, and retrievals, Atmos. Meas. Tech., 6, 2359–2372, doi:10.5194/amt-6-2359-2013, 2013.
Cimini, D., Westwater, E. R., Han, Y., and Keihm, S. J.: Accuracy of ground-based microwave
15
radiometer and balloon-borne measurements during WVIOP2000 field experiment, IEEE T. Geosci. Remote, 41, 2605–2615, 2003.
Cimini, D., Hewison, T. J., Martin, L., Güldner, J., Gaffard, C., and Marzano, F.: Temperature and humidity profile retrievals from groundbased microwave radiometers during TUC, Meteorol. Z., 15, 45–56, 2006.
20
Cimini, D., Westwater, E. R., and Gasiewski, A. J., Temperature and humidity profiling in the Arctic using millimeter-wave radiometry and 1-DVAR, IEEE T. Geosci. Remote, 48, 1381– 1388, doi:10.1109/TGRS.2009.2030500, 2010.
Cimini, D., Campos, E., Ware, R., Albers, S., Giuliani, G., Oreamuno, J., Joe, P., Koch, S., Cober, S., and Westwater, E.: Thermodynamic atmospheric profiling during the 2010 Winter
25
Olympics using ground-based microwave radiometry, IEEE T. Geosci. Remote, 49, 4959– 4969, doi:10.1109/TGRS.2011.2154337, 2011.
Cimini, D., Caumont, O., Löhnert, U., Alados-Arboledas, L., Bleisch, R., Huet, T., Ferrario, M. E., Madonna, F., Haefele, A., Nasir, F., Pace, G., and Posada, R.: A data assimilation exper-iment of temperature and humidity profiles from an international network of ground-based
30
AMTD
7, 6971–7011, 2014Forecast indices from ground-based
microwave radiometer
D. Cimini et al.
Title Page
Abstract Introduction
Conclusions References
Tables Figures
◭ ◮
◭ ◮
Back Close
Full Screen / Esc
Printer-friendly Version Interactive Discussion
Discussion
P
a
per
|
Discus
sion
P
a
per
|
Discussion
P
a
per
|
Discussion
P
a
per
Chan, P. W.: Performance and application of a multiwavelength, ground-based microwave ra-diometer in intense convective weather, Meteorol. Z., 18, 253–265, 2009.
Chan, P. W. and Hon, K. K.: Application of ground-based, multi-channel microwave radiometer in the nowcasting of intense convective weather through instability indices of the atmosphere, Meteorol. Z., 20, 431–440, 2011.
5
Chan, P. W. and Lee, Y. F.: Application of a ground-based, multi-channel microwave radiometer to the alerting of low-level windshear at an airport, Meteorol. Z., 20, 423–429, 2011.
de Coning, E., König, M., and Olivierc, J.: The combined instability index: a new very-short range convection forecasting technique for southern Africa, Meteorol. Appl., 18, 421–439, doi:10.1002/met.234, 2010.
10
Doswell III, C. A. and Schultz, D. M.: On the use of indices and parameters in forecasting severe storms, Electronic Journal of Severe Storms Meteorology, 1, 1–22, available at: http: //www.ejssm.org/ojs/index.php/ejssm/article/view/11/10, 2006.
Fawbush, E. J. and Miller, R. C.: A basis for forecasting peak wind gusts in non-frontal thunder-storms, B. Am. Meteorol. Soc., 35, 14–19, 1954.
15
Feltz, W. F. and Mecikalski, J. R.: Monitoring high-temporal-resolution convective stability in-dices using the ground-based Atmospheric Emitted Radiance Interferometer (AERI) during the 3 May 1999 Oklahoma–Kansas Tornado Outbreak, Weather Forecast., 17, 445–455, 2002.
Friedrich, K., Lundquist, J. K., Aitken, M., Kalina, E. A., and Marshall, R. F.: Stability and
turbu-20
lence in the atmospheric boundary layer: a comparison of remote sensing and tower obser-vations, Geophys. Res. Lett., 39, L03801, doi:10.1029/2011GL050413, 2012.
Galway, J. G.: The lifted index as a predictor of latent instability, B. Am. Meteorol. Soc., 37, 528–529, 1956.
George, J. J.: Weather Forecasting for Aeronautics, Academic Press, New York, 673 pp., 1960.
25
Güldner, J. and Spänkuch, D.: Remote sensing of the thermodynamic state of the atmospheric boundary layer by ground-based microwave radiometry, J. Atmos. Ocean. Tech., 18, 925– 933, 2001.
Haklander, A. J. and Van Delden, A.: Thunderstorm predictors and their forecast skill for the Netherlands, Atmos. Res., 67–68, 273–299, doi:10.1016/S0169-8095(03)00056-5, 2003.
30
AMTD
7, 6971–7011, 2014Forecast indices from ground-based
microwave radiometer
D. Cimini et al.
Title Page
Abstract Introduction
Conclusions References
Tables Figures
◭ ◮
◭ ◮
Back Close
Full Screen / Esc
Printer-friendly Version Interactive Discussion
Discussion
P
a
per
|
Discus
sion
P
a
per
|
Discussion
P
a
per
|
Discussion
P
a
per
Hart, R. E., Forbes, G. S., and Grumm, R. H., The use of hourly model-generated soundings to forecast mesoscale phenomena. Part I: Initial assessment in forecasting warm-season phenomena, Weather Forecast., 13, 1165–1185, 1998.
Hewison, T.: 1D-VAR retrievals of temperature and humidity profiles from a ground-based mi-crowave radiometer, IEEE T. Geosci. Remote, 45, 2163–2168, 2007.
5
Holtslag, M. C., Steeneveld, G. J., and Holtslag, A. A. M.: Fog forecasting: “old fash-ioned” semi-empirical methods from radio sounding observations versus “modern” nu-merical models, in: Proc. 5th Int. Conf. Fog and Dew (FOGDEW2010), available at: http://meetingorganizer.copernicus.org/FOGDEW2010/FOGDEW2010-69.pdf (last access: 8 November 2013), Münster, Germany, 25–30 July, 2010.
10
Knupp, K., Ware, R., Cimini, D., Vandenberghe, F., Vivekanandan, J., Westwater, E. R., and Coleman, T.: Ground-based passive microwave profiling during dynamic weather conditions, J. Atmos. Ocean. Tech., 26, 1057–1073, doi:10.1175/2008JTECHA1150.1, 2009.
König, M.: Atmospheric Instability Parameters Derived from MSG SEVIRI Observations, EU-METSAT Technical Memorandum No. 9, January, 2002.
15
König, M. and de Coning, E.: The MSG global instability indices product and its use as a now-casting tool, Weather Forecast., 24, 272–285, 2009.
Kuhlman, C. J.: Evaluation of Convective Wind Forecasting Methods During High Wind Events, M.S. thesis, Naval Postgraduate School, Monterey, California, March, 2006.
Löhnert, U. and Maier, O.: Operational profiling of temperature using ground-based microwave
20
radiometry at Payerne: prospects and challenges, Atmos. Meas. Tech., 5, 1121–1134, doi:10.5194/amt-5-1121-2012, 2012.
Löhnert, U., Crewell, S., and Simmer, C.: An integrated approach towards retrieving physically consistent profiles of temperature, humidity, and cloud liquid water, J. Appl. Meteorol., 43, 1295–1307, 2004.
25
Madhulatha, A., Rajeevan, M., Venkat Ratnam, M., Bhate, J., and Naidu, C. V.: Nowcasting severe convective activity over southeast India using ground-based microwave radiometer observations, J. Geophys. Res.-Atmos., 118, 1–13, doi:10.1029/2012JD018174, 2013. Mailhot, J., Belair, S., Charron, M., Doyle, C., Joe, P., Abrahamowicz, M., Bernier, N. B.,
Denis, B., Erfani, A., Frenette, R., Giguere, A., Isaac, G. A., McLennan, N.,
McTaggart-30
AMTD
7, 6971–7011, 2014Forecast indices from ground-based
microwave radiometer
D. Cimini et al.
Title Page
Abstract Introduction
Conclusions References
Tables Figures
◭ ◮
◭ ◮
Back Close
Full Screen / Esc
Printer-friendly Version Interactive Discussion
Discussion
P
a
per
|
Discus
sion
P
a
per
|
Discussion
P
a
per
|
Discussion
P
a
per
Maschwitz, G., Löhnert, U., Crewell, S., Rose, T., and Turner, D. D.: Investigation of ground-based microwave radiometer calibration techniques at 530 hPa, Atmos. Meas. Tech., 6, 2641–2658, doi:10.5194/amt-6-2641-2013, 2013.
Miller, R. C.: Notes on Analysis and Severe Storm Forecasting Procedures of the Air Force Global Weather Central, Technical Report 200(R), AWS, USAF, Scott AFB, IL, 1972.
5
NRC: National Research Council Committee on Developing Mesoscale Meteorological Ob-servational Capabilities to Meet Multiple Needs, Observing Weather and Climate from the Ground Up: a Nationwide Network of Networks, 2008.
NRC: National Research Council Committee on Progress and Priorities of US Weather, Re-search and ReRe-search-to-Operations Activities, When Weather Matters: Science and Service
10
to Meet Critical Societal Needs, 2010.
Peppier, R. A.: A Review of Static Stability Indices and Related Thermodynamic Parameters, Illinois State Water Survey Division, SWS Miscellaneous Publication 104, available at: http: //www.isws.illinois.edu/pubdoc/MP/ISWSMP-104.pdf (last access: 7 November 2013), 1988. Showalter, A. K.: A stability index for forecasting thunderstorms, B. Am. Meteorol. Soc., 34,
15
250–252, 1947.
Solheim, F., Godwin, J., Westwater, E., Han, Y., Keihm, S., Marsh, K., and Ware, R.: Radio-metric profiling of temperature, water vapor, and cloud liquid water using various inversion methods, Radio Sci., 33, 393–404, 1998.
Vaisala Radiosonde RS92-SGP, Ref. B210358EN-F ©Vaisala 2013, available at:
20
http://www.vaisala.com/Vaisala Documents/Brochures and Datasheets/RS92SGP-Datasheet-B210358EN-F-LOW.pdf (last access: 6 November 2013), 2013.
Venkat Ratnam, M., Durga Santhi, Y., Rajeevan, M., and Vijaya Bhaskara Rao, S.: Diur-nal variability of stability indices observed using radiosonde observations over a tropical station: comparison with microwave radiometer measurements, Atmos. Res., 124, 21–33,
25
doi:10.1016/j.atmosres.2012.12.007, 2013.
Ware, R., Solheim, F., Carpenter, R., Güldner, J., Liljegren, J., Nehrkorn, T., and Vanden-berghe, F.: A multi-channel radiometric profiler of temperature, humidity and cloud liquid, Radio Sci., 38, 1–13, 2003.
Ware, R., Cimini, D., Campos, E., Giuliani, G., Albers, S., Nelson, M., Koch, S. E., Joe, P.,
30
AMTD
7, 6971–7011, 2014Forecast indices from ground-based
microwave radiometer
D. Cimini et al.
Title Page
Abstract Introduction
Conclusions References
Tables Figures
◭ ◮
◭ ◮
Back Close
Full Screen / Esc
Printer-friendly Version Interactive Discussion
Discussion
P
a
per
|
Discus
sion
P
a
per
|
Discussion
P
a
per
|
Discussion
P
a
per
Table 1.Summary of MWRP characteristics.
Channels 22
22.234, 22.5, 23.034, 23.834, 25.0, 26.234, 28.0,
Frequencies (GHz) 30.0, 51.248, 51.76, 52.28, 52.804, 53.336, 53.848, 54.4, 54.94, 55.5, 56.02, 56.66, 57.288, 57.964, 58.8
Bandwidth (MHz) 300 Elevation 15–90◦
AMTD
7, 6971–7011, 2014Forecast indices from ground-based
microwave radiometer
D. Cimini et al.
Title Page
Abstract Introduction
Conclusions References
Tables Figures
◭ ◮
◭ ◮
Back Close
Full Screen / Esc
Printer-friendly Version Interactive Discussion
Discussion
P
a
per
|
Discus
sion
P
a
per
|
Discussion
P
a
per
|
Discussion
P
a
per
Table 2.Statistics of the difference between FI computed from radiosonde and MWRP retrievals (NNz and 1-DVAR) in Whistler (64 radiosondes). Here are shown average (AVG) FI difference (radiosonde-MWRP), standard deviation (STD), root-mean-square (RMS), and correlation co-efficient (COR).
NNz 1-DVAR
AVG STD RMS COR AVG STD RMS COR
CAPE −283.72 216.97 379.04 0.53 −49.03 87.34 102.53 0.94 Fog Threat 0.45 2.37 2.41 0.80 0.45 2.37 2.41 0.80 Jefferson Index −6.75 5.16 8.54 0.83 1.08 3.33 3.50 0.92
K index −10.25 9.23 13.85 0.88 1.05 6.15 6.24 0.91
KO 5.41 2.28 5.91 0.91 0.60 1.79 1.89 0.94
Lifted Index 5.91 2.36 6.41 0.91 1.76 1.64 2.41 0.96
MDPI −0.11 0.11 0.16 0.80 0.00 0.11 0.11 0.83
AMTD
7, 6971–7011, 2014Forecast indices from ground-based
microwave radiometer
D. Cimini et al.
Title Page
Abstract Introduction
Conclusions References
Tables Figures
◭ ◮
◭ ◮
Back Close
Full Screen / Esc
Printer-friendly Version Interactive Discussion
Discussion
P
a
per
|
Discus
sion
P
a
per
|
Discussion
P
a
per
|
Discussion
P
a
per
Table 3. As in Table 2 but for Lindenberg (233 radiosondes). Average (AVG) FI difference (radiosonde-MWRP), standard deviation (STD), root-mean-square (RMS), and correlation co-efficient (COR) are shown.
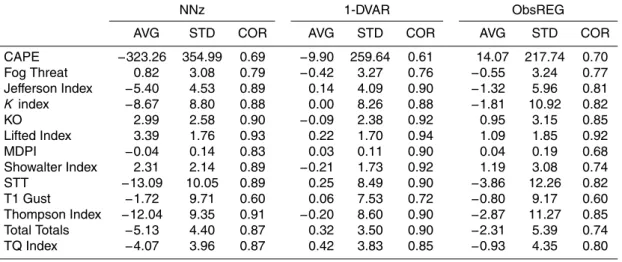
NNz 1-DVAR ObsREG
AVG STD COR AVG STD COR AVG STD COR
CAPE −323.26 354.99 0.69 −9.90 259.64 0.61 14.07 217.74 0.70 Fog Threat 0.82 3.08 0.79 −0.42 3.27 0.76 −0.55 3.24 0.77 Jefferson Index −5.40 4.53 0.89 0.14 4.09 0.90 −1.32 5.96 0.81
AMTD
7, 6971–7011, 2014Forecast indices from ground-based
microwave radiometer
D. Cimini et al.
Title Page
Abstract Introduction
Conclusions References
Tables Figures
◭ ◮
◭ ◮
Back Close
Full Screen / Esc
Printer-friendly Version Interactive Discussion
Discussion
P
a
per
|
Discus
sion
P
a
per
|
Discussion
P
a
per
|
Discussion
P
a
per