ISSN 0104-6632 Printed in Brazil
www.abeq.org.br/bjche
Vol. 26, No. 04, pp. 723 - 732, October - December, 2009
Brazilian Journal
of Chemical
Engineering
LUMPING PROCEDURE FOR A KINETIC MODEL
OF CATALYTIC NAPHTHA REFORMING
H. M. Arani
1, M. Shirvani
2*, K. Safdarian
3and E. Dorostkar
41
School of Chemical Engineering, Iran University of Science and Technology, Phone: +989132320238, 16846-13114, Narmak - Tehran, Iran.
E-mail: [email protected]
2
School of Chemical Engineering, Iran University of Science and Technology, 16846-13114, Narmak - Tehran, Iran. *E-mail:[email protected]
3
Tehran Refinery, Engineering Sec., Tehran, Iran. E-mail: [email protected]
4
Abadan Refinery, Engineering. Sec., Tehran, Iran. E-mail: [email protected]
(Submitted: April 15, 2009 ; Revised: September 13, 2009 ; Accepted: September 15, 2009)
Abstract - A lumping procedure is developed for obtaining kinetic and thermodynamic parameters of catalytic naphtha reforming. All kinetic and deactivation parameters are estimated from industrial data and thermodynamic parameters are calculated from derived mathematical expressions. The proposed model contains 17 lumps that include the C6 to C8+ hydrocarbon range and 15 reaction pathways. Hougen-Watson Langmuir-Hinshelwood type reaction rate expressions are used for kinetic simulation of catalytic reactions. The kinetic parameters are benchmarked with several sets of plant data and estimated by the SQP optimization method. After calculation of deactivation and kinetic parameters, plant data are compared with model predictions and only minor deviations between experimental and calculated data are generally observed.
Keywords:Lumping; Reaction thermodynamics; Reforming; Naphtha.
INTRODUCTION
The catalytic reforming process of naphtha is an important process for production of high octane number gasoline. This process uses naphtha with low octane as feedstock to produce rich aromatic products. Hydrogen and light hydrocarbons are also produced as by products. Reactions are carried out in three or four adiabatic fixed bed reactors at a temperature range between 450 and 520°C and a total pressure range between 10 and 35 bar. Owing to too many components in catalytic reforming process feedstock, untraceable reactions and the high temperature range, the design and simulation of catalytic reformer reactors is accompanied by complexities. The lumping technique is used extensively for reducing complexities so that the
(1983). Padmavathi and Chaudhuri (1997) developed a kinetic model in order to investigate catalytic reforming performance. Taskar and Riggs (1997) developed a rigorous kinetic model with Hougen-Watson-Langmuir-Hinshelwood (HWLH) reaction rate type, consisting of 35 lumps connected together by a network of 35 reactions. Ancheyta et al. (2000) Presented model with 21 lumps and 51 reactions. They considered equilibrium reactions in their model in the form of two individual unidirectional reactions. Hu et al. (2003) used 17 lumps involving only 17 reactions in their simulation of naphtha catalytic reforming with the reaction model described by HWLH type reaction rates. In the present work, naphtha is considered in terms of 17 hydrocarbon fractions with 15 reactions and a simple deactivation model proposed by Rahimpour (2006) is used. All kinetic and deactivation parameters were obtained by optimization to conform to plant data. Most of models are detailed and cannot be used for practical purposes due to the lack of thermodynamic and kinetic data. The main objective of this work is directed toward the elucidation of lumping procedure and obtaining kinetic and thermodynamic model parameters.
REACTION KINETIC MODEL
Kinetic Model Network
It should be realized that during reforming reactions, the carbon number of the reactants remains unchanged, except for hydrocracking reactions which break down the hydrocarbon molecule into molecules with fewer carbon atoms (Taskar, 1996). In the present kinetic model, C1 to C5 hydrocarbons are specified as light paraffins and the C6 to C8+ naphtha cuts are characterized as isoparaffins, normal paraffins, naphthenes and aromatics. Mole fractions of naphtha cuts with more than eight carbon number are very low and therefore are lumped together. The proposed reversible reaction network is shown in Fig. 1.
6 6 6 6
7 7 7 7
8 8 8 8
ip np N A
ip np N A
ip + np + N + A +
↔ ↔ ↔
↔ ↔ ↔
↔ ↔ ↔
Figure 1: Reversible reaction network
The dehydrogenation reaction is catalyzed by metal of the catalyst and is the most rapid of all
reforming reactions. This reaction is endothermic and increases formation of aromatics, and consequently, octane number. High yields of aromatics are favored by high temperature and low pressure. Paraffin isomerization is a moderately fast reaction and mildly exothermic. Probably the most difficult reaction to promote, but most desirable reaction in reforming, is dehydrocyclization of paraffins to give naphthenes. These reactions are endothermic, promoted by high temperature and low pressure.
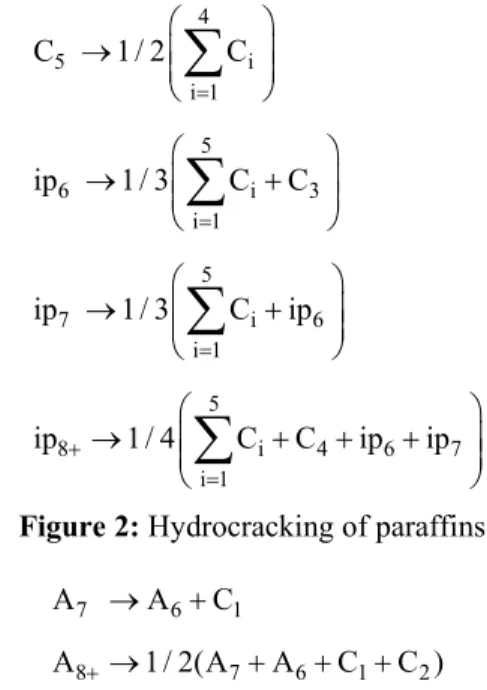
The hydrocracking of paraffins and hydrodealkylation reactions are shown in Fig. 2 and Fig. 3.
4
5 i
i 1 5
6 i 3 i 1
5
7 i 6 i 1
5
8 i 4 6 7 i 1
C 1 / 2 C
ip 1 / 3 C C
ip 1 / 3 C ip
ip 1 / 4 C C ip ip
=
=
=
+
=
⎛ ⎞
→ ⎜⎜ ⎟⎟
⎝ ⎠
⎛ ⎞
→ ⎜⎜ + ⎟⎟
⎝ ⎠
⎛ ⎞
→ ⎜⎜ + ⎟⎟
⎝ ⎠
⎛ ⎞
→ ⎜⎜ + + + ⎟⎟
⎝ ⎠
∑
∑
∑
∑
Figure 2: Hydrocracking of paraffins
7 6 1
8 7 6 1 2
A A C
A + 1 / 2(A A C C )
→ +
→ + + +
Figure 3: Hydrodealkylation reactions
The hydrocracking of paraffins and hydrodealkylation of aromatics are the slowest reactions that produce cheaper products than other reactions. These reactions are exothermic and irreversible.
Kinetic Model Rates
Table 1: Reaction rate equation
Reactions Equations
Isomerization of paraffins
2
E
ip np ip np RT
H
(P P / K ) r ke (P ) − ↔ − = Γ
Dehydrocyclization of paraffins 2 2
E
np N H np N RT
H
(P P P / K ) r ke (P ) − ↔ − = Γ
Dehydrogenation of naphthenes
2 2
E 3
np A H N A
RT
2 H
(P P P / K ) r ke (P ) − ↔ − = θ
Cracking of paraffins E ip RTP r ke − = Γ Hydrodealkylation of aromtics E
A RTP r ke − = Γ
Adsorption terms for the metal function (θ), and for the acid function (Γ), are defined as follows (Van Trimpont, Marin and Froment, 1988).
2 6
2 2
H C ip np
N H A H
(P 107P 21.9(P P )
659P 0.703P P ) / P
−
Γ = + + + +
+ (1)
2
N
11 N H
(1 0.0027P
8.314 exp( 11658.6 / T)P 10 / P )
θ = + +
− ×
(2)
Pi is the partial pressure of the components and T is the temperature.
As done by Hu et al. (2003) and Taskar (1996), all constants of adsorption terms were obtained by studying the reforming of C7 hydrocarbons.
Thermodynamics of Reactions
The reaction equilibrium constant (K) between pure components A and B can be calculated by the following thermodynamic equation.
A B A B
G
K exp( )
RT
ο −
↔ = −Δ (3)
ΔGo is the change of the standard Gibbs free energy of the reaction and R is the constant of gases. However, the equilibrium constant between two lumps cannot be calculated directly from the above equation. For this reason, in this paper the equations for the equilibrium reaction between lumps are derived. The isomerization reaction of paraffinic
hydrocarbons is as below. All of the paraffin isomers are in equilibrium with each other and react with normal paraffin.
n
isoip 1 2 3
n n n n n
(ip ↔ip ↔ip ↔ ↔... ip )↔np
For obtaining the equilibrium constant, we set
1 n
ip as the basic component to obtain simpler expressions.
n n
n n n
n
i n 1
n n n
n n i 1 n n 1 i n n 1 n np np ip np isoip
ip
ip i 1
np ip np isoip isoip
ip ip
ip ip i 2
i 1 ip
P P K P P K P 1 P P 1 K P ↔ = ↔ ↔ = = = = = = +
∑
∑
∑
(4)In this manner, the equilibrium constants for dehydrocyclization of paraffinic hydrocarbons and dehydrogenation of naphthenic hydrocarbons are obtained as follows.
n
isoN 1 2 3
n n n n n 2
np ↔(N ↔N ↔N ↔ ↔... N )+H
n
1 i 1
n n n n n n
isoN
np N N N np N i 2
K ↔ (1 K ↔ )K ↔
=
= + ∑ (5)
n n
isoN 1 2 3
n n n n isoA 1 2 3
n n n n 2
(N N N ... N )
(A A A ... A ) 3H
↔ ↔ ↔ ↔ ↔ ↔ ↔ ↔ ↔ + n 1 i n n 1 1
n n n n n
1 i n n
isoN
N N i 2
N A isoA N A A A i 2 1 K K K 1 K ↔ = ↔ ↔ ↔ = + = +
∑
∑
(6)72 components are used to compute the equilibrium constants between lumps. These computations are accomplished in the temperature range between 700 and 800 K and then equilibrium constants are fitted to the following equation.
2
K=exp((aT +bT+c) / T) (7)
Table 2: Equilibrium constant (700 to 800 K)
Reaction a b c
6 6
ip ↔np -6.6697×10⁻⁴ -1.3595×10³ 1.2428
7 7
ip ↔np -4.2331×10⁻⁴ -1.2987×10³ 4.8839×10⁻¹
8 8
ip+↔np+ -3.8102×10⁻⁴ -1.0595×10³ 1.7270×10⁻¹
6 6
np ↔N -6.7767×10³ 1.3340×101 6.7336×10⁻⁴
7 7
np ↔N -4.8473×10³ 1.1224×101 2.3194×10⁻³
8 8
np+↔N+ -2.6604×10³ 7.7493 3.2319
6 6
N ↔A -2.3535×10⁴ 5.3361×101 2.1869×10⁻³
7 7
N ↔A -2.3937×10⁴ 5.6776×101 6.2985×10⁻⁴
8 8
N+↔A+ -2.4782×10⁴ 6.0923×101 -3.4895×10⁻⁴
The enthalpy of formation, the Gibbs free energy and the Cp for each lump are calculated when all components that constitute a lump are in thermodynamic equilibrium with each other.
For instance, the enthalpy of iso-paraffins is calculated according to.
isoip 3
1 2 n 1
n
k k k k
isoip 1 2 3
n n n n
ip ↔ip ↔ip ↔... ↔− ip (8) All components are in equilibrium according to the following equations.
m 1 m
n n
m 1 m
n n
ip ip ip ip
G
K exp( )
RT
− −
ο − ↔
−Δ
= (9)
m n m 1 m
n n m 1
n
ip ip ip
ip
P K
P
−
−
↔ = (10)
n n
m m 1 m m 1 n
n n n n
isoip isoip
ip ip ip ip ip
m 1 m 1
P K −↔ P − P
= =
= =
∑
∑
(11)With simultaneous solution of these equations, it is possible to calculate every lump property such as lump enthalpy according to Eq. (12).
n m
n m
n n
n
isoip ip
f f
ip ip ip m 1
P
H H
P
=
Δ =
∑
Δ (12)CATALYST DEACTIVATION MODEL
Carbonaceous material or coke is deposited on the catalyst as an undesirable by-product of the naphtha reforming process and deteriorates the activity of catalyst. Many correlations have been proposed to model catalyst deactivation. The catalyst deactivation model employed is that proposed by Rahimpour (2006).
m d
d
0
da E 1 1
k exp( ( ))a
dt R T T
−
= − − (13)
Catalyst activity is defined as the following.
r(t) a(t)
r(0)
= (14)
where r(0) is the reaction rate at the start of a cycle when the catalyst is fresh and r(t) is the rate of reaction at time t. This deactivation model includes three parameters, k , d E and m , that are d determined using industrial plant data. In order that the calculated parameters be comparable with those of Rahimpour (2006), the reference temperature, T0, is selected to be equal to 770 K. Each reactor is divided into 40 weight intervals such that in each interval the amount of catalyst activity is constant and is function of time and catalyst temperature. Reaction rate in each interval is obtained by Eq. (14) and is then used in material and energy balance equations.
Reactor Modeling
Under usual reactor operating conditions, radial and axial dispersion effects were found to be negligible and therefore a perfect plug flow behavior could be assumed (Taskar, 1996).
Material Balance
Material balance equations for a plug flow reactor are in the following form.
r
n i
i, j j c j 1
dF
r i 1, 2,3,...n
dw=
∑
= γ = (15)Heat Balance
From the heat balance, the differential equation for temperature variations is attained as in Eq. (16):
r
j c
n
j R j 1
n i i i 1
(r H ) dT
dw
(F Cp )
=
= Δ = −
∑
∑
(16)c
r r
j
c r c
n
n n
f j R j i, j i j 1 j 1 i 1
n n n
f f i
i j i, j i i 1 j 1 i 1
(r H ) (r ( H ))
dF
H (r )) ( H )
dw
= = =
= = =
Δ = γ Δ =
Δ γ = Δ
∑
∑ ∑
∑ ∑
∑
(17)
c
c
n
f i
i i 1
n i i i 1
dF
( H )
dw dT
dw
(F Cp )
=
= Δ = −
∑
∑
(18)In the above equations
j
R H
Δ is the heat of
reaction, ΔHfi is the enthalpy of formation and Cpi is the heat capacity.
For convenience, the temperature gradient is derived with respect to the molar flow gradient and Eq. (18) in the reactor is obtained by use of Eq. (17) and Eq. (16). Thus, different reaction paths could be tested easily, such that the heat of reaction is independent of reaction path. An implicit Runge-Kutta formula with a first stage that is a trapezoidal rule step and a second stage that is a backward differentiation formula of order two, a numerical integration scheme for solving stiff ordinary differential equations, was employed to integrate the equations through each catalytic reactor.
Pressure Effects
Ergun’s equation is used for calculating the pressure drop as below.
3
p c c p
dP G 150(1 ) 1
( 1.75G)
dw d d A
− ϕ μ
= − +
ρ
ρ ϕ (19)
P is the total pressure, G is the superficial mass flux, ρ is the density of gases mixture, dp is the diameter of catalyst particle, ϕ is the bed void fraction, µ is the viscosity of the gas, Ac is the cross section of flow in the reactor and ρc is the density of the solid catalyst.
Except for the above equation, all modeling equations are similar for axial and radial flow reactors. Unlike radial flow reactors, the superficial velocity of gas and the cross section are constant in the case of axial flow reactors.
Commercial Plant Description
Domestic catalytic naphtha reforming contains three reactors in series, as shown in Fig. 4. The reactor feeds are raised to the proper temperature by heaters located before the reactors, since the reactions are endothermic. Reactors are of different sizes, with the smallest one located in the first position and the largest one in the last.
Design parameters and operating conditions for a typical catalytic naphtha reforming process are given in Table 3. The catalyst used in these reactors is of the R-62 type. The R-62 catalyst was commercialized in 1981 and contains 0.22%wt Platinum and 0.44%wt Rhenium on the basis of alumina.
Data used for simulation in this paper are composition, temperature and pressure of feed to the first reactor and effluent from the third reactor as well as the temperature of feed and effluent flows of all reactors, which were sampled for an interval of one year and a half for calculating kinetic and deactivation parameters.
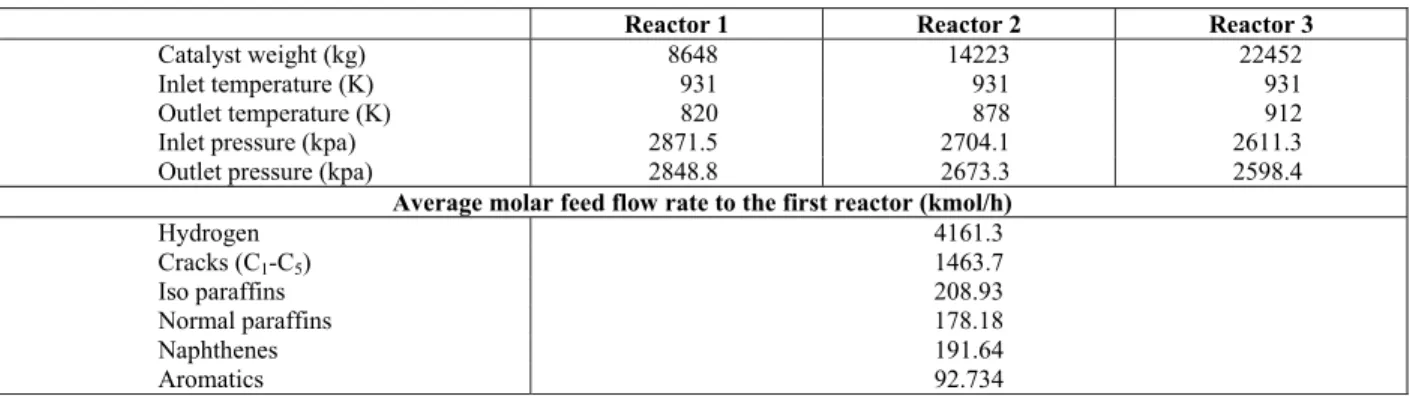
Table 3: Design parameters and operating conditions
Reactor 1 Reactor 2 Reactor 3
Catalyst weight (kg) 8648 14223 22452
Inlet temperature (K) 931 931 931
Outlet temperature (K) 820 878 912
Inlet pressure (kpa) 2871.5 2704.1 2611.3
Outlet pressure (kpa) 2848.8 2673.3 2598.4
Average molar feed flow rate to the first reactor (kmol/h)
Hydrogen 4161.3
Cracks (C1-C5) 1463.7
Iso paraffins 208.93
Normal paraffins 178.18
Naphthenes 191.64 Aromatics 92.734
Parameter Estimation
The commercial data furnished by a domestic petroleum refinery contained the data on the first reactor feed and the third reactor effluent composition, analyzed by a gas chromatographic analyzer, as well as input and output flow rate, temperature and pressure of reactors. Pre-exponential factors, activation energies and deactivation parameters constitute a total of thirty three adjustable parameters of the proposed model, which are determined by optimizing the following objective function:
s c
n n 3 calc actual
i, j i, j
calc actual 2 2
i, j i,j actual
i, j
i 1 j 1 j 1
T T
OF (y y ) ( )
T
= = =
⎛ − ⎞
⎜ ⎟
= − +
⎜ ⎟
⎝ ⎠
∑ ∑
∑
(20)The Sequential Quadratic Programming (SQP)
method is used for the purpose of optimization. Table 4 represents calculated kinetic and deactivation parameters.
Model Validation
For validating the kinetic and deactivation model, three sets of plant data are compared with model predictions. Plant operating conditions and feed flow rate of the three sets are shown in Table 5.
Output composition (mole fraction) of the third reactor and output temperature of all reactors based on the above three sets of plant data and our model are shown in Table 6 for comparison.
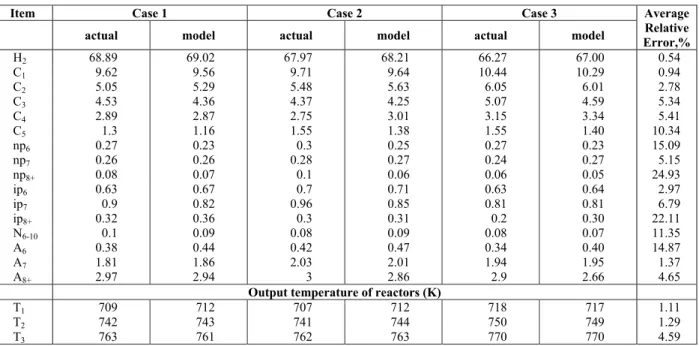
Except components that have low concentrations, only minor deviations between experimental and calculated data are generally observed and, hence, the catalyst deactivation model and the reaction kinetic model are reasonably adequate.
Table 4: Calculated kinetic and deactivation parameters
Carbon number n n
i p ↔ n p n p ↔ Nn n N n ↔ A n
Paraffins cracking Hydrodealkylation
Pre-exponential factor
Unite
catalyst kmol
kg .s catalyst
kmol
kg .s catalyst
kmol.kpa
kg .s catalyst
kmol
kg .s.kpa catalyst
kmol
kg .s.kpa
5 - - - 2.1257×10⁸ -
6 2.9220×10⁴ 3.3018×10¹² 4.9427×101 8.6567×10⁸ -
7 2.7800×10⁴ 2.8840×10¹¹ 1.7460×10⁴ 2.9917×10⁸ 1.3320×10¹¹
8+ 1.8984×10⁴ 8.9688×10¹² 1.4156×10⁴ 1.7162×10⁹ 9.3252×10⁹
Activation energy ( kJ/kmol )
5 - - - 2.7546×10⁵ -
6 8.4156×10⁴ 1.9860×10⁵ 5.3192×10⁴ 2.2051×10⁵ -
7 9.3245×10⁴ 2.0815×10⁵ 4.1328×10⁴ 2.0874×10⁵ 2.6261×10⁵ 8+ 8.8002×10⁴ 2.1170×10⁵ 4.1404×10⁴ 2.1657×10⁵ 2.3946×10⁵
Deactivation parameters
kd 1.4466 ×10⁻²day-1
Ed 1.7481×10⁶kJ/kmol
m 6.1347
Table 5: Operating conditions and feed flow rate
Item Case 1 Case 2 Case 3
feed flow rate of first reactor (kgmol/h)
H2 4173.8 3947.2 4142.4
C1 579.25 557.26 647.59
C2 292.33 299.27 351.71
C3 232.78 211.55 256.8
C4 113.68 113.52 150.73
C5 21.654 30.959 33.496
np6 15.832 17.737 14.362
np7 64.953 61.057 67.42
np8+ 91.93 81.675 86.518
ip6 4.5341 5.264 7.4244
ip7 52.799 60.201 56.213
ip8+ 143.11 147.04 157.25
N6-10 27.458 28.325 22.953
A6 88.504 96.02 94.596
A7 81.019 79.073 77.566
A8+ 4.5942 4.4409 3.1418
Input temperature of reactors (°K)
T1 774 776 781
T2 774 776 781
T3 774 775 781
Input pressure of reactors (kpa)
P1 2857 2857 2857
P2 2761 2762 2761
P3 2682 2683 2681
Time (day) 77 160 317
Table 6: Plant mole fraction and temperature data compared with model predictions
Item Case 1 Case 2 Case 3
actual model actual model actual model Average Relative Error,%
H2 68.89 69.02 67.97 68.21 66.27 67.00 0.54
C1 9.62 9.56 9.71 9.64 10.44 10.29 0.94
C2 5.05 5.29 5.48 5.63 6.05 6.01 2.78
C3 4.53 4.36 4.37 4.25 5.07 4.59 5.34
C4 2.89 2.87 2.75 3.01 3.15 3.34 5.41
C5 1.3 1.16 1.55 1.38 1.55 1.40 10.34
np6 0.27 0.23 0.3 0.25 0.27 0.23 15.09
np7 0.26 0.26 0.28 0.27 0.24 0.27 5.15
np8+ 0.08 0.07 0.1 0.06 0.06 0.05 24.93
ip6 0.63 0.67 0.7 0.71 0.63 0.64 2.97
ip7 0.9 0.82 0.96 0.85 0.81 0.81 6.79
ip8+ 0.32 0.36 0.3 0.31 0.2 0.30 22.11
N6-10 0.1 0.09 0.08 0.09 0.08 0.07 11.35
A6 0.38 0.44 0.42 0.47 0.34 0.40 14.87
A7 1.81 1.86 2.03 2.01 1.94 1.95 1.37
A8+ 2.97 2.94 3 2.86 2.9 2.66 4.65
Output temperature of reactors (K)
T1 709 712 707 712 718 717 1.11
T2 742 743 741 744 750 749 1.29
T3 763 761 762 763 770 770 4.59
RESULTS AND DISCUSSION
Temperature profiles of three reactors corresponding to the above three cases are shown in Fig. 5. According to this figure, the first reactor temperature reduces very fast because of dehydrogenation reactions that are endothermic. In
the third reactor, the temperature doesn’t reduce sharply along the reactor and even increases a little because of cracking reactions.
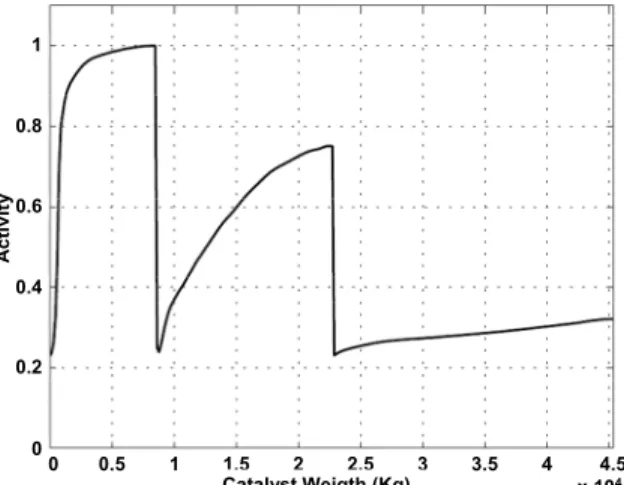
Activity profile along the reactors at time 500 days from the beginning of the cycle is shown in Fig. 6. Catalyst activity of the first reactor increases sharply to one because of the sharp slope of the temperature profile. In the third reactor, catalyst activity has a smooth slope and low quantity because of the monotonic and high reactor temperature. High temperature increases carbonaceous material or deposited coke on the catalyst.
According to Table 7, an increase in H2/HC molar ratio from one to four resulted in a decrease in reformate RON and a little decrease in aromatics, accompanied by a significant decrease in hydrogen yields. These results indicate that a higher hydrogen-to-hydrocarbon ratio reduces aromatization and increases hydrocracking. A lower hydrogen partial pressure favors dehydrogenation of naphthenes and dehydrocyclization of paraffins, but adversely affects
the life of the catalyst due to increased coking. Increasing the weight hourly space velocity from 1.35 to 5.4 h-1, as shown in Table 8, resulted in a significant loss of reformate octane quality, accompanied by a significant increase in hydrogen yields and reduction of hydrocracking yields.
Aromatization and isomerization, in general, are less affected by changes in space velocity, because these reactions are fast and can approach equilibrium even at higher space velocities, but hydrocracking reactions are slower than the other reforming reactions and are affected by changes in space velocity. Since hydrocracking reactions consume hydrogen, an increase in hydrogen yield is also observed at higher space velocities. Hence, increasing the space velocity will reduce the aromatic content of reformate while increasing the hydrogen yield.
0 0.5 1 1.5 2 2.5 3 3.5 4 4.5 5 weigth of catalyst (kg) x 104 710
720 730 740 760 770 780 790
750
T (
K
)
0 0.5 1 1.5 2 2.5 3 3.5 4 4.5 5 weigth of catalyst (kg) x 104 0 0.5 1 1.5 2 2.5 3 3.5 4 4.5 5 0 0.5 1 1.5 2 2.5 3 3.5 4 4.5 5 weigth of catalyst (kg) x 104 weigth of catalyst (kg) x 104 710
720 730 740 760 770 780 790
750
710 720 730 740 760 770 780 790
750
T (
K
)
0 0.5 1 1.5 2 2.5 3 3.5 4 4.5 Catalyst Weigth (Kg) x 104 0
0.2 0.4 1
0.8
0.6
Ac
ti
v
it
y
0 0.5 1 1.5 2 2.5 3 3.5 4 4.5 0 0.5 1 1.5 2 2.5 3 3.5 4 4.5 Catalyst Weigth (Kg) x 104 Catalyst Weigth (Kg) x 104 0
0.2 0.4 1
0.8
0.6
0 0.2 0.4 1
0.8
0.6
Ac
ti
v
it
y
Figure 5: Temperature profile of three reactors Figure 6: Activity of catalyst bed at time = 500 day
Table 7: Influence of hydrogen-to-hydrocarbon ratio
H2/Hydrocarbon 1 2 3 4
H2 yield %mol 16.53 14.84 14.1 13.2
Crack yield %mol 26.21 28.81 30.1 32.1
Reformate
n paraffins % 6.2 7.75 8.24 8.5
i paraffins 25.93 25.51 25.13 24.86
Naphthenes 1.2 1.18 1.17 1.15
Aromatics 66.13 65.56 65.42 65.01
Octane 95.52 94.41 94.1 93.23
Table 8: Influence of space velocity
WHSV (h-1) 1.35 2 2.7 5.4
H2 yield % 12.5 14.27 14.84 14.78
Crack yield % 44.62 34.6 28.81 18.33
Reformate
n paraffins %mol 5.27 6.78 7.75 10.14
i paraffins %mol 15.43 21.6 25.51 32.89
Naphthenes %mol 0.9 1.1 1.18 1.18
Aromatics %mol 78.4 70.52 65.56 55.79
CONCLUSIONS
A detailed lumping procedure for obtaining a kinetic model of semi-regenerative catalytic naphtha reforming reactions is developed. The model contains 17 lumps that are related together with 15 reaction pathways. Deactivation and kinetic parameters of the model were benchmarked with plant data. Equations for calculation of thermodynamic equilibrium constants between hydrocarbons Lumps in term of temperature are presented. In comparison with the model of Taskar (1996) and Hu et al. (2003), the model of this paper, is from the point of view of complication, somewhere between their models. This model, compared to the Taskar model, is less complicated and use of this model is easier. Also, in the Taskar model, for calculating the parameters, less industrial data is used in comparison with this model. In the model that Hu presented, the number of lumps is the same as in this model but, that model has a different kind of lump and also has different reaction pathways compared with our model. Comparison of the deviation from industrial data shows that new model has lower error and, in this paper, all of the kinetic parameters are presented. Two process variables, namely hydrogen-to-hydrocarbon ratio and space velocity, were changed and their effects on the performance of the catalyst were studied. The kinetic model is useful for simulation analysis of process variables, giving the guidance to select suitable operating conditions.
ACKNOWLEDGMENT
The support provided by the National Iranian Oil Refining & Distribution Co. for this study is gratefully acknowledged.
NOMENCLATURE
c
A Cross section of flow in reactor
n
A Aromatics a Catalyst activity
n
C Light hydrocarbons n≤5
i
Cp Heat capacity of lump i
p
d Diameter of catalyst particle
E Activation energy
d
E Exponent factor of deactivation
i
F Molar flow rate kmol/s
G Superficial mass flux kg/s.m2
2
H Hydrogen
n
ip Iso-paraffin
n
isoA Number of Aromatic isomer
n
isoN Number of Aromatic isomer
n
isoip Number of iso-paraffins isomer
n n
ip np
K ↔ Equilibrium constant for paraffin isomerization
n n
np N
K ↔ Equilibrium constant for dehydrocyclization of paraffins
(kpa)
n n
N A
K ↔ Equilibrium constant for dehydrogenation of naphthenes
kpa3
K Equilibrium constant k Pre-exponential factor of
kinetic rate
d
k Pre-exponential factor of deactivation (1/day) m Order of deactivation
n
N Naphthenes
c
n Number of components lumps
r
n Number of reaction
s
n Number of experimental data set
n
np Normal paraffins
P Pressure kpa
R Constant of gases
j
r Reaction rate kmol/sec.kg catalyst
T Temperature K
w Weight of catalyst kg
WHSV Weighted hourly space velocity
kg/h/kg
i, j
y Molar fraction
A B
Gο−
Δ Change of standard Gibbs free energy of reaction
f i
H
Δ Enthalpy of formation
j
R
H
Δ Heat of jth reaction
φ Bed void fraction
μ Viscosity of gas ρ Density of gas mixture
c
ρ Density of solid catalyst
i, j
REFERENCES
Ancheyta, J., Villafuerte, E., Kinetic Modeling of Naphtha Catalytic Reforming Reactions, Energy & Fuels, 14, 1032-1037 (2000).
Ramage, M. P., Graziani, K. R., Krambeck, F. J., Development of Mobil’s Kinetic Reforming Model, Chemical Engineering Sci., 35, 3541-48 (1980).
Rahimpour, M. R., Operability of an Industrial Catalytic Naphtha Reformer in the Presence of Catalyst Deactivation Chem. Eng. Technol. 29, No. 5, 616-624 (2006).
Taskar, U., Modeling and Optimization of a Catalytic
Naphtha Reformer, Ph.D. Thesis, Texas Tech. University, (1996).
Taskar, U., Riggs, J. B., Modeling and Optimization of a Semiregenerative Catalytic Naphtha Reformer, AIChE J., vol. 43, no.3, 740 (1997).
Van Trimpont, P. A., Marin, G. B., Froment, G. F., Reforming of C7 Hydrocarbons on a Sulfided Commercial Pt/Al2O3 Catalyst, Ind. Eng. Chem. Res., vol. 27, no. 1, 51-57 (1988).