Research Article
Macadamia Oil Supplementation Attenuates Inflammation and
Adipocyte Hypertrophy in Obese Mice
Edson A. Lima,
1Loreana S. Silveira,
2Laureane N. Masi,
3Amanda R. Crisma,
3Mariana R. Davanso,
3Gabriel I. G. Souza,
4Aline B. Santamarina,
5Renata G. Moreira,
6Amanda Roque Martins,
3Luis Gustavo O. de Sousa,
3Sandro M. Hirabara,
7and Jose C. Rosa Neto
11Departamento de Biologia Celular e do Desenvolvimento, Universidade de S˜ao Paulo, Avenida Lineu Prestes 1524,
Cidade Universit´aria, 05508-000 S˜ao Paulo, SP, Brazil
2Programa de P´os-Graduac¸˜ao em Ciˆencia da Motricidade, Departamento de Educac¸˜ao F´ısica, Universidade Estadual Paulista
(UNESP), 13506-900 Rio Claro, SP, Brazil
3Departamento de Fisiologia e Biof´ısica, Instituto de Ciˆencias Biom´edicas, Universidade de S˜ao Paulo, 05508-000 S˜ao Paulo,
SP, Brazil
4Departamento de Ciˆencias Biol´ogicas, Laborat´orio de Movimento Humano da Universidade S˜ao Judas Tadeu, 05503-001 S˜ao Paulo,
SP, Brazil
5Departamento de Fisiologia, Disciplina de Fisiologia da Nutric¸˜ao, Universidade Federal de S˜ao Paulo,
04023-901 S˜ao Paulo, SP, Brazil
6Departamento de Fisiologia Geral, Instituto de Biociˆencias, Universidade de S˜ao Paulo, 05508-090 S˜ao Paulo, SP, Brazil
7Programa de P´os-Graduac¸˜ao em Ciˆencia do Movimento Humano, Instituto de Ciˆencias da Atividade F´ısica e Esporte,
Universidade Cruzeiro do Sul, 01506-000 S˜ao Paulo, SP, Brazil
Correspondence should be addressed to Edson A. Lima; [email protected]
Received 25 April 2014; Revised 2 July 2014; Accepted 20 July 2014; Published 22 September 2014
Academic Editor: F´abio Santos Lira
Copyright © 2014 Edson A. Lima et al. his is an open access article distributed under the Creative Commons Attribution License, which permits unrestricted use, distribution, and reproduction in any medium, provided the original work is properly cited.
Excess of saturated fatty acids in the diet has been associated with obesity, leading to systemic disruption of insulin signaling, glucose intolerance, and inlammation. Macadamia oil administration has been shown to improve lipid proile in humans. We evaluated the efect of macadamia oil supplementation on insulin sensitivity, inlammation, lipid proile, and adipocyte size in high-fat diet (HF) induced obesity in mice. C57BL/6 male mice (8 weeks) were divided into four groups: (a) control diet (CD), (b) HF, (c) CD supplemented with macadamia oil by gavage at 2 g/Kg of body weight, three times per week, for 12 weeks (CD + MO), and (d) HF diet supplemented with macadamia oil (HF + MO). CD and HF mice were supplemented with water. HF mice showed hypercholesterolemia and decreased insulin sensitivity as also previously shown. HF induced inlammation in adipose tissue and peritoneal macrophages, as well as adipocyte hypertrophy. Macadamia oil supplementation attenuated hypertrophy of adipocytes and inlammation in the adipose tissue and macrophages.
1. Introduction
he role of a diet with a higher content of unsaturated fatty acids, in place or concomitant to a diet with high content of lipids, has been appointed as an efective strategy to control metabolic disorders [1]. Monounsaturated fatty acids (MUFA) rich diet has been reported to decrease plasma
total cholesterol and LDL-cholesterol and increase HDL-cholesterol levels [2–5]. Moreover, when saturated fatty acids are replaced by MUFA in the diet of obese women, levels of inlammatory markers decrease, including IL-6 and visfatin in serum [6]. Macadamia nut oil is rich in monounsaturated fatty acids, containing approximately 65% of oleic acid (C18:1) and 18% palmitoleic acid (C16:1) of the total content of fatty Volume 2014, Article ID 870634, 9 pages
acids [7]. Macadamia oil is the main source of palmitoleic acid in the human diet. Some studies have shown that diet rich in macadamia can improve the lipid proile [2,8–10], but to date there is no studies on the efect of supplementation of macadamia oil on adipocyte hypertrophy and inlammation. In 2008, Cao and colleagues [11] showed that mice dei-cient in lipid chaperones aP2 and mal1 present increased levels of palmitoleic acid in serum. Elevated levels of cir-culating palmitoleic acid restored sensitivity of insulin in liver and skeletal muscle, hepatosteatosis, and hyperglycemia, generated by high-fat diet. With this, the authors named this fatty acid as a lipokine, since palmitoleic acid has a hormonal-like efect [11].
he administration of high-fat diet in C57BL6 mice induces metabolic perturbations similar to those observed in humans. In fact, consumption of the high levels of saturated fatty acids is associated with overweight, visceral obesity, inlammation, dyslipidemia, and insulin resistance, in skele-tal muscle, liver, and adipose tissue [12–17]. Saturated FFA promotes inlammation by interaction with toll-like receptor 4 (TLR4), activating NF�B, JNK, and AP-1 pathways [18,19]. A low grade inlammation is established with increase in plasma levels of IL-6, IL-1�, prostaglandins, TNF-�, and leptin and decrease in the production and secretion of adi-ponectin, IL-10, and IL-4 [20, 21]. he increase in local inlammation is potentiated by the recruitment of macro-phages to adipose tissue and polarization of M2 macromacro-phages (macrophages type 2) to M1 macrophages (macrophages type 1) [16,22,23].
he aim of our study was to evaluate the efect of mac-adamia oil supplementation, rich in MUFA (palmitoleic and oleic acids), on adipose tissue and peritoneal macrophages inlammation in mice fed a balanced diet or high-fat diet rich in saturated fatty acids. We measured glucose uptake (2-6 deoxyglucose uptake) and mRNA content of proteins (GLUT-4; IRS-1) involved in insulin signaling in soleus muscle. he contents of IL-10, IL-6, TNF-�, and IL-1�in peri-toneal macrophages and adipose tissue were also determined. he adipocyte size was also evaluated.
2. Materials and Methods
2.1. Animals. All experiments were performed according to protocols approved by the Animal Care and Use Committee of the Institute of Biomedical Sciences, University of S˜ao Paulo. C57BL/6 male mice (8 weeks old) were used in this study. Animals were housed with light-dark cycle of 12-12 h and temperature of 23 ± 2∘C. Animals were divided into four groups: (a) control diet (CD), (b) high-fat diet (HFD), (c) control diet supplemented with macadamia nut oil (Vital
ˆ
Atman, Uchoa, SP, Brazil) (CD + MO), and (d) high-fat diet supplemented with macadamia oil (HF + MO). Control groups were run concomitantly. he oil composition is shown
inTable 1. During the irst 4 weeks preceding the induction
of obesity by HFD, all groups weread libitumfed a control diet (76% carbohydrates, 9% fat, and 15% proteins). Similar protocol has been used in our previous studies [24,25]. CD + MO and HF + MO were supplemented by oral gavage at 2 g per Kg of body weight, three times per week, during
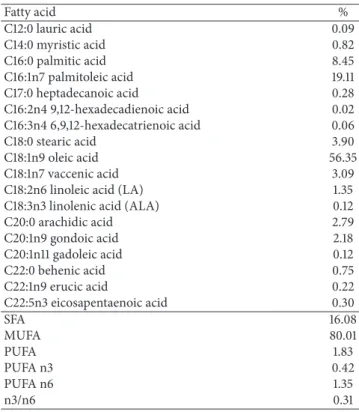
Table 1: Fatty acid composition of macadamia oil.
Fatty acid %
C12:0 lauric acid 0.09
C14:0 myristic acid 0.82
C16:0 palmitic acid 8.45
C16:1n7 palmitoleic acid 19.11 C17:0 heptadecanoic acid 0.28 C16:2n4 9,12-hexadecadienoic acid 0.02 C16:3n4 6,9,12-hexadecatrienoic acid 0.06
C18:0 stearic acid 3.90
C18:1n9 oleic acid 56.35
C18:1n7 vaccenic acid 3.09
C18:2n6 linoleic acid (LA) 1.35 C18:3n3 linolenic acid (ALA) 0.12
C20:0 arachidic acid 2.79
C20:1n9 gondoic acid 2.18
C20:1n11 gadoleic acid 0.12
C22:0 behenic acid 0.75
C22:1n9 erucic acid 0.22
C22:5n3 eicosapentaenoic acid 0.30
SFA 16.08
MUFA 80.01
PUFA 1.83
PUFA n3 0.42
PUFA n6 1.35
n3/n6 0.31
SFA = saturated fatty acids, sum of C12:0, C14:0, C16:0, C17:0, C18:0, C20:0, and C22:0; MUFA = monounsaturated fatty acids, sum of C16:1, C18:1n7, C18:1n9, C20:1n9, C20:1n11, and C22:1n9; PUFA = polyunsaturated fatty acids, sum of C16:3n4, C18:2n6, C18:3n3, and C22:5n3; PUFA n3 = sum of C18:3n3 and C22:5n3; PUFA n6 = C18:2n6.
12 weeks. his dosage of oil was chosen based on previous studies from our group using diferent oils with no signs of hepatic toxicity [24]. CD and HF diet received water at the same dose.
2.2. Serum Parameters Analysis. Serum triacylglycerol, total cholesterol, LDL-cholesterol, and HDL-cholesterol were determined by colorimetric assays (Labtest Diagnostics, Lagoa Santa, MG, Brazil). Serum glucose and insulin were measured using LABTEST colorimetric assay and radioim-munoassay (Millipore, Billerica, MA, USA), respectively, as described by Masi et al. (2012) [24]. he HOMA index was determined by calculating fasting serum insulin (�U/mL) ×fasting plasma glucose (mmol L−1)/22.5. Leptin and adi-ponectin were measured using the protocol of the manufac-turing R&D system.
2.3. GTT and ITT. Glucose tolerance test (GTT) and insulin tolerance test (ITT) were carried out in all groups ater 6 h fasting at the end of the 10th and 11th weeks of treatment, respectively.
he methodologies used for GTT and ITT were similar to that described by Masi et al. (2012) [24].
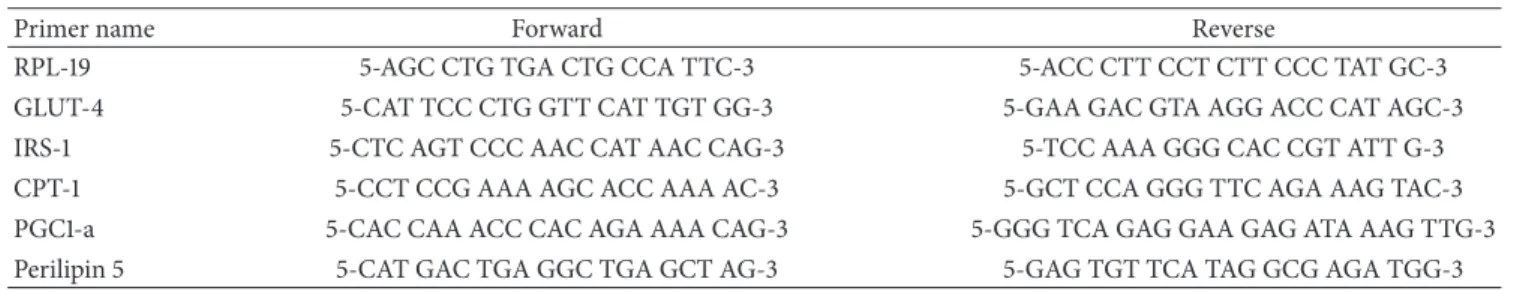
Table 2: Primer sequences of the genes studies for real-time PCR.
Primer name Forward Reverse
RPL-19 5-AGC CTG TGA CTG CCA TTC-3 5-ACC CTT CCT CTT CCC TAT GC-3 GLUT-4 5-CAT TCC CTG GTT CAT TGT GG-3 5-GAA GAC GTA AGG ACC CAT AGC-3 IRS-1 5-CTC AGT CCC AAC CAT AAC CAG-3 5-TCC AAA GGG CAC CGT ATT G-3 CPT-1 5-CCT CCG AAA AGC ACC AAA AC-3 5-GCT CCA GGG TTC AGA AAG TAC-3 PGC1-a 5-CAC CAA ACC CAC AGA AAA CAG-3 5-GGG TCA GAG GAA GAG ATA AAG TTG-3 Perilipin 5 5-CAT GAC TGA GGC TGA GCT AG-3 5-GAG TGT TCA TAG GCG AGA TGG-3
2.5. Haematoxylin and Eosin Staining. Adipose samples were ixed in formalin and parain embedded. Sections were prepared (5�M) using Leica EG1150H Machine. Haema-toxylin and Eosin (H&E) staining was conducted using Leica Autostainer XL and Leica CV5030. Sections were mounted using DPX media (Fisher Scientiic, Ireland) and analyzed using Nikon 80i transmission light microscope.
2.6. Extraction of Fatty Acids from Gastrocnemius Muscle and Gas Chromatographic Analysis. Gastrocnemius muscle fragments (100 mg) were subjected to lipid extraction. For this, 0.5 mL chloroform/methanol (2 : 1; v/v) was added to 100 mg of gastrocnemius sample, well-vortexed and incu-bated at room temperature for 5 min. Additional volumes of 1.25 mL chloroform and 1.25 mL deionized H2O were then added, and inally, following vigorous homogenization for 3 min, samples were centrifuged at 1200 g for 5 min, at room temperature to obtain two phases: aqueous phase in the top and organic phase in the bottom containing. he organic phase was collected, dried, and suspended in isopropanol. Triglyceride content was then determined in the homogenate. Ater that, for fatty acid composition determination, gastroc-nemius lipid extracts were dried using atmospheric N2 for evaporation of the solvent without fatty acid oxidation. he fractions of neutral and polar lipids were separated from these extracts by using a column chromatography. he polar (phospholipids) and neutral (triglycerides) fractions were methylated (for formation of methyl esters), using acetyl chloride and methanol. he methyl esters were analyzed in a gas chromatographer coupled to a lame ionizer detector (FID) (Varian GC 3900). Fatty acid composition was then determined by using standard mixtures of fatty acids with known retention times (Supelco, 37 Components).
For the analysis of fatty acids, a programmed chromatog-raphy was used with the characteristics described below. he reading was initiated at 170∘C temperature for 1 minute and then a ramp of 2.5∘C/min was employed to reach a inal temperature of 220∘C that was maintained for 5 min. he injector and detector were maintained at 250∘C. We used the
CP wax 52 CBcolumn, with a 0.25 mm thickness, internal diameter of 0.25 mm, and 30 mm long, with hydrogen as the carrier gas.
2.7. Analysis of Inlammatory Parameters
2.7.1. Adipokines Content Measurements. Mice were eutha-nized on CO2chamber and retroperitoneal adipose tissue was
rapidly collected. About 100 mg of retroperitoneal adipose tissue was used for the determination of TNF-�, IL-6, and IL-10 content. Adipose tissue was homogenized in RIPA bufer (0.625% Nonidet P-40, 0.625% sodium deoxycholate, 6.25 mM sodium phosphate, and 1 mM ethylenediaminete-traacetic acid at pH 7.4), containing 10 g/mL of a protease inhibitor cocktail (Sigma-Aldrich, St. Louis, MO, USA). Homogenates were centrifuged at 12.000 g for 10 min at 4∘C, supernatant was collected, and protein concentration was determined using Bradford assay (Bio-Rad, Hercules, CA, USA). Bovine serum albumin was used as protein standard.
Ex Vivo Adipose Tissue Culture. Retroperitoneal adipose tissue explants (about 100 mg) were cultured in DMEM sterile medium (Gibco), containing 10% FBS, 2 mM glutamine, streptomycin, and penicillin for 24 h, at 37∘C and 5% CO2, humidiied air environment. hereater, medium culture was collected and used for the determination of IL-1�and IL-10, using ELISA assays (DuoSet kits, R&D System).
2.7.2. Peritoneal Macrophage Isolation and Culture. Cytokine and nitric oxide (NO) production were evaluated in macrophages obtained by washing the peritoneal cavity with 6 mL RPMI culture medium (Gibco), containing 10% FBS and 4 mM glutamine. Macrophage-rich cultures (more than 90% of the cells were F4/80+) were obtained by incubating peritoneal cells in 24-well polystyrene culture plates for 2 h at 37∘C in a 5% CO2, humidiied air environment. Nonadherent cells were removed by washing with RPMI. Adherent cells were then incubated with 2.5�g/mL of LPS (E. coli, serotype 0111:B4, Sigma Chemical Company, USA) for 24 h [26]. Medium was collected for determination of IL-6, IL-10, IL-1B and TNF-�by ELISA and nitrite content by Griess method [27].
2.8. Quantitative RT-PCR. Total RNA from the gastrocne-mius muscle was extracted with Trizol reagent (Invitrogen Life Technologies, Grand Island, NY, USA), following the method described by Chomczynski and Sacchi [28]. Reverse transcription to cDNA was performed using the high-capac-ity cDNA kit (Applied Biosystems, Foster, CA, USA). Gene expression was evaluated by real-time PCR [29], using Rotor Gene (Qiagen) and SYBR Green (Invitrogen Life Technolo-gies) as luorescent dye. Primer sequences are shown in
Table 2. Quantiication of gene expression was carried out
Table 3: Efect of high fat diet, with or without supplementation of macadamia oil, on obesity characteristics.
CD CD + MO HF HF + MO
Initial body weight (g) 24.26±5.02 24.77±3.37 24.2±3.42 24.4±4.41 Final body weight (g) 26.2±1.99 26.82±3.32 34.49±6.96∗# 34.75±4.96∗# Liver weight (g) 1.17±0.14 1.10±0.23 1.33±0.52 1.24±0.26 Mesenteric adipose tissue weight (g) 0.32±0.14 0.28±0.12 0.55±0.28∗# 0.52±0.23∗#
Epididymal adipose tissue weight (g) 0.63±0.14 0.73±0.34 1.45±0.60∗# 1.59±0.70∗#
Retroperitoneal adipose tissue weight (g) 0.21±0.06 0.24±0.12 0.53±0.22∗# 0.55±0.17∗# Adiposity index (g) 1.16±0.24 1.25±0.53 2.53±1.01∗# 2.65±1.01∗# Brown adipose tissue weight (g) 0.104±0.06 0.116±0.03 0155±0.06 0.128±0.02
Values represent the means±S.D. of the data obtained from analysis of 15 animals per group.∗� < 0.001versus CD;#� < 0.001versus CD + MO.
CD
HF
CT MO
(a)
CT MO
Adipocyte area
0 2000 4000 6000 8000
CD HF
∗
(
�
m
2 )
(b)
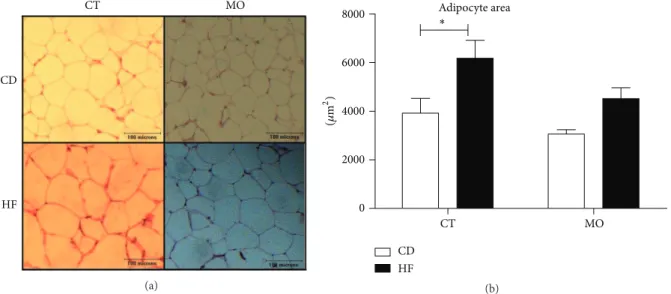
Figure 1: Efect of MO supplementation on adipose tissue histology. (a) Histological sections stained with H&E. (b) Area of adipocytes. CD = group of animals maintained on control diet; HF = group of animals fed high-fat diet; CD + MO = group of animals fed control diet supplemented with macadamia oil; HF + MO = group of animals fed high-fat diet supplemented with macadamia oil. he data are given as the means±S.D.∗� < 0.05(� = 6).
2.9. Statistical Analysis. Results are presented as mean ± S.D. All groups were compared by using two-way ANOVA followed by Bonferroni posttest. Signiicance level was set at � < 0.05.
3. Result
3.1. Characterization of the Experimental Model
3.1.1. Body Composition. Mice fed high-fat diet showed increased body weight gain, hypercholesterolemia, and insu-lin resistance. hese modiications were similar to those observed in our previous studies [24, 25]. Animals fed the high-fat diet (HF and HF + MO) for eight weeks showed increased (by 2-fold) body weight gain and visceral adiposity index as compared with CD and CD + MO (Table 3). he weights of the liver and the brown adipose tissue depot were not altered with diet or supplementation (Table 3). Although the visceral adiposity index of mice fed high-fat diet (HF and HF + MO) was greater than in animals that received control
diet (CD and CD + MO), the HF group had an increase (by 1,62-fold) of adipocytes size compared to the control diet (Figures 1(a) and 1(b)), with statistical diference not evidenced in HF + MO group. No diference was evidenced by diet or supplementation in LDL-c, NEFA, and glycerol (data not shown). Moreover, the basal glycemia and�ittwere
increased in both groups treated with high-fat diet (data not shown). Homa-IR index was increased in the HF group (by 3-fold) as compared to the other groups including the HF +
MO (Figure 2(a)). his result suggests a beneicial efect of
macadamia oil supplementation on insulin responsiveness in the HF group.
100
80
60
40
20
0
CT MO
CD HF
HOMA-IR ∗
(a)
1.5
1.0
0.5
0.0
CT MO
CD HF
GLUT-4expression
∗
GL
UT
-4
/RPL
-19
(A.U
.)
(b)
2.5
2.0
1.5
1.0
0.5
0.0
CT MO
CD HF
(m
g/m
g tissue)
Total TAG ∗∗
(c)
Figure 2: Insulin sensitivity and triacylglycerol content in skeletal muscle ater 12 weeks. (a) HOMA-IR: homeostatic model assessment of insulin resistance; (b) GLUT-4 gene expression; (c) triacylglycerol content in gastrocnemius muscle. he data are given as the means±S.D. In all experiments the animals were previously fasted for 6 hours. CD = group of animals maintained on control diet; HF = group of animals fed high-fat diet; CD + MO = group of animals fed control diet supplemented with macadamia oil; HF + MO = group of animals fed high-fat diet supplemented with macadamia oil. A.U. = arbitrary unit.∗� < 0.05;∗∗� < 0.01(� = 6).
content in gastrocnemius muscle, but this efect was blunted in HF + MO (Figure 2(c)). he fatty acid composition in neutral or polar lipid fractions remains unchanged regardless of the diet given and MO supplementation (see Table 1 in Supplementary Material available online athttp://dx.doi.org/
10.1155/2014/870634).
3.2. Macadamia Oil Supplementation Attenuates High-Fat Diet Induced Inlammation. he contents of the anti-inlam-matory cytokine IL-10 were increased in the HF + MO group (approximately 4,09-fold) (Figure 3(a)), while IL-1b concentration in the medium of adipose tissue explants was increased in the HF group (Figure 3(b)).
When stimulated with LPS, macrophages from all groups showed increased IL-6 production (by 2.97-fold)
(Figure 4(d)), whereas IL-10 and NO production were
ele-vated in cells from the HF and CT + MO groups (2.39-and 4.08-fold compared to base line, resp.) (Figures4(a)and
4(e)). No efect of LPS stimulation was observed on TNF-� production by macrophages from all groups (Figure 4(c)).
Moreover, macrophages from the HF group showed an increase (by 2,41-fold) of IL-1� production compared to unstimulated cells whereas the supplementation with MO abolished this elevation (Figure 4(d)). Similar results were found in NO production. MO attenuated nitrate production by LPS stimulation on macrophages from the HF group
(Figure 4(a)). he production of IL-10 was decreased in the
CT group compared to CT + MO and HF groups (by 1,88-fold) (Figure 4(e)). TNF-� and IL-6 production remained unchanged by diet or supplementation (Figures 4(c) and
IL-10in RPAT
CT MO
0 50 100 150
CT HF
(pg/m
g p
ro
tein adi
p
o
se
tissue)
∗
∗ ∗
(a)
IL-1�in adipose tissue medium
CT MO
0 100 200 300 400
CD HF
(pg/m
g p
ro
tein adi
p
o
se
tissue)
∗
(b)
Figure 3: Inlammatory parameters in adipose tissue homogenate and adipose tissue explant incubation medium. IL10 content in adipose tissue homogenate (a) and IL1-�in the adipose tissue explant incubation medium, ater 24 hours measured by ELISA (b). he animals received water or macadamia oil orally, 2 g/kg b.w., with or without association with a high-fat diet. CD = group of animals maintained on control diet; HF = group of animals fed high-fat diet; CD + MO = group of animals fed control diet supplemented with macadamia oil; HF + MO = group of animals fed high-fat diet supplemented with macadamia oil. he data are given as the means±S.D.∗� < 0.05(� = 5-6).
No signiicant diference was found in serum levels of adiponectin ater 12 weeks of treatment (data not shown). As expected, leptin concentration was increased (by 5.69-fold) in the groups fed the high-fat diet (data not shown). he sig-niicant diference between the CD + MO and the CD + CT groups suggests that MO can enhance circulant leptin.
4. Discussion
We showed herein that twelve weeks of macadamia oil sup-plementation attenuate the increase in inlammation and adipocyte hypertrophy in mice fed a high-fat diet that exhibit signs of the metabolic syndrome.
High consumption of fat, sucrose, and industrialized foods in association with sedentary lifestyle is the main con-tributor to obesity and its related comorbidities, including dyslipidemias, insulin resistance, and cardiovascular diseases; evidence has been accumulated that low grade inlammation plays a key role in the obesity induced comorbidities [11,31–
37].
he increase in adipocytes size was attenuated by macad-amia oil treatment. he increase in adipocyte diameter has been associated with disturbances in cellular homeostasis, such as insulin resistance, inlammation, and hypoxia [38]. he prevalence of large adipocytes increases leptin produc-tion and secreproduc-tion, as observed in our study [39]. he increase in leptin is associated with an elevation in low grade inlam-mation. Leptin is known to stimulate proinlammatory cytok-ines production in lymphocytes [40–42], monocytes [43], and macrophages [44].
Mice fed the HFD for 8 weeks exhibited increased IL-10 content in retroperitoneal adipose tissue. his result may be associated with the increase in peroxisome proliferator activated receptor- (PPAR-) gamma activity. his nuclear receptor increased the number of small adipocytes and raised the IL-10 [45, 46]. he increase of IL-10 content in adipose tissue leads to macrophage polarization (type 2) that is important for remodeling and tissue repair [47,48]. Moreover, the increase in IL-10 content in adipocytes is associated with increased insulin sensitivity in adipose tissue [49,50].
CD HF 0
10 20 30 40
CD+MO HF+MO
∗ ∗
NO
(
�
M)
(a)
CD+MO HF+MO
∗∗∗ ∗∗∗
∗∗∗
∗
CD HF
0 200 400 600
IL1
�
(pg/mL)
(b)
CD HF
0 50 100 150 200
TNF
-𝛼
(pg/mL)
CD+MO HF+MO
−LPS
+LPS
(c)
CD+MO HF+MO
−LPS
+LPS
CD HF
0 500 1000 1500 2000 2500
IL
-6 (pg/mL)
(d)
CD HF
0 200 400 600 800 1000
IL
-10 (pg/mL)
CD+MO HF+MO
−LPS
+LPS
∗
∗
(e)
In conclusion, macadamia oil supplementation attenu-ated inlammation and adipocyte hypertrophy in obese mice.
Conflict of Interests
he authors declare that they have no conlict of interests with the presented data.
Acknowledgments
he authors are grateful to Professor Rui Curi for the revision of the paper and for his constant support and encourage-ment. his work was supported by grants from Fundac¸˜ao de Amparo a Pesquisa do Estado de S˜ao Paulo (FAPESP) and Conselho Nacional de Desenvolvimento Cient´ıico e Tecnol´ogico (CNPQ).
References
[1] C. Arapostathi, I. P. Tzanetakou, A. D. Kokkinos et al., “A diet rich in monounsaturated fatty acids improves the lipid proile of mice previously on a diet rich in saturated fatty acids,”
Angiology, vol. 62, no. 8, pp. 636–640, 2011.
[2] J. Hiraoka-Yamamoto, K. Ikeda, H. Negishi et al., “Serum lipid efects of a monounsaturated (palmitoleic) fatty acid-rich diet based on macadamia nuts in healthy, young japanese women,”
Clinical and Experimental Pharmacology and Physiology, vol. 31,
supplement 2, pp. S37–S38, 2004.
[3] R. P. Mensink, P. L. Zock, A. D. M. Kester, and M. B. Katan, “Efects of dietary fatty acids and carbohydrates on the ratio of serum total to HDL cholesterol and on serum lipids and apolipoproteins: a meta-analysis of 60 controlled trials,”he
American Journal of Clinical Nutrition, vol. 77, no. 5, pp. 1146–
1155, 2003.
[4] T. A. Nicklas, J. S. Hampl, C. A. Taylor, V. J. hompson, and W. C. Heird, “Monounsaturated fatty acid intake by children and adults: temporal trends and demographic diferences,”Nutrition
Reviews, vol. 62, no. 4, pp. 132–141, 2004.
[5] L. G. Gillingham, S. Harris-Janz, and P. J. H. Jones, “Dietary monounsaturated fatty acids are protective against metabolic syndrome and cardiovascular disease risk factors,”Lipids, vol. 46, no. 3, pp. 209–228, 2011.
[6] F. Haghighatdoost, M. J. Hosseinzadeh-Attar, A. Kabiri, M. Eshraghian, and A. Esmaillzadeh, “Efect of substituting satu-rated with monounsatusatu-rated fatty acids on serum visfatin levels and insulin resistance in overweight women: a randomized cross-over clinical trial,”International Journal of Food Sciences
and Nutrition, vol. 63, no. 7, pp. 772–781, 2012.
[7] L. S. Maguire, S. M. O’Sullivan, K. Galvin, T. P. O’Connor, and N. M. O’Brien, “Fatty acid proile, tocopherol, squalene and phytosterol content of walnuts, almonds, peanuts, hazelnuts and the macadamia nut,”International Journal of Food Sciences and
Nutrition, vol. 55, no. 3, pp. 171–178, 2004.
[8] A. E. Griel, Y. Cao, D. D. Bagshaw, A. M. Cifelli, B. Holub, and P. M. Kris-Etherton, “A Macadamia nut-rich diet reduces total and LDL-cholesterol in mildly hypercholesterolemic men and women,”Journal of Nutrition, vol. 138, no. 4, pp. 761–767, 2008. [9] J. D. Curb, G. Wergowske, J. C. Dobbs, R. D. Abbott, and B. Huang, “Serum lipid efects of a high-monounsaturated fat diet based on macadamia nuts,”Archives of Internal Medicine, vol. 160, no. 8, pp. 1154–1158, 2000.
[10] N. R. Matthan, A. Dillard, J. L. Lecker, B. Ip, and A. H. Lichtenstein, “Efects of dietary palmitoleic acid on plasma lipo-protein proile and aortic cholesterol accumulation are similar to those of other unsaturated fatty acids in the f1b golden syrian hamster,”he Journal of Nutrition, vol. 139, no. 2, pp. 215–221, 2009.
[11] H. Cao, K. Gerhold, J. R. Mayers, M. M. Wiest, S. M. Watkins, and G. S. Hotamisligil, “Identiication of a lipokine, a lipid hormone linking adipose tissue to systemic metabolism,”Cell, vol. 134, no. 6, pp. 933–944, 2008.
[12] M. D. Jensen, “Role of body fat distribution and the metabolic complications of obesity,”Journal of Clinical Endocrinology and
Metabolism, vol. 93, no. 11, pp. S57–S63, 2008.
[13] C. L. Kien, “Dietary interventions for metabolic syndrome: role of modifying dietary fats,”Current Diabetes Reports, vol. 9, no. 1, pp. 43–50, 2009.
[14] V. T. Samuel, K. F. Petersen, and G. I. Shulman, “Lipid-induced insulin resistance: unravelling the mechanism,”he Lancet, vol. 375, no. 9733, pp. 2267–2277, 2010.
[15] D.-H. Han, P. A. Hansen, H. H. Host, and J. O. Holloszy, “Insulin resistance of muscle glucose transport in rats fed a high-fat diet: a reevaluation,”Diabetes, vol. 46, no. 11, pp. 1761–1767, 1997. [16] M. F. Gregor and G. S. Hotamisligil, “Inlammatory
mecha-nisms in obesity,”Annual Review of Immunology, vol. 29, pp. 415–445, 2011.
[17] H. H. Lim, S. O. Lee, S. Y. Kim, S. J. Yang, and Y. Lim, “Anti-inlammatory and antiobesity efects of mulberry leaf and fruit extract on high fat diet-induced obesity,”Experimental Biology
and Medicine, vol. 238, no. 10, pp. 1160–1169, 2013.
[18] S. M. Reyna, S. Ghosh, P. Tantiwong et al., “Elevated toll-like receptor 4 expression and signaling in muscle from insulin-resistant subjects,”Diabetes, vol. 57, no. 10, pp. 2595–2602, 2008. [19] J. Jin, X. Zhang, Z. Lu et al., “Acid sphingomyelinase plays a key role in palmitic acid-ampliied inlammatory signaling triggered by lipopolysaccharide at low concentrations in macro-phages,” American Journal of Physiology: Endocrinology and
Metabolism, vol. 305, no. 7, pp. E853–E867, 2013.
[20] H. Waki and P. Tontonoz, “Endocrine functions of adipose tissue,”Annual Review of Pathology, vol. 2, pp. 31–56, 2007. [21] N. Ouchi, J. L. Parker, J. J. Lugus, and K. Walsh, “Adipokines in
inlammation and metabolic disease,”Nature Reviews Immunol-ogy, vol. 11, no. 2, pp. 85–97, 2011.
[22] S. P. Weisberg, D. McCann, M. Desai, M. Rosenbaum, R. L. Leibel, and A. W. Ferrante Jr., “Obesity is associated with macro-phage accumulation in adipose tissue,”Journal of Clinical
Inves-tigation, vol. 112, no. 12, pp. 1796–1808, 2003.
[23] D. Patsouris, P.-P. Li, D. hapar, J. Chapman, J. M. Olefsky, and J. G. Neels, “Ablation of CD11c-positive cells normalizes insulin sensitivity in obese insulin resistant animals,”Cell Metabolism, vol. 8, no. 4, pp. 301–309, 2008.
[24] L. N. Masi, A. R. Martins, J. C. R. Neto et al., “Sunlower oil supplementation has proinlammatory efects and does not reverse insulin resistance in obesity induced by high-fat diet in C57BL/6 mice,”Journal of Biomedicine and Biotechnology, vol. 2012, Article ID 945131, 9 pages, 2012.
[25] M. A. R. Vinolo, H. G. Rodrigues, W. T. Festuccia et al., “Tributyrin attenuates obesity-associated inlammation and insulin resistance in high-fat-fed mice,”he American Journal
of Physiology—Endocrinology and Metabolism, vol. 303, no. 2,
[26] J. M. Papadimitriou and I. Van Bruggen, “he efects of mal-nutrition on murine peritoneal macrophages,” Experimental
and Molecular Pathology, vol. 49, no. 2, pp. 161–170, 1988.
[27] N. P. Sen and B. Donaldson, “Improved colorimetric method for determining nitrate and nitrate in foods,” Journal of the
Association of Oicial Analytical Chemists, vol. 61, no. 6, pp.
1389–1394, 1978.
[28] P. Chomczynski and N. Sacchi, “Single-step method of RNA isolation by acid guanidinium thiocyanate-phenol-chloroform extraction,”Analytical Biochemistry, vol. 162, no. 1, pp. 156–159, 1987.
[29] R. Higuchi, G. Dollinger, P. S. Walsh, and R. Griith, “Simulta-neous ampliication and detection of speciic DNA sequences,”
Bio/Technology, vol. 10, no. 4, pp. 413–417, 1992.
[30] W. Liu and D. A. Saint, “Validation of a quantitative method for real time PCR kinetics,”Biochemical and Biophysical Research
Communications, vol. 294, no. 2, pp. 347–353, 2002.
[31] M. Matsuda and I. Shimomura, “Increased oxidative stress in obesity: Implications for metabolic syndrome, diabetes, hypertension, dyslipidemia, atherosclerosis, and cancer,”
Obe-sity Research and Clinical Practice, vol. 7, no. 5, pp. e330–e341,
2013.
[32] C. Fernandes-Santos, R. E. Carneiro, L. de Souza Mendonca, M. B. Aguila, and C. A. Mandarim-de-Lacerda, “Pan-PPAR agonist beneicial efects in overweight mice fed a high-fat high-sucrose diet,”Nutrition, vol. 25, no. 7-8, pp. 818–827, 2009.
[33] J. C. Fraulob, R. Ogg-Diamantino, C. Fernandes-Santos, M. B. Aguila, and C. A. Mandarim-de-Lacerda, “A mouse model of metabolic syndrome: insulin resistance, fatty liver and Non-Alcoholic Fatty Pancreas Disease (NAFPD) in C57BL/6 mice fed a high fat diet,”Journal of Clinical Biochemistry and Nutri-tion, vol. 46, no. 3, pp. 212–223, 2010.
[34] G. D. Pimentel, A. P. S. Dornellas, J. C. Rosa et al., “High-fat diets rich in soy or ish oil distinctly alter hypothalamic insulin signaling in rats,”Journal of Nutritional Biochemistry, vol. 23, no. 7, pp. 822–828, 2012.
[35] L. Chen, D. J. Magliano, and P. Z. Zimmet, “he worldwide epidemiology of type 2 diabetes mellitus—present and future perspectives,”Nature Reviews Endocrinology, vol. 8, no. 4, pp. 228–236, 2012.
[36] C. J. Rebello, F. L. Greenway, and J. W. Finley, “A review of the nutritional value of legumes and their efects on obesity and its related co-morbidities,”Obesity Reviews, vol. 15, no. 5, pp. 392– 407, 2014.
[37] K. E. Wellen and G. S. Hotamisligil, “Inlammation, stress, and diabetes,”Journal of Clinical Investigation, vol. 115, no. 5, pp. 1111– 1119, 2005.
[38] S. L. Gray and A. J. Vidal-Puig, “Adipose tissue expandability in the maintenance of metabolic homeostasis,”Nutrition Reviews, vol. 65, supplement 1, pp. S7–S12, 2007.
[39] T. S. Higa, A. V. Spinola, M. H. Fonseca-Alaniz, and F. S. Anna Evangelista, “Comparison between cafeteria and high-fat diets in the induction of metabolic dysfunction in mice,”
Interna-tional Journal of Physiology, Pathophysiology and Pharmacology,
vol. 6, no. 1, pp. 47–54, 2014.
[40] H. Kwon and J. E. Pessin, “Adipokines mediate inlammation and insulin resistance,”Frontiers in Endocrinology, vol. 4, article 71, 2013.
[41] G. M. Lord, G. Matarese, J. K. Howard, R. J. Baker, S. R. Bloom, and R. I. Lechler, “Leptin modulates the T-cell immune response and reverses starvation- induced immunosuppres-sion,”Nature, vol. 394, no. 6696, pp. 897–901, 1998.
[42] P. Marzullo, A. Minocci, P. Giarda et al., “Lymphocytes and immunoglobulin patterns across the threshold of severe obe-sity,”Endocrine, vol. 45, no. 3, pp. 392–400, 2014.
[43] J. Santos-Alvarez, R. Goberna, and V. S´anchez-Margalet, “Human leptin stimulates proliferation and activation of human circulating monocytes,”Cellular Immunology, vol. 194, no. 1, pp. 6–11, 1999.
[44] S. C. Acedo, S. Gambero, F. G. P. Cunha, I. Lorand-Metze, and A. Gambero, “Participation of leptin in the determination of the macrophage phenotype: An additional role in adipocyte and macrophage crosstalk,”In Vitro Cellular and Developmental
Biology - Animal, vol. 49, no. 6, pp. 473–478, 2013.
[45] A. Okuno, H. Tamemoto, K. Tobe et al., “Troglitazone increases the number of small adipocytes without the change of white adipose tissue mass in obese Zucker rats,”Journal of Clinical
Investigation, vol. 101, no. 6, pp. 1354–1361, 1998.
[46] E. Rigamonti, G. Chinetti-Gbaguidi, and B. Staels, “Regulation of macrophage functions by PPAR- �, PPAR- �, and LXRs in mice and men,”Arteriosclerosis, hrombosis, and Vascular
Biology, vol. 28, no. 6, pp. 1050–1059, 2008.
[47] S. Fujisaka, I. Usui, A. Bukhari et al., “Regulatory mechanisms for adipose tissue M1 and M2 macrophages in diet-induced obese mice,”Diabetes, vol. 58, no. 11, pp. 2574–2582, 2009. [48] A. Mantovani, A. Sica, S. Sozzani, P. Allavena, A. Vecchi, and M.
Locati, “he chemokine system in diverse forms of macrophage activation and polarization,”Trends in Immunology, vol. 25, no. 12, pp. 677–686, 2004.
[49] E.-G. Hong, J. K. Hwi, Y.-R. Cho et al., “Interleukin-10 prevents diet-induced insulin resistance by attenuating macrophage and cytokine response in skeletal muscle,”Diabetes, vol. 58, no. 11, pp. 2525–2535, 2009.
[50] C. N. Lumeng, J. L. Bodzin, and A. R. Saltiel, “Obesity induces a phenotypic switch in adipose tissue macrophage polarization,”
Journal of Clinical Investigation, vol. 117, no. 1, pp. 175–184, 2007.
[51] H. Tilg and A. R. Moschen, “Inlammatory mechanisms in the regulation of insulin resistance,”Molecular Medicine, vol. 14, no. 3-4, pp. 222–231, 2008.
[52] M. A. McArdle, O. M. Finucane, R. M. Connaughton, A. M. McMorrow, and H. M. Roche, “Mechanisms of obesity-induced inlammation and insulin resistance: insights into the emerging role of nutritional strategies,”Frontiers in Endocrinology, vol. 4, article 52, Article ID Article 52, 2013.
[53] J. Jager, T. Gr´emeaux, M. Cormont, Y. Le Marchand-Brustel, and J.-F. Tanti, “Interleukin-1�-induced insulin resistance in adipocytes through down-regulation of insulin receptor substrate-1 expression,”Endocrinology, vol. 148, no. 1, pp. 241– 251, 2007.
[54] J. Spranger, A. Kroke, M. M¨ohlig et al., “Inlammatory cytokines and the risk to develop type 2 diabetes: results of the prospective population-based european prospective investigation into can-cer and nutrition (epic)-potsdam study,”Diabetes, vol. 52, no. 3, pp. 812–817, 2003.
[55] Y. Zhong, Y.-S. Chiou, M.-H. Pan, and F. Shahidi, “Anti-inlammatory activity of lipophilic epigallocatechin gallate (EGCG) derivatives in LPS-stimulated murine macrophages,”
Food Chemistry, vol. 134, no. 2, pp. 742–748, 2012.
[56] S. Han, J. H. Lee, C. Kim et al., “Capillarisin inhibits iNOS, COX-2 expression, and proinlammatory cytokines in LPS-induced RAW 264.7 macrophages via the suppression of ERK, JNK, and NF-�B activation,”Immunopharmacology and
Submit your manuscripts at
http://www.hindawi.com
Stem Cells
International
Hindawi Publishing Corporationhttp://www.hindawi.com Volume 2014
Hindawi Publishing Corporation
http://www.hindawi.com Volume 2014
INFLAMMATION
Hindawi Publishing Corporation
http://www.hindawi.com Volume 2014
Behavioural
Neurology
Endocrinology
International Journal ofHindawi Publishing Corporation
http://www.hindawi.com Volume 2014
Hindawi Publishing Corporation
http://www.hindawi.com Volume 2014
Disease Markers
Hindawi Publishing Corporation
http://www.hindawi.com Volume 2014
BioMed
Research International
Oncology
Journal ofHindawi Publishing Corporation
http://www.hindawi.com Volume 2014
Hindawi Publishing Corporation
http://www.hindawi.com Volume 2014
Oxidative Medicine and Cellular Longevity
Hindawi Publishing Corporation
http://www.hindawi.com Volume 2014
PPAR Research
The Scientiic
World Journal
Hindawi Publishing Corporationhttp://www.hindawi.com Volume 2014
Immunology Research
Hindawi Publishing Corporation
http://www.hindawi.com Volume 2014 Journal of
Obesity
Journal ofHindawi Publishing Corporation
http://www.hindawi.com Volume 2014
Hindawi Publishing Corporation
http://www.hindawi.com Volume 2014
Computational and Mathematical Methods in Medicine
Ophthalmology
Journal ofHindawi Publishing Corporation
http://www.hindawi.com Volume 2014
Diabetes Research
Journal ofHindawi Publishing Corporation
http://www.hindawi.com Volume 2014
Hindawi Publishing Corporation
http://www.hindawi.com Volume 2014
Research and Treatment
AIDS
Hindawi Publishing Corporation
http://www.hindawi.com Volume 2014
Gastroenterology Research and Practice
Hindawi Publishing Corporation
http://www.hindawi.com Volume 2014
Parkinson’s
Disease
Evidence-Based Complementary and Alternative Medicine
Volume 2014