Nota Técnica
*e-mail: [email protected]
DETERMINATION OF Cu, Fe, Mn, Zn AND FREE FATTY ACIDS IN PEQUI OIL
Aparecida M. S. Mimura*, Lara P. Faza, Rafael Marques, Mireille Le Hyaric, Marcone A. L. de Oliveira eJulio C. J.
Silva
Departamento de Química, Instituto de Ciências Exatas, Universidade Federal de Juiz de Fora, 36036-900, Juiz de Fora – MG, Brasil
Recebido em 31/08/2015; aceito em 04/02/2016; publicado na web em 15/04/2016
Pequi (Caryocar brasiliense Camb.), a typical fruit of the Brazilian Cerrado, is an important source of micronutrients and fatty acids. In this work, a new approach for the acid digestion (using H2SO4, HNO3 and H2O2)of pequi oil samples and the determination of Cu,
Fe, Zn and Mn by flame atomic absorption spectrometry (F AAS) was employed. Capillary zone electrophoresis (CZE) was used for free fatty acid (FFA) determination after simple and fast extraction with heated ethanol. Good results regarding precision (RSD < 10%, in most cases), sensitivity and adequate LOD and LOQ values were obtained. The accuracy was evaluated using spike tests and the recoveries were from 97 to 107%. The analytes were investigated in four different pequi oil samples. Fe was the trace element with the highest concentration (from 1.99 to 10.3 mg/100 g), followed by Zn, Mn and Cu (1.15 to 3.19, 0.42 to 0.91 and 0.31 to 0.56 mg/100 g, respectively). The main FFA found were oleic acid and palmitic acid (1.61 to 10.7 and 0.82 to 2.69 g/100 g, respectively), while linoleic acid (0.50 g/100 g) was detected in only one sample. The pequi oil chemical composition showed good characteristics to be used as a food additive, in cosmetic formulations and for traditional medicine.
Keywords: pequi oil; trace-elements; free fatty acids; F AAS; CZE.
INTRODUCTION
The Cerrado is a large and important biome in Brazil, and a wide variety of fruits grow in this region. Pequi (Caryocar brasiliense Camb.) is a tropical fruit considered to be one of the most representa-tive species of the Brazilian Cerrado.1,2 This fruit contains high levels
of edible oil, vitamin A, proteins and antioxidant compounds.3-6 The
pequi fruit and its oil are used as ingredients in traditional dishes, mainly in the states of Goiás and Minas Gerais. Pequi oil extracted from the nut is also used in cosmetic formulations (soaps and skin emulsions) and in traditional medicine for the treatment of pulmonary diseases (cold, cough, bronchitis, asthma and influenza), lesions, gastric problems and inflammatory diseases.4,7 The efficiency of pequi
oil in these treatments is related to its fatty acid (FA) content. The main FA found in the triglycerides of pequi fruit and oil are palmi-tic and oleic acids.3,8-10 The large amount of unsaturated FA makes
pequi oil suitable for human consumption. Furthermore, pequi oil has been used in cosmetics due to its delicate color and aroma, and its high capacity for skin absorption has garnered the interest of the pharmaceutical industry.11 For example, after in vivo tests, Quirino
et al. concluded that the high concentration of oleic acid in pequi oil is important regarding the use of this oil as a therapeutic alternative in wound healing.8
The determination of FA is an important parameter for chemi-cal characterization and for the quality control of many products consumed in everyday life, such as edible oils.12 FA determination
is usually performed by chromatographic techniques, such as gas chromatography with flame ionization detector (GC-FID) and gas chromatography coupled to mass spectrometry (GC-MS).2,13 These
methodologies were used by Ferreira et al. and Sena Jr. et al. for the investigation of the FA content in pequi oil.7,13 However, the sample
preparation required for these analyses is time consuming, involving extraction of the lipid fraction, saponification, derivatization of FA to fatty acid methyl esters, and finally injection into the chromatogra-ph.12 In recent years, capillary zone electrophoresis (CZE) has been
applied to the determination of major FA in samples such as edible oils, olive oil, soy oils, butter and margarine, with faster and simpler analytical methods since the derivatization reaction is not required during sample preparation.12,14,15 However, therehave been no studies
in the literature involving the determination of FA in pequi oil by CZE. Furthermore, the free acidity, expressed according to the free fatty acid (FFA) content, is an important quality parameter of oil samples.14
The pequi fruit is also an important source of micronutrients essential to human health, such as Cu, Fe, Mn e Zn.16,17 These
micronutrients, known as trace elements, can be ingested through food and water and have a variety of biochemical functions in living organisms, but they can be toxic when taken in excess.18 The
quanti-fication of trace elements in food samples can be performed using the flame atomic absorption spectrometry (F AAS) due to its low cost, simplicity and high analytical throughput, with samples digested by mineral acids (such as HNO3, H2SO4, HClO4, HCl) under heating.18-21
In spite of the number of studies concerning FA and trace element determinations in pequi fruit found in the literature (mentioned abo-ve), only a few studies have been devoted to the quantitative analysis of pequi oil. Within this context, the aim of the present work was to demonstrate the potential of CZE for FFA (palmitic, oleic and linoleic acids) determination in pequi oil samples using ethanolic extraction as a simple sample preparation, and to quantify the trace element levels (Cu, Fe, Mn and Zn) in these samples using F AAS, following a new acid digestion procedure.
EXPERIMENTAL
Pequi oil
fruit in boiling water, separating the supernatant oil, drying the oil in a pan until it loses its opacity, and finally filtering the oil. Oil 4 was obtained using Soxhlet extraction with petroleum ether for 4 hours. The solvent was evaporated, leading to a yellow oil.7
Reagents and analytical solutions
All reagents were of analytical grade. Methanol and ethanol were purchased from Vetec (Rio de Janeiro, Brazil). Acetonitrile (ACN) and 1-octanol were purchased from Merck (Rio de Janeiro, Brazil). Polyoxyethylene 23 lauryl ether (Brij 35®) and sodium dodecylben-zenesulfonate (SDBS) were acquired from Sigma-Aldrich (St. Louis, MO, USA) and sodium hydroxide (NaOH) from Synth (São Paulo, Brazil). FA standards (oleic, palmitic, linoleic and tridecanoic acids) were obtained from Sigma-Aldrich (St. Louis, MO, USA). Individual stock solutions (20.0 mmol L-1) were prepared by dissolving the FA
standards in methanol. Analytical curves were prepared from the individual stock solutions. The concentrations of the analytical cur-ves ranged from 0.6 to 2.2 mmol L-1 for oleic acid, and from 0.2 to
1.8 mmol L-1 for palmitic and linoleic acids. Tridecanoic acid (fixed
concentration of 0.50 mmol L-1) was used as the internal standard
in all solutions (standards and samples). The electrolyte solution used was composed of 8.0 mmol L-1 Brij 35®, 4.0 mmol L-1 SDBS,
aqueous buffer (pH ~ 6.86) 15 mmol L-1 NaH
2PO4/Na2HPO4, 43.5%
v/v ACN and 2.1% v/v 1-octanol.12
The standards used for F AAS calibration were prepared from stock solutions of Fe, Mn (Merck, São Paulo, Brazil), Cu and Zn (Vetec, São Paulo, Brazil), at a concentration of 1000 mg L-1. The
analytical curves were prepared in 1.0% v/v HNO3 and the standard
concentrations varied from 0.5 to 3.0 mg L-1 (Fe, Cu, Mn) and from
0.25 to 2.0 mg L-1 (Zn). For the acid digestion of pequi oil samples
65% m/v HNO3 (Vetec, São Paulo, Brazil), 98% m/v H2SO4 and
30% v/v H2O2 (ISOFAR, Duque de Caxias, Brazil) were used. The
glassware was immersed in an acid bath containing 10% v/v HNO3
for 24 hours and rinsed with deionized water. All solutions were prepared using purified water at 18 MΩ cm provided by a Milli-Q®
system (Millipore, Direct-Q UV MA, USA).
Sample preparation
For the determination of FFA by CZE, the procedure proposed by Sato et al. and Balesteros et al. for olive oil was applied to pequi oil sample preparation.14,15 Each sample (approximately 0.050 g) was
weighed in a 5.0 mL volumetric flask, then 0.125 mL of 20 mmol L-1
tridecanoic acid (final concentration of 0.50 mmol L-1) was added
and the volume was completed to 5.0 mL with ethanol at 60 °C. The volumetric flask was agitated for 1 min by vortexing. After cooling, the volume was completed to 5.0 mL again, with ethanol at room temperature. After the separation of the phases, an aliquot of the ethanolic phase (top) was injected into the CE equipment. All analyses were performed in authentic triplicates.
For the determination of trace elements by F AAS in pequi oil sam-ples, a new acid digestion procedure was developed in order to obtain total digestion of the organic matter without the use of perchloric acid. All experiments were performed in triplicate. A blank obtained from the extraction process was also analyzed. Each oil sample (0.5 g) was weighed, and then 5.0 mL of H2SO4 and 5.0 mL of HNO3 were added.
The samples were placed on a hot plate at 95 °C until the complete volume reduction (almost dryness). Then, 5.0 mL of HNO3 was added
and the release of gases (NOx) was observed. After volume reduction, 5.0 mL of HNO3 was added again, and no release of gases was observed
at this time. Aliquots of about 2.0 mL of H2O2 were added (five times)
until the effervescence stopped, indicating the end of the digestion of
the organic fraction. The beakers were cooled to room temperature, the samples were transferred to volumetric flasks and the volume was completed with deionized water to 25.0 mL.
Instrumentation and samples analysis
CE equipment
The determination of FFA was performed using an Agilent 7100 capillary electrophoresis system (Agilent Technologies, Palo Alto, CA, USA) equipped with a diode array detector (ultraviolet indirect detection at 224 nm), temperature control device (set at 25 °C) and data acquisition/treatment software (Agilent ChemStation, Rev. B.04.03). The samples were hydrodynamically injected (12.0 mbar by 4 s), and the electrophoretic system was operated under normal pola-rity and constant voltage (+19 kV). Manual integration was performed using peak baselines. A fused-silica capillary tube with fluoropolymer external coating (TSH) was used (Polymicro Technologies, Phoenix, AZ, USA) with 48.5 cm length (40 cm effective length), 75 µm internal diameter and 375 µm outside diameter. Before analysis, the capillary was conditioned by pressure flushing with 1.0 mmol L-1
NaOH (15 min), deionized water (15 min) and electrolyte solution (15 min). The capillary was regenerated between runs by washing with 1.0 mmol L-1 NaOH (2 min), deionized water (2 min) and electrolyte
solution (2 min). The limits of detection (LOD) and quantification (LOQ) were calculated by multiplying the value of the standard deviation of the baseline for 3.3 (LOD) or for 10 (LOQ) and by the concentration of each analyte found. The result was divided by the peak height of each analyte analyzed.14
F AAS equipment
The determination of trace elements (Fe, Cu, Mn and Zn) was performed using an atomic absorption spectrometer model M5 Solaar Thermo Scientific Series. The experimental conditions were: wave-length: 248.3, 324.8, 279.5 and 213.9 nm; band pass: 0.5, 0.5, 0.2 and 0.2 nm; gases: air and C2H2; fuel flow: 1.1, 1.1, 1.3 and 1.0 L min-1
for Fe, Cu, Mn and Zn, respectively. The deuterium background corrector (D2) was used during the determination of Fe, Cu, Mn and
Zn. The LOD and LOQ of the trace elements determination were calculated by multiplying the value of the standard deviation (signal absorbance of the blank) by 3.3 (LOD) or by 10 (LOQ). The result was then divided by the slope of the analytical curve.
The precision of the method was verified through the relative standard deviation (RSD). Certified reference materials with similar characteristics to the samples were difficult to obtain. Thus, the accu-racy of the method was evaluated using spike tests, as recommended by ANVISA.22 Spike tests were performed at the following levels:
1.0 mmol L-1 for oleic, palmitic and linoleic acids, 2.0 mg L-1 for Cu,
Fe, Mn and 1.0 mg L-1 for Zn. The analytes were added immediately
after weighing the samples, in order to assess the accuracy during ethanolic extraction and acid digestion. The method was applied to four pequi oil samples.
RESULTS AND DISCUSSION
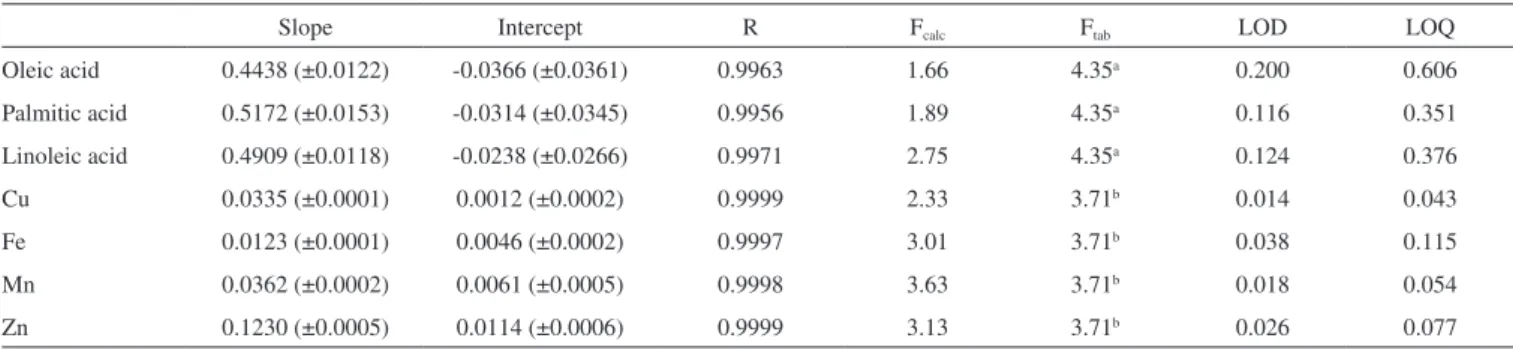
The analytical curves for analyte determination by CZE and F AAS showed good linearity, and the linear correlation coefficient (R) of the curves obtained was greater than 0.995 for all analytes. Analysis of variance (ANOVA) was used to check the lack of fit of the linear regression (Table 1). In all cases, the absence of lack of fit of the regression for α = 0.05 was observed.
The standard concentrations in the analytical curves were in mmol L-1 for the determination of fatty acids by CZE, and in mg L-1
techniques usually work with these units. The limits of detection (LOD) and quantification (LOQ) were calculated in these units and presented satisfactory values for both FA and trace element determi-nations. However, for food samples, the results are usually expressed in g/100 g (percentage) or mg/100 g. So, the LOD and LOQ values were also calculated in these units. For FFA, LOD values were 0.47, 0.25 and 0.29 g/100 g, while LOQ values were 1.43, 0.75 and 0.88 g/100 g, for oleic, palmitic and linoleic acid, respectively. For trace elements, LOD values were 0.07, 0.19, 0.09 and 0.13 mg/100 g, while LOQ values were 0.22, 0.58, 0.27 and 0.39 mg/100 g, for Cu, Fe, Mn and Zn, respectively.
Figure 1 shows the electropherograms obtained for FFA in a standard solution and in a pequi oil sample. The analysis by CZE was performed using alkaline buffers, because the species were analyzed as anions. Good separation and good peak resolution were obtained in the samples and in the standard solutions in less than 12 min.
After extraction, the pequi oil samples were introduced into the CZE equipment. During the extraction process, it was necessary to
optimize the mass of the oil due to the high content of fatty acids in the pequi oil samples. The mass values studied were 1.0, 0.1 and 0.05 g. With a mass of approximately 0.05 g of pequi oil, it was possible to obtain analytical signals within the working range represented by the analytical curve. The precision and accuracy of FFA determination were evaluated and showed good results. The RSD values ranged up to 15%, due to the influence of the viscosity of the sample during the weighing process. However, RSD values were < 10% in most cases. The accuracy was verified using spike tests and presented recoveries between 98 and 105% of all the analytes investigated. The analytes were added after weighing the samples. Thus, the entire extraction method was evaluated by the spike tests. Ethanolic extraction was applied to pequi oil samples, associated with analysis by CZE, providing a simple, fast and reliable method for FFA determination, with minimal human intervention, economy of reagents and a small volu me of sample required.
Table 2 presents the results for pequi oil samples after ethanolic extraction and determination by CZE. The concentration of oleic
Table 1. Analysis of variance (ANOVA) of the analytical curves, LOD and LOQ values (mmol L-1 for fatty acids and mg L-1 for trace-elements)
Slope Intercept R Fcalc Ftab LOD LOQ
Oleic acid 0.4438 (±0.0122) -0.0366 (±0.0361) 0.9963 1.66 4.35a 0.200 0.606
Palmitic acid 0.5172 (±0.0153) -0.0314 (±0.0345) 0.9956 1.89 4.35a 0.116 0.351
Linoleic acid 0.4909 (±0.0118) -0.0238 (±0.0266) 0.9971 2.75 4.35a 0.124 0.376
Cu 0.0335 (±0.0001) 0.0012 (±0.0002) 0.9999 2.33 3.71b 0.014 0.043
Fe 0.0123 (±0.0001) 0.0046 (±0.0002) 0.9997 3.01 3.71b 0.038 0.115
Mn 0.0362 (±0.0002) 0.0061 (±0.0005) 0.9998 3.63 3.71b 0.018 0.054
Zn 0.1230 (±0.0005) 0.0114 (±0.0006) 0.9999 3.13 3.71b 0.026 0.077
a F
tab (n1=3, n2=7), b Ftab (n1=3, n2=10).
Figure 1. Electropherograms obtained by CZE: a) standard solution (1.4 mmol L-1 for oleic acid (1), 1.0 mmol L-1 for palmitic acid (2), 1.0 mmol L-1 for linoleic acid (3), and 0.5 mmol L-1 for tridecanoic acid (4)); b) pequi oil sample (oil 3). Electrolyte solution: 15.0 mmol L-1 of sodium phosphate buffer (pH ~ 6.8); 8.0 mmol L-1 of Brij 35®; 4.0 mmol L-1 of SDBS; 2.1% v/v 1-octanol and 43.5% v/v ACN. Instrumental parameters: injection at 12 mbar x 4 s, +19 kV voltage; indirect detection at 224 nm; 25 °C inside the cartridge; capillary TSH with a length of 48.5 cm (40 cm effective length), 75 µm internal diameter and 375 µm external diameter
Table 2. FFA concentration in pequi oil samples. Concentration in g/100g ± standard deviation (n=3)
Analytes Oil 1 Oil 2 Oil 3 Oil 4
Oleic acid 1.61 ± 0.07 4.18 ± 0.44 2.24 ± 0.29 10.7 ± 1.6
Palmitic acid 0.82 ± 0.03 2.47 ± 0.21 1.29 ± 0.08 2.69 ± 0.21
and palmitic acids ranged from 1.61 to 10.7 and from 0.82 to 2.69 g/100 g, respectively. Linoleic acid (0.50 g/100 g) was detected only in oil 4. One of the parameters evaluated for the quality of vegetable edible oils (such as olive oil) is the free acidity, expressed as the oleic acid percentage. Thus, a high FFA content indicates poor oil quality. For example, the established value for olive oil acidity is 1.0% (1 g/100 g).14 However, there is no legislation regarding the free
aci-dity in pequi oil, but this oil is widely used in food preparation and in traditional dishes. According to Table 2, of the four different samples of pequi oil tested, oil 1 presented the best quality over the others, due to the lowest levels of FFA, while oil 4 presented the highest concentration of all the analyzed FFA and the highest acidity (highest oleic acid concentration). The low quality of oil 4 may be related to the decomposition of triglycerides during the extraction process.
The main FFA found in the samples were oleic acid and palmi-tic acid, similar to results reported in the literature regarding FA in pequi fruit and in pequi oil.2,7,8,13,23 These studies indicate that oleic
acid and palmitic acid together account for approximately 90% of the total of FA content in the triglycerides of pequi oil. In the four analyzed samples, oleic acid corresponded to approximately 67% of the analyzed FFA, while palmitic acid was approximately 32% and linoleic acid 3.6% (in oil 4).
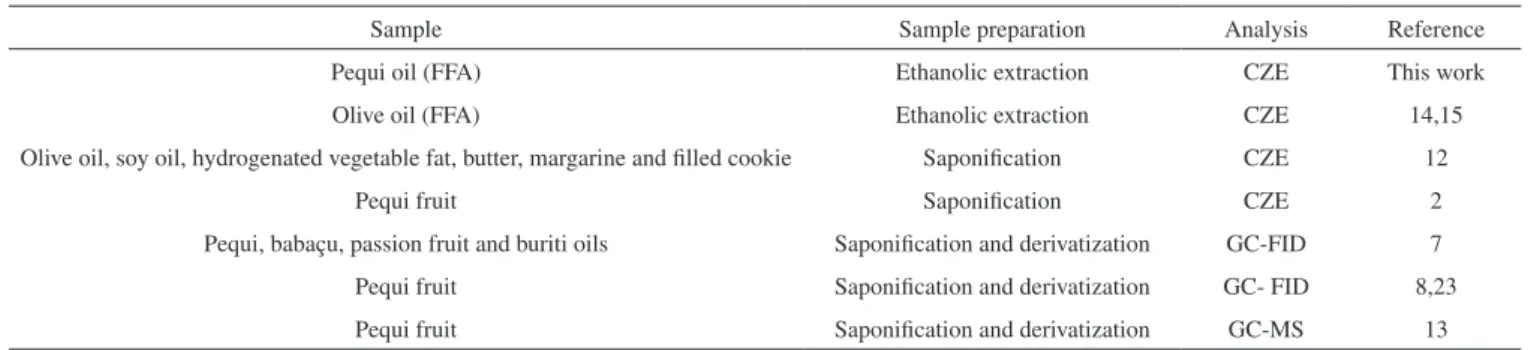
Table 3 shows the comparison between FA determination in pequi oil and in other samples found in the literature. CZE has been used to determine FFA after ethanolic extraction, while CZE and chromato-graphic techniques have been used to determine FA composition of triglycerides after the saponification of samples. Most studies found in the literature were devoted to quantifying FA in pequi fruit. However, pequi oil has been used in cosmetic preparations and in traditional medicine. The efficiency of pequi oil in these processes is related to its fatty acid content. In addition, pequi oil is widely used by the popu-lation to prepare traditional and regional dishes. Thus, it is important to develop methods to assess pequi oil quality. This was performed in the present work, using CZE for FFA determination in pequi oil samples, after simple sample preparation with heated ethanol.
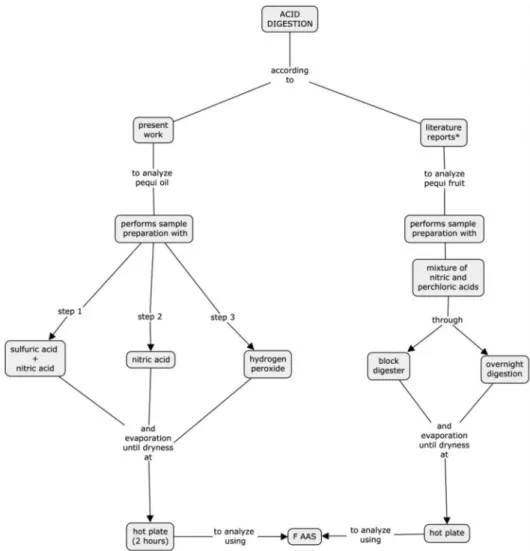
The determination of micronutrients was performed by F AAS. The acid digestion of organic samples is usually carried out with mi-neral acids containing oxidant characteristics, such as HNO3, HClO4
and H2SO4. H2O2 is also an oxidant reagent used in the digestion
of organic samples. The nitro-perchloric mixture is recommended by EMBRAPA for the digestion of samples of vegetable origin.24
Gonçalves et al. used a nitro-perchloric mixture, while Ramos and Souza used a mixture of H2SO4, HNO3 and HClO4 for pequi fruit
digestion.5,17 Nitro-perchloric digestion was also used to digest
another typical Brazilian fruit (macaúba) in a digester block,as well as several food samples, like meat, vegetables and a large variety of fruits.25,26 Despite being an excellent oxidant agent, the use of HClO
4
requires caution, because the reaction of HClO4 with organic matter
is very violent. Furthermore, nitro-perchloric digestion is time con-suming, with an overnight step of about 12 hours, or alternatively
requiring the use of a digester block at high temperature for more than 3 hours.5,17,25,26
Therefore, to minimize this problem, a digestion method was proposed using H2SO4, HNO3 and H2O2. These reagents are commonly
found in research laboratories, and heating was performed using a hot plate. Thus, this method is simple and can be applied in routine analysis, avoiding the use of HClO4 and without special bottles, a
digester block or an overnight step. Although reagent expenditure is a constant concern, in this case it was not possible to minimize the amount of reagents used because the oil samples were difficult to digest and high volumes of acids were usually necessary to complete the digestion of these samples. For example, EPA method 3031, for oil samples, uses a large acid volume for sample digestion, and allows the increasing of the volume of HNO3 proportionately, depending on
analytical needs. However, method 3031 is not indicated for some important analytes, such as Fe and Mn.27 In this study, during the
digestion process, the reagents were added in several steps and the volumes were optimized in order to ensure complete digestion of the organic matter. After the addition of HNO3, some reddish-brown
vapor (NOx) was released. The reaction was allowed to continue
until complete, which could be observed when the NOx release and
effervescence (after the addition of H2O2) stopped. Additionally, with
the proposed method, it was possible to perform sample digestion quickly, i.e., within 2 hours. Figure 2 shows the comparison between nitro-perchloric digestion and the method developed in this work.
The concentrations of Cu, Fe, Mn and Zn in the four pequi oil samples are shown in Table 4. The RSD values were < 10%, indicating satisfactory precision of the method. Spike tests showed recoveries of 101, 105, 98.7 and 107%, for Fe, Cu, Mn and Zn, respectively, indi-cating good accuracy and confirming the efficiency of the developed digestion method. So, it was possible to perform the determination of trace elements by F AAS in pequi oil after acid digestion without the use of perchloric acid, with good results in terms of precision and accuracy, using a simpler and safer sample preparation method.
According to the data presented in Table 4, in the investigated oil samples, the analyte present in the highest concentration was Fe, followed by Zn, Mn and Cu. The concentrations ranged from 1.99 to 10.3, 0.31 to 0.56, 0.42 to 0.91 and 1.15 to 3.19 mg/100 g for Fe, Cu, Mn and Zn, respectively. Similar concentrations of these analytes were found by Gonçalves et al., Ramos and Souza and Silva et al. in pequi fruit.5,17,21 These analytes were chosen in this work since they
are of great importance in human health and are fundamental for many physiological processes. Fe is associated with the transport of oxygen to cells. Low Fe levels in the body can cause anemia, which is a serious problem throughout the world. Cu acts in cellular respiration and, as well as Zn, is related to a large number of enzymes. The lack of Zn in the body can cause problems in growth and development. Mn plays a role in bone metabolism in the human body, among other functions. However, in excess, these elements can affect cellular processes and cause various problems, even cancer.28 These micronutrients were
Table 3. Determination of FA in several samples
Sample Sample preparation Analysis Reference
Pequi oil (FFA) Ethanolic extraction CZE This work
Olive oil (FFA) Ethanolic extraction CZE 14,15
Olive oil, soy oil, hydrogenated vegetable fat, butter, margarine and filled cookie Saponification CZE 12
Pequi fruit Saponification CZE 2
found in suitable levels for human consumption in the samples. The mineral abundance tests show that pequi oil can be used as a com-plementary and alternative source of trace elements. Comparing the results obtained with the values of daily needed minerals (Table 4) recommended by the World Health Organization, it was possible to confirm that pequi oil is a potential source of Fe, Cu, Mn and Zn.29
After the determination of the analytes, it is important to note that each oil sample had different uses. Oil 1 and oil 2 were obtained from a commercial source, and presumably these samples are meant to be used in pharmaceutical and cosmetic industries. In this case, some of the analytes can be ingested or absorbed by the skin and the correct dosage of FFA and trace elements is a critical point of control that can be assessed by CZE and F AAS analysis, respectively. On the other hand, oil 3 was obtained in a popular market and is used by the local population, usually for cooking. Thus, this sample is ingested directly and monitoring the FFA and trace elements content
is important to determine their quality, since there are no strict criteria regarding the production method, time of use and storage. Oil 4 was obtained from fruit in the laboratory. The highest concentration of FFA was found in this sample, indicating that the decomposition of triglycerides occurred during the extraction process.
CONCLUSION
In this study, a fast and simple method for FFA determination in pequi oil samples by CZE was developed. Furthermore, the de-termination of trace elements by F AAS was performed after acid digestion of the samples, without the use of perchloric acid. Good results were observed in the spike tests, with recoveries from 97 to 107%, indicating good accuracy of the investigated method. The LOD and LOQ values obtained were consistent with the techniques used. It was possible to quantify the micronutrients Fe, Mn, Cu and
Table 4. Trace elements concentration in pequi oil and in pequi fruit. Concentration in mg/100g ± standard deviation (n=3)
Analytes Oil 1 Oil 2 Oil 3 Oil 4 WHO
*
(mg/day) Fruit
5 Fruit17 Fruit21
Fe 10.3 ± 0.07 5.58 ± 0.09 9.55 ± 0.01 1.99 ± 0.03 20 3.00 3.12 1.18 Cu 0.45 ± 0.04 0.31 ± 0.03 0.56 ± 0.03 0.48 ± 0.03 2.0 1.00 0.58 1.10 Mn 0.71 ± 0.04 0.42 ± 0.03 0.91 ± 0.02 0.73 ± 0.06 3.0 0.40 1.31 1.60 Zn 3.19 ± 0.02 1.15 ± 0.04 2.45 ± 0.07 1.45 ± 0.02 15 1.00 1.75 2.70
*Daily required minerals recommended by the World Health Organization.29
Zn and FFA (oleic, palmitic and linoleic acids) in different pequi oil samples. Pequi oil can be considered a rich source of trace elements. Oleic acid (an unsaturated FA) was found in high concentrations in the samples. Thus, pequi oil can be characterized as a valuable nutritional source of unsaturated FA and micronutrients. Pequi oil showed good characteristics to be used as a food additive, in cosmetic formulations and in traditional medicine.
ACKNOWLEDGMENTS
The authors would like to thank the FAPEMIG (Fundação de Amparo à Pesquisa do Estado de Minas Gerais), CNPq (Conselho Nacional de Desenvolvimento Científico e Tecnológico), and CAPES (Coordenação de Aperfeiçoamento de Pessoal de Nível Superior) for financially supporting. This work is a collaboration research project of members of the Rede Mineira de Química (RQ-MG) supported by FAPEMIG (Project: CEX - RED-00010-14).
REFERENCES
1. Geőcze, K. C.; Barbosa, L. C. A.; Fidêncio, P. H.; Silvério, F. O.; Lima, C. F.; Barbosa, M. C. A.; Ismail, F. M. D.; Food Res. Int. 2013, 54, 1. 2. Barra, P. M. C.; Oliveira, M. A. L.; Nery-Enes, B.; Cardoso, L. M.;
Cesário, C. C.; Moreira, A. V. B; Pinheiro-Sant’Ana, H. M.; Peluzio, M. C. G.; Quim. Nova 2013, 36, 1430.
3. Silva, T. A.; Assunção, R. M. N.; Vieira, A. T.; Oliveira, M. F.; Batista, A. C. F.; Fuel 2014, 136, 10.
4. Roesler, R.; Catharino, R. R.; Malta, L. G.; Eberlin, M. N.; Pastore, G.; Food Chem. 2008, 110, 711.
5. Gonçalves, G. A. S.; Boas, E. V. B. V.; Resende, J. V.; Machado, A. L. L.; Boas, B. M. V.; Ciênc. Agrotec. 2011, 35, 377.
6. Machado, M. T. C; Mello, B. C. B. S.; Hubinger, M. D.; J. Food Eng.
2013, 117, 450.
7. Ferreira, B. S.; Almeida, C. G.; Faza, L. P.; Almeida, A.; Diniz, C. G.; Silva, V. L.; Grazul, R. M.; Le Hyaric, M.; Molecules 2011, 16, 5875. 8. Quirino, G. S.; Leite, G. O.; Rebelo, L. M.; Tomé, A. R.; Costa, J. G.
M.; Cardoso, A. H.; Campos, A. R.; Phytochem. Lett. 2009, 2, 179. 9. Miranda-Vilela, A. L.; Pereira, L. C. S.; Gonçalves, C. A.; Grisolia, C.
K.; Nutr. Res. 2009, 29, 850.
10. Facioli, N. L.; Gonçalves, L. A. G.; Quim. Nova 1998, 21, 16.
11. Oliveira, M. N. S.; Gusmão, E.; Lopes, P. S. N.; Simões, M. O. M.; Ribeiro, L. M.; Dias, A. S.; Rev. Bras. Frutic. 2006, 28, 380.
12. Barra, P. M. C.; Castro, R. J. C; Oliveira, P. L.; Aued-Pimentel, S.; Silva, S. A.; Oliveira, M. A. L.; Food Res. Int. 2013, 52, 33.
13. Sena Jr., D. M.; Rodrigues, F. F. G.; Freire, P. T. C; Lima, S. G; Coutinho, H. D. M; Carvajal, J. C. L.; Costa J. G. M.; Grasas Aceites
2010, 61,191.
14. Sato, R. T.; Castro, R. J. C.; de Castro, P. M.; de Oliveira, M. A. L; Phytochem. Anal. 2014, 25, 241.
15. Balesteros, M. R.; Tavares, M. F. M.; Ribeiro, S. J. L.; Polachini, F. C.; Messaddeq, Y.; Oliveira, M. A. L.; Electrophoresis 2007, 28, 3731. 16. Alves, A. M.; Fernandes, D. C.; Sousa, A. G. O.; Naves, R. V.; Naves,
M. M. V.; Braz. J. Food. Technol. 2014, 17, 198.
17. Ramos, K. M. C.; Souza, V. A. B.;Rev. Bras. Frutic. 2011, 33, 500. 18. Demirel, S.; Tuzen, M.; Saracoglu, S.; Soylak, M.; J. Hazard. Mater.
2008, 152, 1020.
19. Skrbic, B.; Gyura, J.; Food Control 2007, 18, 135.
20. Alves, F. L.; Cadore, S.; Jardim, W. F.; Arruda, M. A. Z.; J. Braz. Chem. Soc. 2001, 12, 799.
21. Silva, M. S. M.; Brait, J. D. A.; Faria, F. P.; Silva, S. M.; Oliveira, S. L.; Braga P. F.; Silva M. F. M. S.; Ciênc. Tecnol. Aliment. 2009,29, 771. 22. ANVISA, Guia para Qualidade em Química Analítica. Uma Assistência
à Habilitação. http://www.anvisa.gov.br/divulga/public/series/ laboratorios.pdf, accessed August 2015.
23. Lima, A.; Silva, A. M. O.; Trindade, R. A.; Torres, R. P.; Mancini-Filho, J.; Rev. Bras. Frutic. 2007, 29, 695.
24. Silva, F. C.; In: Manual de análises químicas de solo, plantas e fertili-zantes, Campinas: Embrapa Informática Agropecuária, 1999. 25. Machado, W.; Guimarães, M. F.; Lira, F. F.; Santos, J. V. F.; Takahashi,
L. S. A.; Leal, A. C.; Coelho, G. T. C. P.; Ind. Crop. Prod. 2015, 63, 287. 26. Ferreira, K. S.; Gomes, J. C.; Chaves, J. B. P.; Food Chem. 2005, 92, 29. 27. EPA, Method 3031, Acid Digestion of Oils for Metals Analysis by
Atomic Absorption or ICP Spectrometry. http://www.epa.gov/osw/ hazard/testmethods/sw846/pdfs/3031.pdf, accessed August 2015. 28. Azevedo, F. A.; Chasin, A. A. M.; Metais: gerenciamento da toxicidade,
Atheneu: São Paulo, 2003.