Ecological Niche Transferability Using
Invasive Species as a Case Study
Miguel Fernández
1,2*
, Healy Hamilton
31Department of Integrative Biology, University of California, Berkeley, California, United States of America, 2German Centre for Integrative Biodiversity Research (iDiv) Halle-Jena-Leipzig, Leipzig, Germany, 3NatureServe, Arlington, Virginia, United States of America
Abstract
Species distribution modeling is widely applied to predict invasive species distributions and
species range shifts under climate change. Accurate predictions depend upon meeting the
assumption that ecological niches are conserved, i.e., spatially or temporally transferable.
Here we present a multi-taxon comparative analysis of niche conservatism using biological
invasion events well documented in natural history museum collections. Our goal is to
as-sess spatial transferability of the climatic niche of a range of noxious terrestrial invasive
spe-cies using two complementary approaches. First we compare spespe-cies
’
native versus
invasive ranges in environmental space using two distinct methods, Principal Components
Analysis and Mahalanobis distance. Second we compare species
’
native versus invaded
ranges in geographic space as estimated using the species distribution modeling technique
Maxent and the comparative index Hellinger
’
s
I
. We find that species exhibit a range of
re-sponses, from almost complete transferability, in which the invaded niches completely
over-lap with the native niches, to a complete dissociation between native and invaded ranges.
Intermediate responses included expansion of dimension attributable to either temperature
or precipitation derived variables, as well as niche expansion in multiple dimensions. We
conclude that the ecological niche in the native range is generally a poor predictor of
invad-ed range and, by analogy, the ecological niche may be a poor prinvad-edictor of range shifts
under climate change. We suggest that assessing dimensions of niche transferability prior
to standard species distribution modeling may improve the understanding of species
’
dy-namics in the invaded range.
Introduction
Our understanding of species
’
spatial distributions is derived from documented records of
spe-cies
’
occurrences in nature. Distributions have been inferred by simply plotting convex hulls
around occurrence points on a map, or, with increasing frequency, by applying complex
geos-tatistical tools that integrate specimen location data with fine scale environmental data,
result-ing in a species distribution model (SDM) [
1
], also known as an ecological niche model [
2
], [
3
].
a11111
OPEN ACCESS
Citation:Fernández M, Hamilton H (2015) Ecological Niche Transferability Using Invasive Species as a Case Study. PLoS ONE 10(3): e0119891. doi:10.1371/journal.pone.0119891
Academic Editor:Jian Liu, Shandong University, CHINA
Received:November 24, 2014
Accepted:February 1, 2015
Published:March 18, 2015
Copyright:© 2015 Fernández, Hamilton. This is an open access article distributed under the terms of the
Creative Commons Attribution License, which permits unrestricted use, distribution, and reproduction in any medium, provided the original author and source are credited.
Data Availability Statement:All relevant data are within the paper.
Funding:This work was supported by the Russell E. Train Education for Nature Fellowship. The funders had no role in study design, data collection and analysis, decision to publish, or preparation of the manuscript.
SDMs have aided researchers in analyzing possible biogeographic scenarios and have provided
evocative visualizations; species distribution modeling is now entrenched as one of the more
important tools used to simulate species range shifts due to climate change (e.g. [
4
], [
5
], [
6
],
[
7
]) and to predict invasive species range expansions (e.g. [
8
], [
9
], [
10
], [
11
]).
Despite their wide use and promise [
4
], [
12
], these practical summaries of biogeographic
in-formation are still controversial [
13
], [
14
], [
15
], [
16
]. The challenges of applying SDMs fall into
four categories: (1) Species data considerations, where the quantity [
17
], quality [
18
] and
spa-tial structure [
19
] of specimen locality data can have profound effects on the model results; (2)
Environmental data considerations, where the choice of environmental data [
20
], [
21
], grain
size [
22
] and scale [
23
], [
24
] can affect the results from SDMs; (3) Issues related to the selection
of the SDM technique, where the choice of model algorithm [
25
], [
26
], [
27
], [
28
], [
29
] and
threshold selection [
30
] provide high variability among SDM outputs; and (4) Assumptions of
species distribution modeling which in some instances are flawed [
31
], [
32
], specifically the
as-sumption that biotic influences are unimportant, species genotypic and phenotypic
composi-tion is invariable over time and space, and viable populacomposi-tions occur everywhere that
environmental conditions are suitable [
33
], [
34
], [
12
].
The first assumption, that biotic influences such as competition, predation and mutualism
are not accounted for, has profound consequences when SDMs are applied to predict range
shifts due to climate change or predict an invasive species' potential areas of range expansion.
The issue of whether biotic interactions will remain similar in a different spatial or temporal
context remains a central question in species distribution modeling [
4
], [
35
], [
36
], [
37
], [
38
].
The second assumption reflects the inability of SDM to account for the genetic and
pheno-typic variation among sampled individuals, thus assuming a uniform response to changes in
the environment [
39
], [
32
]. While in some cases this may be effectively true (e.g. [
40
]), a large
body of evidence describes how founder effect and natural selection in invasive species
popula-tions can occur within relatively short time frames, on the order of years [
41
], [
42
], [
43
].
The third assumption, that species occur everywhere suitable conditions exist, suggests that
species have had sufficient time and ability to populate all locations of suitable habitat [
44
],
[
45
]. However, many species are known to not occupy all suitable habitat. Indeed species
inva-sions themselves evidence this, [
32
] and metapopulations with source-sink dynamics are
com-mon [
46
], [
47
].
Methods
Species and geographic occurrence data
Here, we evaluate ecological niche transferability using a subset of 13 species derived from the
IUCN
’
s list of the top 100 Invasive Species [
59
] known for their large impact on biological
di-versity or human activities and their illustration of important issues of biological invasion. The
subset of species (
Table 1
) each fulfilled the following criteria: terrestrial macrobiotic
organ-isms, with
>
100 unique localities in both the native and invaded ranges, downloadable as
geor-eferenced occurrence information (precise to seconds in latitude and longitude) from the
Global Biodiversity Information Facility (GBIF). Data points from GBIF were attributed to
na-tive or invaded ranges according to range discriminations described in the Global Invasive
Spe-cies Database. Two geospatial databases were created for each speSpe-cies, one for the native range
and one for the invaded range.
Environmental layers
The environmental envelopes for each invasive taxon in its native and invaded range was
calcu-lated using 19 derived bioclimatic variables (
Table 2
) acquired from Worldclim 1.4 [
60
]. We
applied a minimum spatial resolution of 1 km
2to minimize the effect of small-scale ecological
interactions, which define species ranges at scales
<
1 km
2[
61
], [
62
].
Comparison of the native and invaded ranges
We compared the native and invaded ranges in two complementary ways: (1) a comparison
be-tween observed environmental space occupied by native and invaded populations, and (2) a
comparison of the modeled geographic space occupied as predicted using SDM methods. This
dual approach dissociates the observed environmental distribution from the geographic
distri-bution estimated using SDM methods, which otherwise are confounded [
63
], [
64
].
Comparison of observed environmental spaces
The range of abiotic environmental parameters at which species were recorded in their native
range was compared to those records in the invaded range using two complementary methods.
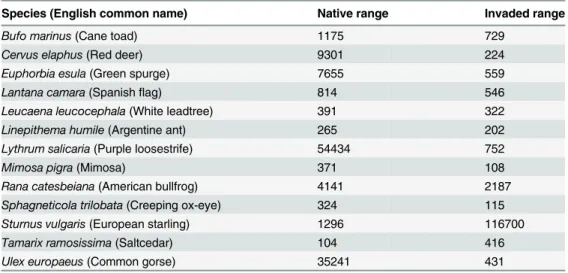
Table 1. Specimen georeferenced observation data per species from GBIF divided between native and invaded ranges.Species (English common name) Native range Invaded range
Bufo marinus(Cane toad) 1175 729
Cervus elaphus(Red deer) 9301 224
Euphorbia esula(Green spurge) 7655 559
Lantana camara(Spanishflag) 814 546
Leucaena leucocephala(White leadtree) 391 322
Linepithema humile(Argentine ant) 265 202
Lythrum salicaria(Purple loosestrife) 54434 752
Mimosa pigra(Mimosa) 371 108
Rana catesbeiana(American bullfrog) 4141 2187
Sphagneticola trilobata(Creeping ox-eye) 324 115
Sturnus vulgaris(European starling) 1296 116700
Tamarix ramosissima(Saltcedar) 104 416
Ulex europaeus(Common gorse) 35241 431
Principal Component Analysis [
65
], which reduces complex non-parametric multivariate
datasets into lower dimensions [
66
], allows data visualization and also accommodates
non-independent datasets as expected in our environmental data. It was performed using SPSS
v16.0. The factor analysis rotation method was varimax and factor scores were calculated using
the regression method [
67
]. The three principal components with highest eigenvalues were
plotted in three-dimensional space using SigmaPlot v11.0.
Mahalanobis distance [
68
] is a distance metric based on variable covariance best suited for
non-spherically symmetric distributions and deals very robustly with variables with very
differ-ent scales, such as the 19 bioclimatic variables we used for characterizing niche space [
69
]. The
Mahalanobis distance (MD) between two multivariate vectors
x
and
y
is:
MD
x;y¼
ffiffiffiffiffiffiffiffiffiffiffiffiffiffiffiffiffiffiffiffiffiffiffiffiffiffiffiffiffiffiffiffiffiffiffiffiffiffi
ð
x
y
Þ
TS
1x
ð
x
y
Þ
r
ð
1
Þ
in
n-
dimensional space where
S
is the covariance matrix and the suf
fi
x
T
denotes that vectors
should be transposed. This was calculated using MATLAB v6.5 where the native and invasive
groups for each species were randomly permuted one hundred thousand times to produce the
underlying probability density. The reported values were based on the mean.
Comparison of modeled geographic spaces
SDMs were created based on the native and invaded range localities using Maxent v3.3.1 [
70
],
a distribution modeling algorithm many consider to perform better relative to alternative SDM
techniques [
26
], [
71
]. Standard settings were applied [
18
] and logistic model outputs were
compared using a SDM threshold independent metric that allows the comparison of two
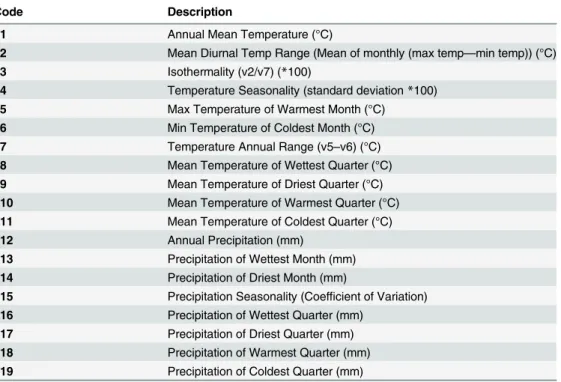
Table 2. List of Worldclim 1.4 environmental variables used in the analysis derived from monthly mean, maximum, and minimum temperature and precipitation interpolations averaged for 1950 to 2000 at a spatial resolution of 1km2.Code Description
v1 Annual Mean Temperature (°C)
v2 Mean Diurnal Temp Range (Mean of monthly (max temp—min temp)) (°C)
v3 Isothermality (v2/v7) (*100)
v4 Temperature Seasonality (standard deviation*100)
v5 Max Temperature of Warmest Month (°C)
v6 Min Temperature of Coldest Month (°C)
v7 Temperature Annual Range (v5–v6) (°C)
v8 Mean Temperature of Wettest Quarter (°C)
v9 Mean Temperature of Driest Quarter (°C)
v10 Mean Temperature of Warmest Quarter (°C)
v11 Mean Temperature of Coldest Quarter (°C)
v12 Annual Precipitation (mm)
v13 Precipitation of Wettest Month (mm)
v14 Precipitation of Driest Month (mm)
v15 Precipitation Seasonality (Coefficient of Variation)
v16 Precipitation of Wettest Quarter (mm)
v17 Precipitation of Driest Quarter (mm)
v18 Precipitation of Warmest Quarter (mm)
v19 Precipitation of Coldest Quarter (mm)
continuous raster layers [
72
]: the modified Hellinger
’
s
I
statistic,
I
¼
1
1
2
ffiffiffiffiffiffiffiffiffiffiffiffiffiffiffiffiffiffiffiffiffiffiffiffiffiffiffiffiffiffiffiffi
X
ð
ffiffiffiffi
A
p
ffiffiffi
B
p
Þ
2q
ð
2
Þ
In this statistic,
A
and
B
represents the two SDM outputs that are to be compared pixel by
pixel. Statistical signi
fi
cance was assessed following [
72
], repeating the comparison one
hun-dred times using ENMTools v1.0 software, which creates random samples, with replacement,
of the original locality data from the native and invaded ranges. The pseudo-replicate data
were then used as input in Maxent to produce a new pair of SDMs. Once the models are
creat-ed, ENMTools calculates
I
for each new pair of maps and provides an average [
72
].
Results
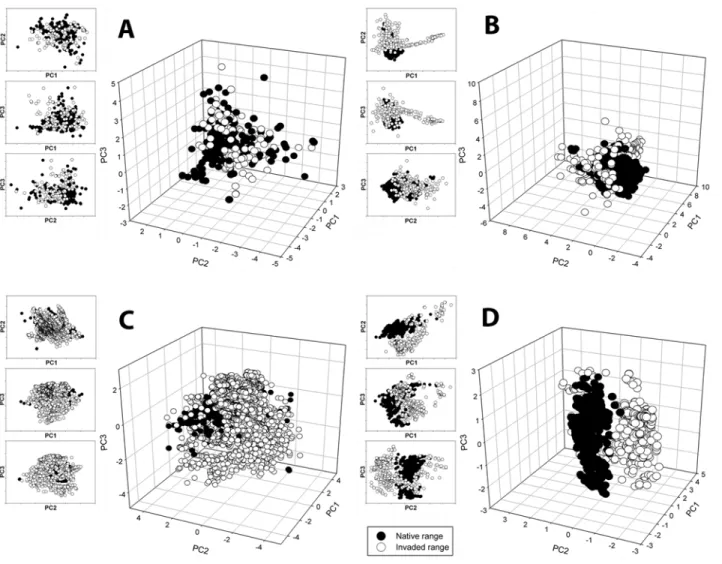
The evaluation of ecological niche transferability based on the Principal Component Analysis
(PCA) analysis produced four general categories of patterns. The first consisted of complete
niche overlap between the native and invaded environmental space (
Fig. 1A
). For
Bufo
mari-nus
,
Lantana camara
,
Leucaena leucocephala
and
Mimosa pigra
, the environmental space
oc-cupied by the species in the native range is almost identical to the environmental space
occupied by the invaded range as defined by the PCA.
The second observed pattern consisted of niche expansion in one direction. For
Cervus
ela-phus
,
Tamarix ramosissima
,
Sphagneticola trilobata
and
Ulex europaeus
, the environmental
space occupied by the native range is also shared by the invasive range; however the invasive
range also occupies areas of the environmental space that the native does not (
Fig. 1B
).
Impor-tantly, the difference is not in all directions of environmental space, but in only one direction,
suggesting that the species is expanding its niche along a few environmental variables while
maintaining its native relationship with niche space in others.
The third observed pattern is exhibited by
Sturnus vulgaris
,
Lythrum salicaria
and
Line-pithema humile
and reflects a multidirectional expansion of the invaded environmental space
in relation to the native niche. These species
’
invaded and native clouds overlap, however the
invaded range also expands along all three main PCA axes (
Fig. 1C
).
The final observed pattern is divergence of environmental space. For
Euphorbia esula
and
Rana catesbeiana
, native and invaded environmental spaces show a clear separation (
Fig. 1D
).
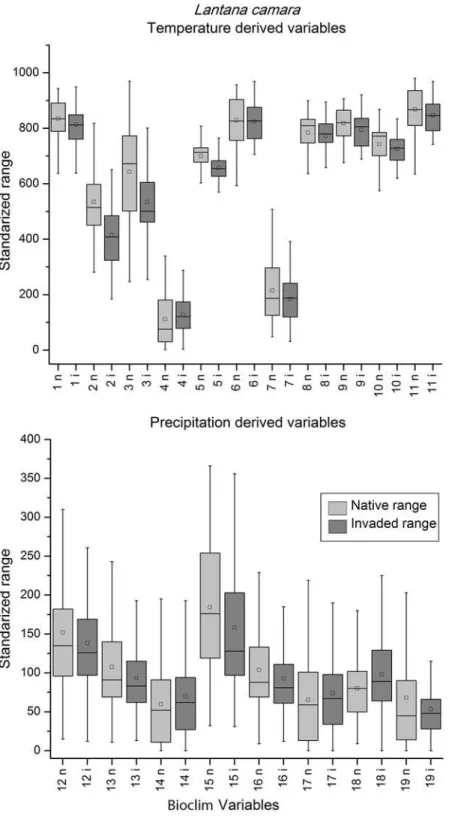
When the box-plots for all variables and species were examined, complete niche overlap
was easily distinguishable (
Fig. 2
). Box-plots of the species with directional expansion showed
that the directionality was attributable to either the temperature-derived variables or
precipita-tion, but not both (
Fig. 3
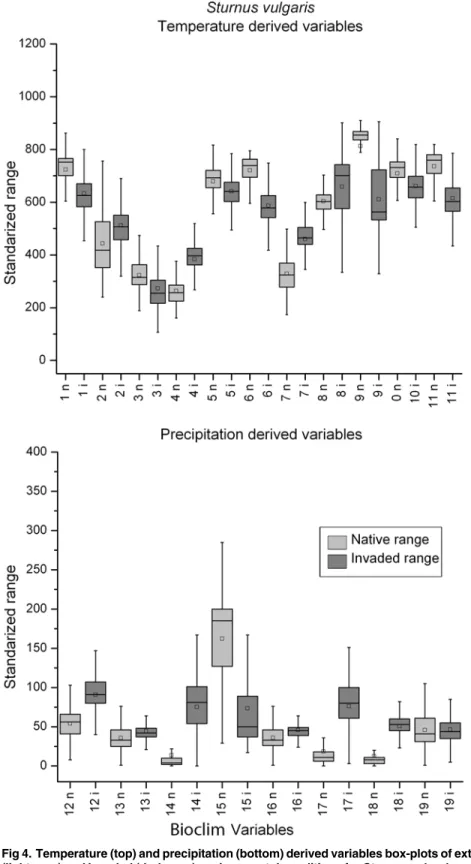
). The multidirectional expansion and non-overlap patterns were
diffi-cult to discern based on the box plots alone (Figs.
4
&
5
). In general, environmental differences
were more difficult to detect than similarities.
Close examination of the maps reveals that species that were ranked very high (i.e. high
transferability) by both tests show a high spatial overlap between the native range localities and
the SDM Maxent output based on the invaded localities (
Fig. 6
). The opposite is true for species
that were ranked very low (i.e., low transferability) by both tests; these species show almost no
spatial overlap between the native range localities and the SDM Maxent output based on the
in-vaded localities (
Fig. 7
).
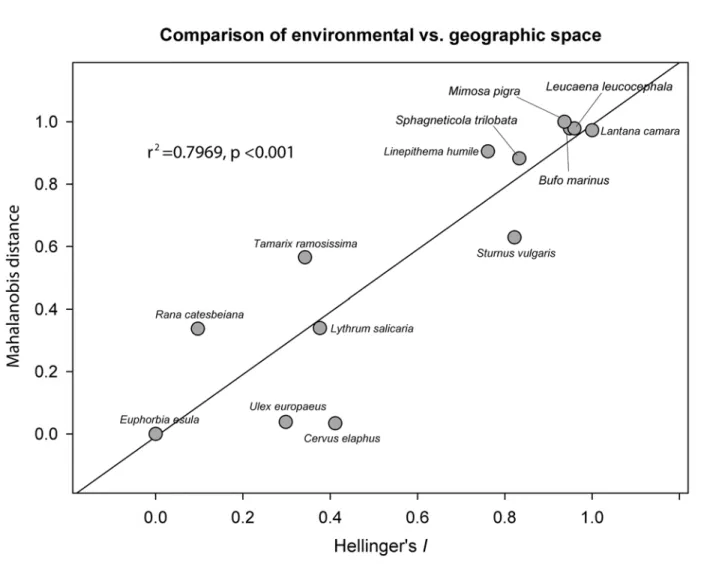
Finally comparison between the results of the Mahalanobis and Hellinger's
I
test (
Fig. 8
)
showed that both tests ranked the species similarly (r
2= 0.80, p
<
0.001). Species demonstrating
total niche overlap in environmental space were discriminated by both tests with
Discussion
Invasive species may respond to new environments in various ways, ranging from niche
con-servatism [
73
] to low transferability [
74
]. Our results suggest species responses to new
environ-ments can be categorized into four general classes: niche conservatism, niche expansion along
specific axes of either temperature- or precipitation-derived variables, niche expansion in
mul-tiple dimensions of environmental space, or complete dissociation between native and invaded
niches. These results suggest that niche transferability may be a largely species-specific
charac-teristic, although more in-depth studies of particular clades may better resolve correlations
be-tween responses and lineages or phenotypes.
While the invasive response of some of these 13 species have already been modeled and
ana-lyzed [
10
], [
75
], [
76
], [
36
], [
77
], niche transferability has not been assessed in conjunction with
standard SDM performance indices. Conclusions about the potential extent of suitable habitat
for a newly invaded species based on the environmental conditions of the native range will be
Fig 1. Results from the PCA analysis for: A:Leucaena leucocephala, an example of total overlap between native range and invaded range in environmental space. B:Ulex europaeus, an example of overlap in environmental space and directional expansion of invaded localities. C:Sturnus vulgaris, an example of multidimensional expansion of the invaded environmental space. D:Rana catesbeiana, an example of little overlap of the native and invadedenvironmental space.
Fig 2. Temperature (top) and precipitation (bottom) derived variables box-plots of extracted native (light grey) and invaded (dark grey) environmental conditions forLantana camara, a species with complete overlap in environmental space.The central rectangle spans the first quartile to the third quartile of the data, the small box represents the mode, the segment inside the rectangle shows the median and "whiskers" above and below the box show the locations of the minimum and maximum values. The numbers in x-axis represent the Bioclim layers.
Fig 3. Temperature (top) and precipitation (bottom) derived variables box-plots of extracted native (light grey) and invaded (dark grey) environmental conditions forCervus elaphus, a species with directional expansion.Refer to legend inFig. 2for box-plot interpretation.
Fig 4. Temperature (top) and precipitation (bottom) derived variables box-plots of extracted native (light grey) and invaded (dark grey) environmental conditions forSturnus vulgaris, a species with multidimensional expansion.Refer to legend inFig. 2for box-plot interpretation.
Fig 5. Temperature (top) and precipitation (bottom) derived variables box-plots of extracted native (light grey) and invaded (dark grey) environmental conditions forEuphorbia esula, a species with non-overlap in environmental space.Refer to legend inFig. 2for box-plot interpretation.
compromised if tests of transferability show a lack of niche conservatism. We recommend that
niche transferability assessments be considered standard practice in SDMs dealing with
inva-sive species [
78
].
In our analysis of niche transferability we worked under the assumption that the entire
range was limited by climate alone. However, some parts of a species
’
distribution can be
con-strained by climatic factors while other parts can be influenced by biotic interactions [
79
].
Given that the flora, fauna, and climate of an invaded landscape may be largely if not entirely,
novel (to the invader) and heterogenous, we should expect that some species will show different
distributions in an invaded region and perhaps different responses in different parts of that
range. If a species invades multiple regions, we might also expect its biotic interactions and
consequent distributions to be different in each region. In other words, we might expect the
distributions of invasive species to show a strong species-by-region interaction effect. Future
Fig 6.Lantana camara.Top: Localities from the native and invaded range (ellipse highlights the native range localities). Bottom: Map of bagging SDM Maxent results. Black shading represents areas predicted to be suitable by only the model trained with invaded range localities. Light grey shading represents areas predicted to be suitable by only the model trained with native range localities. Dark grey shading represents area of overlap between the models trained using native and invaded range localities.research should explore the idea that transferability, as a species characteristic, depends on
par-ticular geographies under analysis.
Furthermore, interpretation of species
’
biogeographic properties may depend on the scale
and spatial resolution of analysis [
12
]. As finer grain size is selected the responsible variables
will shift from climatic factors to local disturbances and biotic factors [
80
]. Our global analysis
used one square kilometer grain size as a compromise between file size and data availability;
fu-ture studies may fruitfully investigate the threshold spatial resolution at which climatic
deter-minants give way to biotic interactions as the strongest correlates defining species range limits.
Multiple statistical tests accompanied by multidimensional visualizations of environmental
and geographic space may be required to improve understanding of species dynamics in the
in-vaded range. Many indices of degree of niche similarity (i.e. Kappa, Fuzzy Kappa, Euclidean
distance, Schoener
D
, modified Hellinger
I
) have been used in previous research on ecological
divergence and speciation [
81
], [
82
], [
72
] as well as SDM uncertainty evaluation [
18
].
Fig 7.Euphorbia esula.Top: Localities from the native and invaded range (ellipse highlights the native range localities). Bottom: Map of bagging SDM Maxent results. Black shading represents areas predicted to be suitable by only the model trained with invaded range localities. Light grey shading represents areas predicted to be suitable by only the model trained with native range localities. Dark grey shading represents area of overlap between the models trained using native and invaded range localities.Investigating both approaches
—
comparing environmental spaces and evaluating geographic
projections of environmental space
—
shows similar but not identical inferences (
Fig. 8
) and
that a single measure of ecological niche transferability may provide a generally accurate but
imprecise picture.
Poorly constrained predictions, which complicate translating research results into
manage-ment strategies, are a common hurdle for resource managers. Since managemanage-ment strategies are
often the goal of invasive species modeling research, we offer an example of how our results
can be applied directly.
Rana catesbeiana
is native to eastern North America and considered
one of the most harmful amphibian invasive species. First, we distinguished native from
invad-ed localities of
R
.
catesbeiana
using the geographic regions designated in [
77
], [
36
], then
com-pared environmental space as described in our
Methods
.
R
.
catesbeiana
has very low
transferability values (
I
= 0.096, Mahalanobis = 0.338), indicating a clear separation of
occu-pied ecological space between native and invaded ranges. If [
77
], [
36
] had evaluated niche
transferability, they would have found that
R
.
catesbeiana
has the ability to invade
environmen-tal space very unlike that of its native range, thus appropriately reducing confidence in
Fig 8. Comparison of environmental vs. geographic space.Comparison of the Mahalanobis distance and the Hellinger'sItests distinguishes species with complete overlap between native and invaded range from species, but it does not discern amongst the other three categories where niche space is less conserved. Values were rescaled from 0 to 1; 0 represents low relative similarity and 1 represents high relative similarity.
predictions of their SDM. This clearer understanding of the dynamics of
R
.
catesbeiana
in its
invaded range emphasizes the importance of control programs preventing transport from
source locations, since invaded locations cannot necessarily be predicted from native
distribu-tions. Testing for niche transferability can help inform the appropriate use of SDM in modeling
biological invasions and thereby improve invasion management strategies.
Acknowledgments
We thank Carlos Zambrana-Torrelio, Stanley Blum and Jack Dumbacher for helpful critique
of an earlier version of this manuscript.
Author Contributions
Conceived and designed the experiments: MF HH. Performed the experiments: MF. Analyzed
the data: MF HH. Wrote the paper: MF HH. Contributed analysis tools: MF HH.
References
1. Franklin J. Mapping species distributions: spatial inference and prediction. Cambridge: Cambridge University Press; 2009.
2. Hegel TM, Cushman SA, Evans J, Huettmann F. Current state of the art for statistical modelling of spe-cies distributions. In: Cushman SA, Huettmann F. Spatial complexity, informatics, and wildlife conser-vation. New York: Springer; 2010. pp. 273–311.
3. Peterson A, Vieglais D. Predicting Species Invasions Using Ecological Niche Modeling: New Ap-proaches from Bioinformatics Attack a Pressing Problem. BioScience. 2001; 51: 363–371. doi:10. 1385/1-59259-087-X:363PMID:21331730
4. Araujo M, Pearson R, Thuiller W, Erhard M. Validation of species-climate impact models under climate change. Global Change Biology. 2005; 11: 1504–1513.
5. Carroll C. Role of climatic niche models in focal-species-based conservation planning: assessing po-tential effects of climate change on Northern Spotted Owl in the Pacific Northwest, USA. Biological Conservation. 2010; 143: 1432–1437.
6. Oberhauser K, Peterson A. Modeling current and future potential wintering distributions of eastern North American monarch butterflies. Proceedings of the National Academy of Sciences. 2003; 100: 14063–14068. PMID:14612569
7. Tingley MW, Monahan WB, Beissinger SR, Moritz C. Birds track their Grinnellian niche through a centu-ry of climate change. Proceedings of the National Academy of Sciences. 2009; 106: 19637–19643.
8. Neubert M, Parker I. Projecting Rates of Spread for Invasive Species. Risk Analysis. 2004; 24: 817–831. PMID:15357802
9. Peterson A. Predicting the Geography of Species' Invasions via Ecological Niche Modeling. The Quar-terly Review of Biology. 2003; 78: 419–433. PMID:14737826
10. Roura-Pascual N, Brotons L, Peterson AT, Thuiller W. Consensual predictions of potential distributional areas for invasive species: a case study of Argentine ants in the Iberian Peninsula. Biological Invasions. 2009; 11: 1017–1031.
11. Smolik M, Dullinger S, Essl F, Kleinbauer I, Leitner M, et al. Integrating species distribution models and interacting particle systems to predict the spread of an invasive alien plant. Journal of Biogeography. 2010; 37: 411–422.
12. Pearson R, Dawson T. Predicting the impacts of climate change on the distribution of species: are bio-climate envelope models useful? Global Ecology and Biogeography. 2003; 12: 361–371.
13. Araujo M, Guisan A. Five (or so) challenges for species distribution modelling. Journal of Biogeography. 2006; 33: 1677–1688.
14. Davis AJ, Jenkinson LS, Lawton JH, Shorrocks B, Wood S. Making mistakes when predicting shifts in species range in response to global warming. Nature. 1998; 391: 783–785. PMID:9486646
15. Pearman P, Guisan A, Broennimann O, Randin C. Niche dynamics in space and time. Trends in Ecolo-gy & Evolution. 2008; 23: 149–158.
17. Hernandez P, Graham C, Master L, Albert D. The effect of sample size and species characteristics on performance of different species distribution modeling methods. Ecography. 2006; 29: 773–785.
18. Fernández M, Blum S, Reichle S, Guo Q, Holzman B, et al. Locality uncertainty and the differential per-formance of four common niche-based modeling techniques. Biodiversity Informatics. 2009; 6. 19. Dormann CF. Response to Comment on‘‘Methods to account for spatial autocorrelation in the analysis
of species distributional data". Ecography. 2009; 32: 379–381.
20. Parra JL, Graham CC, Freile JF. Evaluating alternative data sets for ecological niche models of birds in the Andes. Ecography. 2004; 27: 350–360.
21. Peterson A, Nakazawa Y. Environmental data sets matter in ecological niche modelling: an example
withSolenopsis invictaandSolenopsis richteri. Global Ecology and Biogeography. 2008; 17: 135–144.
22. Menke SB, Holway DA, Fisher RN, Jetz W. Characterizing and predicting species distributions across environments and scales: Argentine ant occurrences in the eye of the beholder. Global Ecology and Biogeography. 2009; 18: 50–63.
23. Beever EA, Swihart RK, Bestelmeyer BT. Linking the concept of scale to studies of biological diversity: evolving approaches and tools. Diversity and Distributions. 2006; 12: 229–235.
24. Hortal J, Roura-Pascual N, Sanders N, Rahbek C. Understanding (insect) species distributions across spatial scales. Ecography. 2010; 33: 51.
25. Anderson R, Lew D, Peterson A. Evaluating predictive models of species’distributions: criteria for
se-lecting optimal models. Ecological Modelling. 2003; 162: 211–232.
26. Brotons L, Thuiller W, Araújo MB, Hirzel AH. Presence-absence versus presence-only modelling meth-ods for predicting bird habitat suitability. Ecography. 2004; 27: 437–448.
27. Elith J, Graham H, Anderson P, Dudik M, Ferrier S, et al. Novel methods improve prediction of species distributions from occurrence data. Ecography. 2006; 29: 129–151. PMID:16622301
28. Graham CH, Hijmans RJ. A comparison of methods for mapping species ranges and species richness. Global Ecology and Biogeography. 2006; 15: 578–587.
29. Peterson AT, PapeşM, Soberon J. Rethinking receiver operating characteristic analysis applications in
ecological niche modeling. Ecological Modelling. 2008; 213: 63–72.
30. Liu C, Berry P, Dawson T, Pearson R. Selecting thresholds of occurrence in the prediction of species distributions. Ecography. 2005; 28: 385–393.
31. Beale CM, Lennon JJ, Gimona A. Opening the climate envelope reveals no macroscale associations with climate in European birds. Proceedings of the National Academy of Sciences. 2008; 105: 14908–14912. doi:10.1073/pnas.0803506105PMID:18815364
32. Sax D, Stachowicz J, Brown J, Bruno J, Dawson M, et al. Ecological and evolutionary insights from spe-cies invasions. Trends in Ecology & Evolution. 2007; 22: 465–471.
33. Guisan A, Thuiller W. Predicting species distribution: offering more than simple habitat models. Ecology Letters. 2005; 8: 993–1009.
34. Hampe A. Bioclimate envelope models: what they detect and what they hide. Global Ecology and Bio-geography. 2004; 13: 469–471.
35. Dunlop E, Wilson J, Mackey A. The potential geographic distribution of the invasive weedSenna
obtu-sifoliain Australia. Weed Research. 2006; 46: 404–413.
36. Ficetola G, Thuiller W, Miaud C. Prediction and validation of the potential global distribution of a prob-lematic alien invasive species-the American bullfrog. Diversity and Distributions. 2007; 13: 476–485. 37. Gilman SE, Urban MC, Tewksbury J, Gilchrist GW, Holt RD. A framework for community interactions
under climate change. Trends in Ecology & Evolution. 2010; 25: 325–331.
38. Thuiller W, Brotons L, Araujo M, Lavorel S. Effects of restricting environmental range of data to project current and future species distributions. Ecography. 2004; 27: 165–172.
39. Lockwood J, Hoopes M, Marchetti M: Invasion Ecology. 2nd ed. Oxford: Wiley-Blackwell; 2013. 40. Dawson MN, Grosberg RK, Stuart YE, Sanford E. Population genetic analysis of a recent range
expan-sion: mechanisms regulating the poleward range limit in the volcano barnacleTetraclita rubescens. Mo-lecular ecology. 2010; 19: 1585–1605. doi:10.1111/j.1365-294X.2010.04588.xPMID:20345681
41. Lavergne S, Muenke NJ, Molofsky J. Genome size reduction can trigger rapid phenotypic evolution in invasive plants. Annals of Botany. 2010; 105: 109–116. doi:10.1093/aob/mcp271PMID:19887472
42. Ridley CE, Ellstrand NC. Rapid evolution of morphology and adaptive life history in the invasive Califor-nia wild radish (Raphanus sativus) and the implications for management. Evolutionary Applications. 2010; 3: 64–76. doi:10.1111/j.1752-4571.2009.00099.xPMID:25567904
44. Midgley G, Hughes G, Thuiller W, Rebelo A. Migration rate limitations on climate change-induced range shifts in Cape Proteaceae. Diversity and Distributions. 2006; 12: 555–562.
45. Thuiller W, Lavorel S, Sykes MT, Araújo MB. Using niche-based modelling to assess the impact of cli-mate change on tree functional diversity in Europe. Diversity and Distributions. 2006; 12: 49–60. 46. Barson N, Cable J, Van Oosterhout C. Population genetic analysis of microsatellite variation of guppies
(Poecilia reticulata) in Trinidad and Tobago: evidence for a dynamic source-sink metapopulation
struc-ture, founder events and population bottlenecks. Journal of Evolutionary Biology. 2009; 22: 485–497. doi:10.1111/j.1420-9101.2008.01675.xPMID:19210594
47. Kanda LL, Fuller TK, Sievert PR, Kellogg RL. Seasonal source-sink dynamics at the edge of a species' range. Ecology. 2009; 90: 1574–1585. PMID:19569372
48. Vaughan I, Ormerod S. The continuing challenges of testing species distribution models. Journal of Ap-plied Ecology. 2005; 42: 720–730.
49. Fielding A, Bell J. A review of methods for the assessment of prediction errors in conservation presence/absence models Environmental. Conservation. 1997; 24: 38–49.
50. Jeschke J, Strayer D. Usefulness of Bioclimatic Models for Studying Climate Change and Invasive Spe-cies. Annals of the New York Academy of Sciences. 2008; 1134: 1–24. doi:10.1196/annals.1439.002
PMID:18566088
51. Heikkinen RK, Luoto M, Araújo MB, Virkkala R, Thuiller W, et al. Methods and uncertainties in bioclimat-ic envelope modelling under climate change. Progress in Physbioclimat-ical Geography. 2006; 30: 751–777. 52. Araujo M, Rahbek C. How does climate change affect biodiversity? Science. 2006; 313: 1396–1397.
PMID:16959994
53. Peterson AT, PapeşM, Eaton M. Transferability and model evaluation in ecological niche modeling: a
comparison of GARP and Maxent. Ecography. 2007; 30: 550–560.
54. Phillips S. Transferability, sample selection bias and background data in presence-only modelling: a re-sponse to Peterson et al.(2007). Ecography. 2008; 31: 272–278.
55. Broennimann O, Treier UA, Muller-Scharer H, Thuiller W, Peterson AT, et al. Evidence of climatic niche shift during biological invasion. Ecology Letters. 2007; 10: 701–709. PMID:17594425
56. Martinez-Meyer E, Peterson AT. Conservatism of ecological niche characteristics in North American plant species over the Pleistocene-to-Recent transition. Journal of Biogeography. 2006; 33: 1779–1789.
57. Rödder D, Lötters S. Niche shift versus niche conservatism? Climatic characteristics of the native and invasive ranges of the Mediterranean house gecko (Hemidactylus turcicus). Global Ecology and Bioge-ography. 2009; 18: 674–687.
58. Wiens JJ, Graham CH. Niche Conservatism: Integrating Evolution, Ecology, and Conservation Biology. Annual Review of Ecology, Evolution, and Systematics. 2005; 36: 519–539.
59. Lowe S, Browne M, Boudjelas S, De Poorter M. 100 of the world's worst invasive alien species: a selec-tion from the global invasive species database: Invasive Species Specialist Group Auckland, New Zea-land. 2000. Available:http://www.issg.org/database/species/search.asp?st= 100ss.
60. Hijmans R, Cameron S, Parra J, Jones P, Jarvis A. Very high resolution interpolated climate surfaces for global land areas. International Journal of Climatology. 2005; 25: 1965–1978.
61. Odland A, Birks H. The altitudinal gradient of vascular plant richness in Aurland, western Norway. Eco-graphy. 1999; 22: 548–566.
62. Özesmi U, Mitsch W. A spatial habitat model for the marsh-breeding red-winged blackbird (Agelaius
phoeniceus L.) in coastal Lake Erie wetlands. Ecological Modelling. 1997; 101: 139–152.
63. Colwell RK, Rangel TF. Hutchinson's duality: the once and future niche. Proceedings of the National Academy of Sciences. 2009; 106: 19651–19658.
64. Soberón J, Nakamura M. Niches and distributional areas: concepts, methods, and assumptions. Pro-ceedings of the National Academy of Sciences. 2009; 106: 19644–19650. doi:10.1073/pnas. 0901637106PMID:19805041
65. Pearson K. On lines and planes of closest fit to systems of points in space, Philosoph. Philosophical Magazine. 1901; 6: 559–572.
66. Hotelling H. Analysis of a complex of statistical variables into principal components. Journal of Educa-tional Psychology. 1933; 24: 417–441.
67. McGarigal K, Cushman S, Stafford SG. Multivariate statistics for wildlife and ecology research New York: Springer-Verlag; 2000.
69. De Maesschalck R, Jouan-Rimbaud D, Massart D. The mahalanobis distance. Chemometrics and In-telligent Laboratory Systems. 2000; 50: 1–18.
70. Phillips SJ, Dudik M. Modeling of species distributions with Maxent: new extensions and a comprehen-sive evaluation. Ecography. 2008; 31: 161–175.
71. Elith J, Leathwick JR. Species distribution models: ecological explanation and prediction across space and time. Annual Review of Ecology, Evolution, and Systematics. 2009; 40: 677–697.
72. Warren D, Glor R, Turelli M. Environmental niche equivalency versus conservatism: quantitative ap-proaches to niche evolution. Evolution. 2008; 62: 2868–2883. doi:10.1111/j.1558-5646.2008.00482.x
PMID:18752605
73. Strauss B, Biedermann R. Evaluating temporal and spatial generality: How valid are species—habitat relationship models? Ecological Modelling. 2007; 204: 104–114.
74. Zanini F, Pellet J, Schmidt BR. The transferability of distribution models across regions: an amphibian case study. Diversity and Distributions. 2009; 15: 469–480.
75. Anderson R, Peterson A, Egbert S. Vegetation-index models predict areas vulnerable to purple loose-strife (Lythrum salicaria) invasion in Kansas. The Southwestern Naturalist. 2006; 51: 471–480. 76. Roura-Pascual N, Suarez AV, McNyset K, Gómez C, Pons P, et al. Niche differentiation and fine-scale
projections for Argentine ants based on remotely sensed data. Ecological Applications. 2006; 16: 1832–1841. PMID:17069375
77. Giovanelli J, Haddad C, Alexandrino J. Predicting the potential distribution of the alien invasive Ameri-can bullfrog (Lithobates catesbeianus) in Brazil. Biological Invasions. 2008; 10: 585–590.
78. Urban MC, Phillips BL, Skelly DK, Shine R. The cane toad's (Chaunus [Bufo] marinus) increasing ability to invade Australia is revealed by a dynamically updated range model. Proceedings of the Royal Socie-ty B: Biological Sciences. 2007; 274: 1413–1419. PMID:17389221
79. Lenoir J, Gégout JC, Guisan A, Vittoz P, Wohlgemuth T, et al. Going against the flow: potential mecha-nisms for unexpected downslope range shifts in a warming climate. Ecography. 2010; 33: 295–303. 80. Soberón J. Grinnellian and Eltonian niches and geographic distributions of species. Ecology Letters.
2007; 10: 1115–1123. PMID:17850335
81. Peterson A, Soberón J, Sánchez-Cordero V. Conservatism of ecological niches in evolutionary time. Science. 1999; 285: 1265–1267. PMID:10455053