Susceptibility to Chytrid Infection
Alena S. Gsell1*, Lisette N. de Senerpont Domis1, Ellen van Donk1,2, Bas W. Ibelings1,3
1Department of Aquatic Ecology, Netherlands Institute of Ecology (NIOO-KNAW), Wageningen, The Netherlands,2Department of Biology, University of Utrecht, Utrecht, The Netherlands,3Microbial Ecology, Institut F.-A. Forel, Universite´ de Gene`ve, Versoix, Switzerland
Abstract
The cost of parasitism often depends on environmental conditions and host identity. Therefore, variation in the biotic and abiotic environment can have repercussions on both, species-level host-parasite interaction patterns but also on host genotype-specific susceptibility to disease. We exposed seven genetically different but concurrent strains of the diatom Asterionella formosato one genotype of its naturally co-occurring chytrid parasiteZygorhizidium planktonicumacross five environmentally relevant temperatures. We found that the thermal tolerance range of the tested parasite genotype was narrower than that of its host, providing the host with a ‘‘cold’’ and ‘‘hot’’ thermal refuge of very low or no infection. Susceptibility to disease was host genotype-specific and varied with temperature level so that no genotype was most or least resistant across all temperatures. This suggests a role of thermal variation in the maintenance of diversity in disease related traits in this phytoplankton host. The duration and intensity of chytrid parasite pressure on host populations is likely to be affected by the projected changes in temperature patterns due to climate warming both through altering temperature dependent disease susceptibility of the host and, potentially, through en- or disabling thermal host refugia. This, in turn may affect the selective strength of the parasite on the genetic architecture of the host population.
Citation:Gsell AS, de Senerpont Domis LN, van Donk E, Ibelings BW (2013) Temperature Alters Host Genotype-Specific Susceptibility to Chytrid Infection. PLoS ONE 8(8): e71737. doi:10.1371/journal.pone.0071737
Editor:Daniel E. Rozen, Leiden University, Netherlands
ReceivedMay 5, 2013;AcceptedJuly 9, 2013;PublishedAugust 26, 2013
Copyright:ß2013 Gsell et al. This is an open-access article distributed under the terms of the Creative Commons Attribution License, which permits unrestricted use, distribution, and reproduction in any medium, provided the original author and source are credited.
Funding:The authors’ work is supported by NWO-ALW grant 816.01.018 to EvD and BWI and 817.01.007 to LNdSD. The funders had no role in study design, data collection and analysis, decision to publish, or preparation of the manuscript.
Competing Interests:The authors have declared that no competing interests exist.
* E-mail: [email protected]
Introduction
Parasitism is one of the most common consumer strategies [1] and can impose large fitness costs on host individuals and populations. However, the level of host susceptibility to disease often depends on the biotic and abiotic environmental context [2]. This interdependency between host, parasite and their shared environment was first formulated in the disease triangle concept [3]. Environmental conditions affect the population dynamics of hosts and parasites, but also the strength and nature of the host-parasite interaction [4]. Variation in the environmental context such as nutrient enrichment, can, for example, shift the character of the interaction from mutualism to antagonism in plants and their mycorrhizal fungi [5]. Environmental variability can also cause more subtle changes in the strength of host-parasite interactions by slowing down or disrupting parasite mediated directional selection on the host population [4]. Moreover, environmental variability can also maintain genetic diversity in disease related traits of the host if the disease resistance of a host genotype varies with environmental conditions so that no genotype is overall the most or least susceptible to disease across all environments [6]. In that case, no host genotype can out-compete all others permanently as the fitness based ranking order of genotypes varies across environmental gradients in space and/or time [7].
Temperature is probably the most pervasive environmental variable and influences the metabolic rates of all organisms [8,9]. Nevertheless, the specific temperature effects on host-parasite
exceeding 90% in many cases [12,25]. Field observations showed that the development of Asterionella spring-blooms depends on water temperatures in early spring as Asterionella already repro-duces at temperatures below 3uC, while the parasite is still inactive [26]. This mismatch in thermal ranges provides the host with a low temperature window of disease-free population growth which bears consequences for the size the diatom spring-bloom [12] and its genetic structure [27]. Warmer winters in which water temperature stays above 3uC remove this window of opportunity since the parasite remains active, denying the host the ability to build up a bloom [12]. Knowledge on variation in thermal tolerance of a wider set of chytrid parasites will help assessing the implications of climate change on host-chytrid interactions in general. We add to this by contributing a case-study on thermal reaction norms in a chytrid-diatom model-system.
Species- and genotype-level host-parasite interaction patterns are expected to depend on their environmental conditions, in particular on their temperature environment. In order to test thermal reaction norms of Asterionella formosa susceptibility to chytrid infection, we performed an infection experiment using seven concurrent genotypes of the diatom host exposed to a single genotype of its chytrid parasiteZygorhizidium planktonicum across a range of environmentally relevant temperatures. We assessed host and parasite thermal tolerance range and optima for activerepro-duction. Furthermore, we tested for host genotype (G) and temperature (T) main effects and for host genotype-by-tempera-ture (GxT) interactions in net production of host and parasite. As the host genotypes also showed temperature-dependent differences in cell-size, we checked the extent of co-linearity of host cell size and genotype effects on host susceptibility to disease.
Materials and Methods
Host-parasite system
Asterionella formosa is a pennate diatom that forms uniclonal, stellate colonies. It is a characteristic spring-bloom diatom of temperate lakes [28] but can also bloom in late summer. In Lake Maarsseveen (The Netherlands, E 05u059 08", N 52u 089 34"), Asterionella blooms are often followed by chytrid epidemics exceeding 90% prevalence of infection [29]. Despite predomi-nantly (or exclusively) asexual reproduction ofAsterionella[30], the population in Lake Maarsseveen is genetically highly diverse [27,31]. This diversity is also reflected in phenotypic variation in fitness traits across a temperature gradient [32] and in resistance to parasitism [31].
The chytrid parasiteZygorhizidium planktonicumis an obligate and highly virulent parasite of the diatoms Asterionella formosa and SynedraacusKu¨tzing [24]. Chytrid epidemics can bring Asterionella spring blooms to a swift end and can therefore affect the phytoplankton succession in lakes [25,26]. Each infection prohibits host reproduction and quickly kills the host [33]. Transmission occurs by motile zoospores that actively search for host cells, guided by chemotaxis to photosynthetic exudates of their host [34]. After attachment, the zoospores grow into epibiontic sporangia, within which the next generation of zoospores is formed and eventually released by rupture of the sporangium wall [35]. Sporangia development time, zoospore production per sporangium, and zoospore infective lifetime all depend on their current temperature environment [36]. After sexual reproduction and at temperatures below 3uC,Zygorhizidium forms thick-walled resting spores which are inactive and allow the parasite to weather adverse periods [26].
Isolation of experimental strains
All Asterionella formosagenotypes used in the experiment were isolated from a single water sample taken during the 2008 Asterionellaspring-bloom at 5 m depth in Lake Maarsseveen. Host culture establishment was fairly unbiased with a larger than 95% success rate. As all cells of an Asterionellacolony are the asexual offspring of a founding cell, isolating single colonies is an easy way to obtain uniclonal cultures of this diatom. Individual isolates were grown in batch culture on CHU-10 medium [37] modified with 2-fold concentrations of PO4and FeCl3. For genetic fingerprinting,
50mL of dense culture were centrifuged, and the DNA of the remaining pellet was extracted by a modified QiagenDNeasy Plant Mini Kit (QiagenN.V.,Venlo, the Netherlands) protocol (see file S1 for DNA extraction details). Genetic fingerprinting was done by amplified fragment length polymorphism (AFLP), using four primer combinations: (i) Eco+GA &Mse+AT, (ii) Eco+GA &Mse+CC, (iii) Eco+GA &Mse+CG, and (iv) Eco+GC &Mse +AC. The AFLP fingerprinting of the seven experimental and the parasite baiting genotypes ofAsterionella formosaas well as of one Fragilariacrotonensis genotype (functioning as out-group) was per-formed by KeygeneH (Keygene N.V., Wageningen, The Nether-lands), details of the AFLP data analysis are presented in the file S1 accompanying this paper.
Isolation of uniclonalZygorhizidium planktonicumcultures from the same bloom/epidemic occurred by transfer of infectedAsterionella colonies carrying only one single sporangium into a uniclonal culture of Asterionella S122 (Lake Maarsseveen, isolated 2008). Establishing parasite cultures was less successful with only 20 infected cultures out of over 400 isolation attempts. This lower success may suggest, that, by baiting the parasite with a uniclonal host culture, we actually screened for parasite genotypes able to infect this specific host genotype. Hence, our collection of parasite isolates may well represent a limited range of the genetic variation present in Lake Maarsseveen. Since we used only one uniclonal isolate of the parasite, we did not assess the genetic diversity of our isolate collection. Host and parasite cultures were maintained in semi-continuous batch cultures in environment test chambers (SANYO Electric, Moriguchi, Japan) at 18uC61uC and 14: 10 h light:dark cycle at 50mmol quanta s–1m–2provided by cool-white fluorescent lamps (TL-D 30W/830, Philips, Amsterdam, The Netherlands). All cultures were uniclonal but had slight bacterial contaminations.
Experimental design and methodology
The experiment employed a full-factorial design with seven Asterionella genotypes (S24, S26, S37, S38, S43, S49 and S53) exposed to one Zygorhizidium genotype (F12) at five different temperatures (1uC, 6uC, 11uC, 16uC and 21uC60.5uC ) in five replicates. This resulted in 35 experimental combinations and 175 experimental units. To compare the performance ofAsterionellain parasite exposed and non-exposed populations, non-exposed controls of the seven Asterionella genotypes were grown at the same experimental temperatures resulting in 35 control units (one per temperature-host strain combination).
For temperature acclimation, parasite exposed and non-exposed stock cultures of each host genotype were split into five subcultures and stepwise acclimated in semi-continuous batch cultures in temperature-controlled water baths for at least five generations prior to the experiment [38]. The light was set to 160610mmol
To start the experiment, each experimental and control unit was inoculated from the corresponding non-exposed subculture to a starting concentration of ca. 15 000 uninfected host cells mL–1 into a total volume of 60 mL CHU-10 medium [37]. Parasite exposure was achieved by inoculating ca. 5 000 live infection carrying host cells mL–1 from a nearly 100% infected, tempera-ture- and host genotype-matching exposed subculture. Based on results of pre-experiment trials, the host inoculum of ca 15 000 cells mL–1was small enough to ensure that the culture medium
could support several generations of unlimited host growth before light or nutrient availability could become limiting in the batch set up, but also large enough to support the infection. Similarly, the parasite inoculum of ca 5 000 live infection carrying cells mL–1(i.e. a starting prevalence of ca 25%) was large enough to follow both increase and decrease in prevalence over time. All experimental and control units were started on the same day. Each unit was shaken manually twice and their position within the water bath was randomized once each day. Samples for microscopy enumeration were taken every second day for the temperatures 6uC to 21uC and every fifth day for temperature 1uC. All samples were taken at the same moment in the light cycle, fixed with a Glutaraldehyde-Formaldehyde mixture (to a final concentration of 0.01%) and stored cool and dark.
Counting protocol
A minimum of 200 Asterionellacells or 20 fields of view were counted in a 1 mL sample under an inverted microscope (Leica, DMI 4000B, Wetzlar, Germany) according to the Utermo¨hl settling method [39]. Each sample was counted for abundance of: (i) living uninfected host cells mL–1 (uninf); (ii) infected host cells carrying one or more living infection(s) mL–1(inf); (iii) infected host cells carrying only dehisced / dead infection(s) mL–1; (iv) sporangia mL–1, and (v) resting spores mL–1. Infection prevalence, i.e. proportion of cells carrying live infections in the live host population, was calculated asinf/(uninf+inf).Asterionellacells carry-ing empty or dead sporangia, i.e. class (iii), were excluded from the calculation of infection prevalence as they did not contribute further to population growth of the host or the parasite.
Statistical analysis
To assess the thermal ranges of hosts and parasites, the rate of change day–1foruninf, inf, the combineduninf+infand for parasite sporangia in the experimental units, were averaged over all host genotypes and plotted against temperature. The host genotype-specific rate of change day–1of each variable was calculated as
d(x) d(t)~
xend{xstart ttot
wherebyxis the abundance of either uninfected or infected host cells and parasite sporangia on the last day of the experiment (xend) and the first day of the experiment (xstart) respectively. Further-more,ttotis the total number of experimental days.
To work with comparable experimental times and include at least three samples, the first ten days for temperature treatments 1uC to 16uC were used in the statistical analysis. For treatment 21uC only the first six days were included as the infection had cleared and the host population was approaching carrying capacity, hence analysing a longer interval would have resulted in underestimating host production. The response variables were the net production of uninfected (P uninf) and infected (P inf) host cells mL–1, net production of parasite sporangia mL–1(P spor), net increase/decrease in infection prevalence (P prev) and the infection
related percentaged reduction in production of uninf cells (% reduction). The net production (P x) variables were calculated as
P x~xend{xstart
And the % reductionof the production of uninfected cells was calculated as
%reduction~P uninfcont unit{P uninfexp unit
P uninfcont unit 100
wherebyP uninfcont unitis the net production of uninfected cells mL–1in control units, and P uninfexp unit is the net production of uninfected cells mL–1in experimental units.
Within our wide experimental temperature spectrum, all response variables showed non-linear relationships with the explanatory variable temperature. To allow for these non-linear relationships a generalised additive model (GAM) [40] was employed, using package ‘‘mgcv’’ [41] in R v.2.13.1 [42]. This additive model fits a smoothing curve through the data, in this case based on thin plate regression splines. As overfitting can be a problem in GAM models [40], we selected the most parsimonious model based on F-tests between models of increasing complexity, starting with the simplest model, including only the predictor ‘‘temperature treatment’’. In addition, the generalised cross-validation (GCV) scores (estimating the optimal amount of smoother) were compared: the lower the GCV score of a model, the better the model fit. All variables were checked for normality and heteroscedasticity of variance prior to analyses. The variableP infwas sqrt-transformed to remove heteroscedasticity; however its variances did not co-vary with temperature (data not shown). All statistical analyses and plot graphing were carried out in R [42] and SigmaPlot 11.0 (Systat Software, San Jose, U.S.).
Results
AFLP fingerprinting
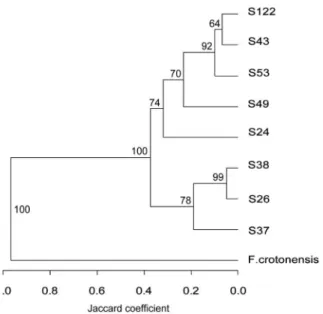
The AFLP analysis of uniclonal cultures of eight Asterionella formosa and oneFragilariacrotonensis yielded 113 marker bands, of which 69% were polymorph. Each uniclonal culture showed a unique fingerprint pattern and therefore represented a unique genotype. The UPGMA dendrogram (Fig. 1) showed Fragilariacro-tonensis as a clear out-group and clustered the Asterionella formosa genotypes in broadly two clusters of three and five genotypes. The dendrogram was a good representation of the Jaccard’s similarity matrix as the cophenetic correlation coefficient was r = 0.98 (Mantel testP= 0.001). Most of the nodes were supported well as shown by bootstrap resampling (n = 5000) results (Fig. 1). How-ever, the distinction between S122 and S43 was not well supported. Nevertheless, given the empirical data, the presented dendrogram is the best possible representation of the data.
Thermal tolerance ranges
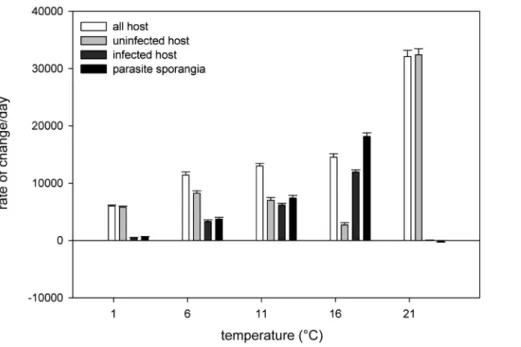
limit. Optimum performance temperature of the host in the experiment was achieved at 21uC, that of the parasite around 16uC. The tested parasite genotype showed a narrower tolerance range than the host, and the relationship between host and parasite changed with temperature level. At the two lowest temperatures, both uninfected host and parasite showed positive net production, but the uninfected host outperformed the parasite. At temperature 1uC, parasite production occurred mainly as resting spores, which stay inactive as long as the temperature remains too low for parasite reproduction. At intermediate temperatures (11 and 16uC), the parasite outperformed the uninfected host performance, which was also reflected in large increases in infection prevalence in these treatments. But at the highest temperature the uninfected host outperformed the parasite again as the lethal temperature limit of the tested parasite genotype was surpassed. Hence, in our experiment, the host had two thermal refugia (a ‘‘cold’’ and a ‘‘hot’’ one) of very low or no parasite pressure.
Main and interactive effects of host genotype
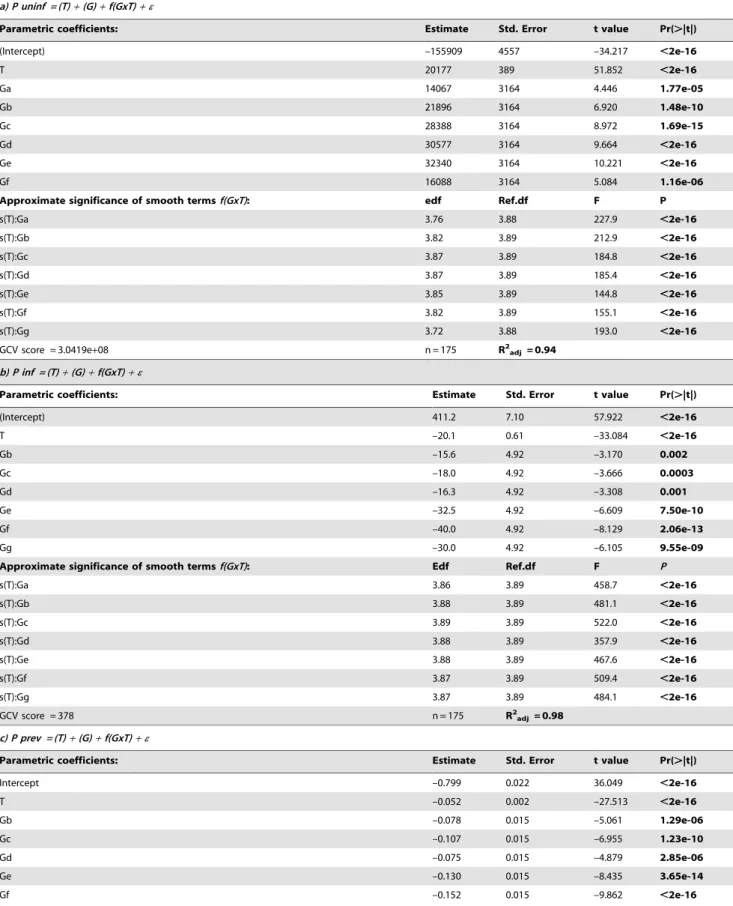
The most parsimonious GAM model included main effects of temperature (T) and host genotype (G), as well as genotype-by-temperature interaction (GxT) effects (Table S1):
Responsevariable~TzGzf(GxT)zei
whereby we employed a non-parametric smoothing functionf (based on thin plate regression splines), a Gaussian error distribution ei, and a link function by identity. Main and
interaction effects were significant for each of the four response variables: net production of uninfected (P uninf; Table 1a) and infected (P inf; Table 1b) host cells mL–1, net increase/decrease in infection prevalence (P prev; Table 1c) and the infection related
percentage reduction in production of uninf cells (% reduction; Table 1d). For all four response variables, the model fits were good with R2adjbetween 0.936 and 0.981 (Table 1a–d). The observed
thermal reaction norms of genotype-specific host response variables were visualised in Figures 3A–D, which also show the changes in genotype performance ranking order changes across temperature. Model predictions were visualised for each of the response variables as a thermal reaction norm per genotype (Fig. 4A–D).
The highestP uninfoccurred at 21uC probably due to fast host population growth and complete loss of the parasite, while the lowestP uninfoccurred at 16uC due to high infection related losses (Figures 3A (observed data) and 4A (GAM predictions)). Conversely, the highestP infoccurred at 16uC and the lowest at 21uC (Figs. 3B and 4B). In general, infected host cells carried single infections, multiple infections per host cell only occurred when infection prevalence was extremely high and the availability of uninfected hosts became limiting. Hence, theP sporshowed also the highest production at 16uC and the lowest at 1uC and 21uC (data not shown). The formation of resting spores at 1uC resulted in a loss of prevalence (i.e. negativeP prev) over time at 1uC, while the loss of prevalence at 21uC was caused by the death of the parasite population (Figs. 3C and 4C). The positive P prev at intermediate temperatures (11 and 16uC) suggested that parasite production rates surpassed those of the host. This was also reflected in the% reductionpatterns (Figs. 3D and 4D). Impact of infection was highest at the intermediate temperatures (positive values in % reduction of uninfected cells) and lowest at the two temperature extremes. Negative values in% reductionindicated that the production of uninfected cells in the experimental units surpassed that in the controls.
To exclude that we confounded genotype effects with host cell bio-volume effects on host susceptibility and parasite productivity, we checked for the respective explanatory power of predictors a) host cell bio-volume and b) genotype using ANOVA models (see file S2 for methods and results). The model including genotype provided higher predictive power for host and parasite produc-tivity measures, therefore all results were interpreted in the light of genotype effects.
Discussion
General temperature effects
Species-level host and parasite rate of change per day showed a typical left skewed, unimodal relationship across temperatures with maximal performance temperatures near their upper tolerance limits [43]. The net loss of infection prevalence at both temperature extremes showed that the thermal activity range of the tested parasite genotype was narrower than that of its host. However the mechanism at work was different for either temperature extreme. At 1uC the parasite was still able to reproduce but formed mostly resting spores which remain inactive as long as the conditions are adverse for the parasite. Here, the loss of prevalence was caused by the host population growth rate exceeding the parasite population growth rate so that the proportion of infected cells was constantly diluted by new, uninfected cells (Fig. 3C). Hence, the disease was present, but showed such slow dynamics that it was contained at very low levels in the host population. At 21uC, the loss of prevalence was caused by the parasite dying within a few days which freed the host population from parasite pressure as reflected in the low% reduction of exposed but uninfected host cells at this temperature (see Figs. 3D and 4D). Also at 21uC, the production of uninfected host cells in some experimental units surpassed that of controls which Figure 1. Representation of the genetic diversity of the
experimental Asterionellaformosa genotypes. The dendrogram representation is based on Jaccard similarity among the Asterionella-formosa genotypes used for baiting the parasite (S122) and in the experiment (S24–S53), as well as oneFragilariacrotonensisgenotype as out-group. Bootstrap resampling of the data (n = 5000) showed support of most of the nodes, the distinction between S122 and S43 was not supported well.
may be a result of increased nutrient recycling from (few) infected, dying cells or an indication of unexpected high variance in host carrying capacity at that temperature.
The narrower thermal activity range of the tested parasite genotype allowed the host two thermal refugia of low or no disease pressure. We tested only one parasite genotype, and given that Figure 2. Thermal tolerance ranges of aggregated, species-level measures of host and parasite productivity across temperature environments. This plot shows overall thermal reaction norms of exposed, but uninfected (light grey) and exposed, infected (dark grey) host (expressed as a rate of change day–1inAsterionellacells) separately and combined (no colour), as well as the thermal reaction norm of the parasite (as rate of change day–1of chytrid sporangia, black bars) in experimental units. The thermal tolerance range of the tested parasite genotype is narrower than that of the host as the parasite population shows low or no growth at both temperature extremes while the host population is still productive. doi:10.1371/journal.pone.0071737.g002
Figure 3. Genotype specific thermal reaction norms. Observed net production of A) exposed, but uninfected host cells mL–1, B) exposed, infected host cells mL–1, C) net change in prevalence of infection, and D) % reduction of the production of uninfected cells mL–1in parasite exposed cultures, plotted as host genotype-specific thermal reaction norms. Note the changes in host genotype performance ranking order across temperatures. Such changes indicate the potential for genotype-by-temperature interactions.
parasite genetic diversity is likely also expressed in phenotypic diversity, the actual species-level reaction norm of the parasite may look slightly different. Nevertheless, the occurrence of the ‘‘cold’’ thermal refuge for the host has been described in earlier field studies [26] and in a laboratory study on a closely related parasite species, Rhizophydium planktonicum[36]. Similarly, thermal refugia have also been described in other species pairs such as Daphnia magna and its bacterial parasite Pasteuriaramosa where disease severity decreased drastically with temperature [11]. One of the most striking examples of thermal refugia is the induction of behavioural fever [44]. Amphibians are able to clear chytrid infections by seeking high temperature environments [45,46]. Desert locusts use behavioural fever to control fungal infections to survive long enough to produce offspring [46]. Phytoplankton species such as the diatom Asterionella have, of course, limited capacity to actively choose their temperature environment but show a similar respite from fungal infection during cold winters and at the height of summer when surface water temperatures favour the host but not the parasite. Such thermal refugia may seem short-lived and of little consequence, but nevertheless have measurable impact, for instance in the Asterionella population dynamics in Lake Maarsseveen. The occurrence and timing of the
‘‘cold’’ refugium determines the occurrence and size of the Asterionella spring-bloom and therefore sets the stage for the seasonal phytoplankton succession and food-web dynamics in the lake [12]. The ‘‘hot’’ refugium’’ may facilitate the occurrence of high density summer/autumn blooms ofAsterionella, as epidemics of the chytrid reach only low infection prevalence despite high host density due the parasite`s lower thermal maximum [47]. Such summer blooms, in turn, are a poor food source for cladocerans as Asterionellais basically not ingestible for these zooplankters [48].
Genotype and genotype-by-environment interactions
Our experiment also showed that host genotypes differed in their overall susceptibility to disease, indicating that they possess variation in disease resistance traits. Thermal variation in the environment, however, is likely to hinder any directional selection against susceptible genotypes as the susceptibility ranking order of the tested host genotypes varied significantly with temperature (Fig. 3A–D). Therefore, it is not possible to predict the strength and exact direction of parasite selective pressure on any given host genotype from one environment to another. The influence of the thermal environment on host genotype-specific susceptibility to disease has been shown in a number of invertebrate-parasite Figure 4. Visualisation of the GAM predictions for the measured response variables.The plots show production of A) exposed, but uninfected cells mL–1, B) sqrt transformed exposed, infected cells mL–1, C) of net change in prevalence of infection, and D) % reduction of the production of uninfected cells mL–1in parasite exposed cultures.
Table 1.Results of the GAM for parametric effects (temperature (T) and genotypes a-g (G) and smoothed interaction (genotype by temperature (f(GxT))) on net production of uninfected and infected host cells mL–1in parasite exposed cultures, on net change in
infection prevalence and on the net reduction of production of uninfected host cells mL–1.
a) P uninf = (T)+(G)+f(GxT)+e
Parametric coefficients: Estimate Std. Error t value Pr(.|t|)
(Intercept) –155909 4557 –34.217 ,2e-16
T 20177 389 51.852 ,2e-16
Ga 14067 3164 4.446 1.77e-05
Gb 21896 3164 6.920 1.48e-10
Gc 28388 3164 8.972 1.69e-15
Gd 30577 3164 9.664 ,2e-16
Ge 32340 3164 10.221 ,2e-16
Gf 16088 3164 5.084 1.16e-06
Approximate significance of smooth termsf(GxT): edf Ref.df F P
s(T):Ga 3.76 3.88 227.9 ,2e-16
s(T):Gb 3.82 3.89 212.9 ,2e-16
s(T):Gc 3.87 3.89 184.8 ,2e-16
s(T):Gd 3.87 3.89 185.4 ,2e-16
s(T):Ge 3.85 3.89 144.8 ,2e-16
s(T):Gf 3.82 3.89 155.1 ,2e-16
s(T):Gg 3.72 3.88 193.0 ,2e-16
GCV score = 3.0419e+08 n = 175 R2
adj = 0.94
b) P inf = (T)+(G)+f(GxT)+e
Parametric coefficients: Estimate Std. Error t value Pr(.|t|)
(Intercept) 411.2 7.10 57.922 ,2e-16
T –20.1 0.61 –33.084 ,2e-16
Gb –15.6 4.92 –3.170 0.002
Gc –18.0 4.92 –3.666 0.0003
Gd –16.3 4.92 –3.308 0.001
Ge –32.5 4.92 –6.609 7.50e-10
Gf –40.0 4.92 –8.129 2.06e-13
Gg –30.0 4.92 –6.105 9.55e-09
Approximate significance of smooth termsf(GxT): Edf Ref.df F P
s(T):Ga 3.86 3.89 458.7 ,2e-16
s(T):Gb 3.88 3.89 481.1 ,2e-16
s(T):Gc 3.89 3.89 522.0 ,2e-16
s(T):Gd 3.88 3.89 357.9 ,2e-16
s(T):Ge 3.88 3.89 467.6 ,2e-16
s(T):Gf 3.87 3.89 509.4 ,2e-16
s(T):Gg 3.87 3.89 484.1 ,2e-16
GCV score = 378 n = 175 R2
adj= 0.98
c) P prev = (T)+(G)+f(GxT)+e
Parametric coefficients: Estimate Std. Error t value Pr(.|t|)
Intercept –0.799 0.022 36.049 ,2e-16
T –0.052 0.002 –27.513 ,2e-16
Gb –0.078 0.015 –5.061 1.29e-06
Gc –0.107 0.015 –6.955 1.23e-10
Gd –0.075 0.015 –4.879 2.85e-06
Ge –0.130 0.015 –8.435 3.65e-14
systems [6,10,11,49] and in vascular plants [50]. Context dependency of the host genotype-specific response to infection (GxE interactions) may contribute to the observed high level of genetic diversity in naturalAsterionellapopulations [31] under the pre-condition that different host genotypes vary in their suscep-tibility to infection under different environments (as found in this study). However, temperature is only one (although an important one) of the regulating factors in a complex environment. Changes in light and oxygen saturation with watercolumn depth, seasonal nutrient and pH variation or the presence of competitors and predators may all add their own twist to host-parasite interactions.
Conclusions
Host and chytrid parasite thermal tolerance ranges do not necessarily overlap fully. If the thermal tolerance range of the parasite is narrower than that of its host, the host can benefit from thermal refugia of low or no disease pressure. This seems to be the case in chytrid-Asterionellasystem but also in the chytrid-amphibian systems. If changes in temperature patterns due to climate warming affect the duration and timing of such thermal refugia
for the host, this may have important and potentially unexpected consequences for parasite and host population dynamics. Warm-ing may stimulate the spread of disease by removWarm-ing cold temperature refugia; although the loss of such host refugia may also result in the paradoxical subsequent loss of host blooms and parasite epidemics (see for example [12]). Hence, the outcome of climate warming on the spread and severity of diseases is not always straightforward to predict. Furthermore, the mechanisms underlying the occurrence of host refugia may vary from reduced parasite population growth to parasite dormancy to extinction of the parasites. Which of these processes are in operation may have implications for disease re-occurrence or re-invasion from resting stages and for host pre-adaptation to disease. Selection on the Asterionella genotypes can then be driven by different factors (environment or parasite), which may have consequences in the potential for host-parasite co-evolution. In any thermal refugium, the host population is freed of parasite mediated selection but experiences abiotic selection pressures. If host genotypes show different performance ranking orders under abiotic stress than under parasite pressure, then selection in the thermal refugia may Table 1.Cont.
c) P prev = (T)+(G)+f(GxT)+e
Parametric coefficients: Estimate Std. Error t value Pr(.|t|)
Approximate significance of smooth termsf(GxT): edf Ref.df F P
s(T):Ga 3.86 3.89 319.5 ,2e-16
s(T):Gb 3.87 3.89 314.3 ,2e-16
s(T):Gc 3.89 3.89 299.7 ,2e-16
s(T):Gd 3.88 3.89 250.4 ,2e-16
s(T):Ge 3.87 3.89 234.2 ,2e-16
s(T):Gf 3.81 3.89 216.5 ,2e-16
s(T):Gg 3.77 3.88 304.7 ,2e-16
GCV score = 0.0037034 n = 175 R2
adj= 0.96
d) % reduction = (T)+(G)+f(GxT)+e
Parametric coefficients: Estimate Std. Error t value Pr(.|t|)
Intercept 106.56 2.55 41.733 ,2e-16
T –4.31 0.29 –19.777 ,2e-16
Gb –11.06 1.77 –6.240 4.86e-09
Gc –17.49 1.77 –9.867 ,2e-16
Gd –15.49 1.77 –8.739 6.45e-15
Ge –17.59 1.77 –9.925 ,2e-16
Gf –18.74 1.77 –10.575 ,2e-16
Gg –21.40 1.77 –12.075 ,2e-16
Approximate significance of smooth termsf(GxT): edf Ref.df F P
s(T):Ga 3.84 3.89 182.3 ,2e-16
s(T):Gb 3.85 3.89 263.3 ,2e-16
s(T):Gc 3.88 3.89 297.0 ,2e-16
s(T):Gd 3.88 3.89 227.0 ,2e-16
s(T):Ge 3.85 3.89 181.7 ,2e-16
s(T):Gf 3.86 3.89 173.4 ,2e-16
s(T):Gg 3.84 3.89 447.7 ,2e-16
GCV score = 49.002 n = 17 R2
adj= 0.97
also favour a different set of host genotypes, disrupt any directional selection for increased parasite resistance in the host population, and cause the host population to lose, to some extent, any pre-adaptation to the parasite. This would increase the infection success of the parasite when re-invading from resting stages. Such examples indicate that the mechanisms behind (temporary) disappearance of disease need to be taken into account in theoretical approaches as well as in the management of infectious diseases.
Supporting Information
File S1 Fingerprinting of Asterionellaformosa isolates.
Description of the AFLP fingerprinting and the statistical analysis methods used for the assessment of genetic diversity in the experimentalAsterionellaformosagenotypes.
(DOCX)
File S2 ANOVA models testing co-linearity between
predictors host genotype and host cell-size. To assess whether genotype or host cell-size is the more appropriate predictor for host and parasite productivity, two ANOVA models were compared including either temperature and host genotype
(model 1, tables S2.1 and S2.4) or temperature and host cell-size (model 2, tables S2.2 and S2.5). Response variables were net production of uninfected cells (see S2.1 and S2.2) and net production of infected cells in parasite exposed cultures (see S2.4 and S2.5).
(DOCX)
Acknowledgments
The authors would like to thank CorineSchoebel and Silke van den Wyngaert for helpful discussions during the preparation of this manuscript, and NicoHelmsing and Suzanne Naus-Wiezer for helping with the experimental set up. Additionally we would like to thank our editor and the anonymous reviewer for helpful and constructive comments. This is publication nr 5471 of the Netherlands Institute of Ecology (NIOO-KNAW).
Author Contributions
Conceived and designed the experiments: ASG LNdSD EvD BWI. Performed the experiments: ASG. Analyzed the data: ASG LNdSD. Contributed reagents/materials/analysis tools: LNdSD EvD BWI. Wrote the paper: ASG LNdSD.
References
1. Lafferty KD, Dobson AP, Kuris AM (2006) Parasites dominate food web links. ProcNatlAcadSci U S A 103: 11211–11216.
2. Lazzaro BP, Little TJ (2009) Immunity in a variable world. Philos Trans R SocLond B BiolSci 364: 15–26.
3. McNew G (1960) The nature, origin, and evolution of parasitism. In: Horsfall J, Dimond A, editors. Plant Pathology: an advanced treatise. New York: Academic Press. 19–69.
4. Wolinska J, King KC (2009) Environment can alter selection in host–parasite interactions. TrendsParasitol 25: 236–244.
5. Kiers E, Palmer TM, Ives AR, Bruno JF, Bronstein JL (2010) Mutualisms in a changing world: an evolutionary perspective. EcolLett13: 1459–1474. 6. Vale P, Stjernman M, Little T (2008) Temperature-dependent costs of
parasitism and maintenance of polymorphism under genotype-by-environment interactions. J EvolBiol21: 1418–1427.
7. Hedrick PW (1986) Genetic Polymorphism in Heterogeneous Environments: A Decade Later. AAnnu Rev EcolSyst17: 535–566.
8. Brown JH, Gillooly JF, Allen AP, Savage VM, West GB (2004) Toward a metabolic theory of ecology. Ecology 85: 1771–1789.
9. Kingsolver JG (2009) The Well-Temperatured Biologist. Am Nat174: 755–768. 10. Schoebel CN, Tellenbach C, Spaak P, Wolinska J (2011) Temperature effects on
parasite prevalence in a natural hybrid complex. BiolLett7: 108–111. 11. Mitchell SE, Rogers ES, Little TJ, Read AF (2005) Host-parasite and
genotype-by-environment interactions: temperature modifies potential for selection by a sterilizing pathogen. Evolution 59: 70–80.
12. Ibelings BW, Gsell AS, Mooij WM, van Donk E, van den Wyngaert S, et al. (2011) Chytrid infections and diatom spring blooms: paradoxical effects of climate warming on fungal epidemics in lakes. FreshwBiol56: 754–766. 13. Fisher MC, Henk DA, Briggs CJ, Brownstein JS, Madoff LC, et al. (2012)
Emerging fungal threats to animal, plant and ecosystem health. Nature 484: 186–194.
14. Anderson PK, Cunningham AA, Patel NG, Morales FJ, Epstein PR, et al. (2004) Emerging infectious diseases of plants: pathogen pollution, climate change and agrotechnology drivers. TrendsEcolEvol 19: 535–544.
15. Daszak P, Cunningham AA, Hyatt AD (2003) Infectious disease and amphibian population declines. Diversity and Distributions 9: 141–150.
16. Powell MJ (1993) Looking at mycology with a Janus face: a glimpse at Chytridiomycetes active in the environment. Mycologia 85: 1–20.
17. Sparrow Jr F (1960) Aquatic Phycomycetes. Ann Arbor: University of Michigan Press.
18. Skerratt LF, Berger L, Speare R, Cashins S, McDonald KR, et al. (2007) Spread of chytridiomycosis has caused the rapid global decline and extinction of frogs. Ecohealth 4: 125–134.
19. Sonstebo JH, Rohrlack T (2011) Possible Implications of Chytrid Parasitism for Population Subdivision in Freshwater Cyanobacteria of the GenusPlanktothrix. Appl Environ Microbiol77: 1344–1351.
20. Wurzbacher CM, Barlocher F, Grossart HP (2010) Fungi in lake ecosystems. Aquatic Microbial Ecology 59: 125–149.
21. Canter HM (1950) Fungal Parasites of the Phytoplankton. I Studies on British Chytrids, X. Ann Bot 14: 263–289.
22. Canter HM (1951) Fungal Parasites of the Phytoplankton. II Studies on British Chytrids, XII. Ann Bot 15: 129–156.
23. Lefe`vre E, Roussel B, Amblard C, Sime-Ngando T (2008) The molecular diversity of freshwater picoeukaryotes reveals high occurrence of putative parasitoids in the plankton. PLoS One 3: e2324.
24. Canter HM (1969) Studies on British chytrids. XXIX. A taxonomic revision of certain fungi found on the diatomAsterionella. Bot J Linn Soc62: 267–278. 25. Canter HM, Lund JWG (1948) Studies on plankton parasites: I. Fluctuations in
the numbers of Asterionella formosa Hass. in relation to fungal epidemics. NewPhytol47: 238–261.
26. Van Donk E, Ringelberg J (1983) The effect of fungal parasitism on the succession of diatoms in Lake Maarsseveen I (The Netherlands). Freshw Biol 13: 241–251.
27. Gsell AS, De Senerpont Domis LN, Verhoeven KJF, van Donk E, Ibelings BW (2013) Chytrid epidemics may increase genetic diversity of a diatom spring-bloom. ISME J advance online publication.
28. Maberly S, Hurley M, Butterwick C, Corry J, Heaney S, et al. (1994) The rise and fall ofAsterionella formosain the South Basin of Windermere: analysis of a 45-year series of data. Freshw Biol 31: 19–34.
29. Ibelings BW, De Bruin A, Kagami M, Rijkeboer M, Brehm M, et al. (2004) Host parasite interactions between freshwater phytoplankton and chytrid fungi (Chytridiomycota). J Phycol 40: 437–453.
30. Mann DG, Round F (1988) Why didn’t Lund see sex in Asterionella? A discussion of the diatom life cycle in nature. In Round FE (ed.) Algae and the Aquatic Environment.Bristol: Biopress.385–412.
31. De Bruin A, Ibelings BW, Rijkeboer M, Brehm M, van Donk E (2004) Genetic variation in Asterionella formosa (Bacillariophyceae): Is it linked to frequent epidemics of host-specific parasitic fungi? J Phycol40: 823–830.
32. Gsell AS, De Senerpont Domis LN, Przytulska-Bartosiewicz A, Mooij WM, van Donk E, et al. (2012) Genotype-by-temperature interactions may help to maintain clonal diversity inAsterionella formosa(Bacillariophyceae). J Phycol48: 1197–1208.
33. Canter HM, Lund J (1951) Studies on plankton parasites III. Examples of the interaction between parasitism and other factors determining the growth of diatoms. Ann Bot 15: 359–371.
34. Bruning K (1991) Infection of the diatomAsterionellaby a chytrid. I. Effects of light on reproduction and infectivity of the parasite. J Plankton Res13: 103–117. 35. Doggett MS, Porter D (1996) Sexual reproduction in the fungal parasite,
Zygorhizidium planktonicum. Mycologia 88: 720–732.
36. Bruning K (1991) Effects of temperature and light on the population dynamics of theAsterionella-Rhizophydiumassociation. J Plankton Res13: 707–719. 37. Stein JR (1980) Handbook of phycological methods: culture methods and
growth measurements. Cambridge: Cambridge University Press.
38. Brand LE, Guillard RR, Murphy LS (1981) A method for the rapid and precise determination of acclimated phytoplankton reproduction rates. J Plankton Res3: 193–201.
39. Utermo¨hl H (1931) Neue Wege in der quantitativen Erfassung des Planktons: (Mit besondere Beru¨cksichtigung des Ultraplanktons). Verh. Int. Ver. Theor. Angew. Limnol.5: 567–595.
40. Hastie T, Tibshirani R (1990) Generalized additive models. London: Chapman & Hall/CRC.
42. R Development Core Team (2011) R: A Language and Environment for Statistical Computing. Vienna, Austria: R Foundation for Statistical Computing. 43. Huey RB, Kingsolver JG (1989) Evolution of thermal sensitivity of ectotherm
performance. TrendsEcolEvol4: 131–135.
44. Cabanac AJ, Cabanac M (2004) No emotional fever in toads. J ThermBiol29: 669–673.
45. Woodhams DC, Alford RA, Marantelli G (2003) Emerging disease of amphibians cured by elevated body temperature. Dis Aquat Organ55: 65–67. 46. Retallick RW, Miera V (2007) Strain differences in the amphibian chytrid
Batrachochytrium dendrobatidis and non-permanent, sub-lethal effects of infection. Dis Aquat Organ75: 201–207.
47. Gsell AS, De Senerpont Domis LN, Naus-Wiezer SMH, Helmsing NR, Van Donk E, et al. (2013) Spatiotemporal variation in the distribution of chytrid parasites in diatom host populations. Freshw Biol 58: 523–537.
48. Kagami M, von Elert E, Ibelings BW, de Bruin A, Van Donk E (2007) The parasitic chytrid, Zygorhizidium, facilitates the growth of the cladoceran zooplankter, Daphnia, in cultures of the inedible alga, Asterionella. Proc R SocLond B BiolSci274: 1561–1566.
49. Thomas MB, Blanford S (2003) Thermal biology in insect-parasite interactions. TrendsEcolEvol18: 344–350.