Explained by Thermal Adaptation to Climate Change
Volker Salewski1, Karl-Heinz Siebenrock2, Wesley M. Hochachka3, Friederike Woog4, Wolfgang Fiedler2* 1Michael-Otto-Institut im NABU, Bergenhusen, Germany,2Max-Planck-Institute for Ornithology, Department of Migration and Immuno-ecology, Radolfzell, Germany, 3Lab of Ornithology, Cornell University, Ithaca, New York, United States of America,4Staatliches Museum fu¨r Naturkunde Stuttgart, Stuttgart, Germany
Abstract
Changes in morphology have been postulated as one of the responses of animals to global warming, with increasing ambient temperatures leading to decreasing body size. However, the results of previous studies are inconsistent. Problems related to the analyses of trends in body size may be related to the short-term nature of data sets, to the selection of surrogates for body size, to the appropriate models for data analyses, and to the interpretation as morphology may change in response to ecological drivers other than climate and irrespective of size. Using generalized additive models, we analysed trends in three morphological traits of 4529 specimens of eleven bird species collected between 1889 and 2010 in southern Germany and adjacent areas. Changes and trends in morphology over time were not consistent when all species and traits were considered. Six of the eleven species displayed a significant association of tarsus length with time but the direction of the association varied. Wing length decreased in the majority of species but there were few significant trends in wing pointedness. Few of the traits were significantly associated with mean ambient temperatures. We argue that although there are significant changes in morphology over time there is no consistent trend for decreasing body size and therefore no support for the hypothesis of decreasing body size because of climate change. Non-consistent trends of change in surrogates for size within species indicate that fluctuations are influenced by factors other than temperature, and that not all surrogates may represent size appropriately. Future analyses should carefully select measures of body size and consider alternative hypotheses for change.
Citation:Salewski V, Siebenrock K-H, Hochachka WM, Woog F, Fiedler W (2014) Morphological Change to Birds over 120 Years Is Not Explained by Thermal Adaptation to Climate Change. PLoS ONE 9(7): e101927. doi:10.1371/journal.pone.0101927
Editor:Hans-Ulrich Peter, Institute of Ecology, Germany
ReceivedOctober 1, 2013;AcceptedJune 13, 2014;PublishedJuly 14, 2014
Copyright:ß2014 Salewski et al. This is an open-access article distributed under the terms of the Creative Commons Attribution License, which permits unrestricted use, distribution, and reproduction in any medium, provided the original author and source are credited.
Funding:These authors have no support or funding to report.
Competing Interests:The authors have declared that no competing interests exist.
* Email: [email protected]
Introduction
Changes in morphology, and in particular a decline in body size, are expected to be one of many responses of animals to current rapid global warming [1,2]. Fluctuations in the body size of mammals during the Holocene, sometimes with shifts of up to 25% within a century, are correlated with climatic change [3–5]. Animals introduced to new environments changed morphology and size within a few decades [6–8], and morphology can change rapidly when driven by selection [9,10]. Previous authors [2,11,12] have suggested that changes in body size follow Bergmann’s prediction [13] that endotherms should be smaller in warmer climates because of thermoregulatory needs. However, Bergmann [13] himself discussed species-specific factors (e.g. body insulation, habitat use, behaviour, nutrition) that may mask the predicted size trend (see also [14,15]). Therefore, the assumption of unidirec-tional changes in morphology as a response to a single environmental factor (temperature) across a wide range of species with different ecologies may be questioned, and a review of recent studies examining trends in body size produced conflicting results [16]. Birds and mammals have shown trends consistent with [12,17,18], and contrary to [19,20], the prediction of decreasing body size with warmer temperatures and lower latitudes, or no clear trend [21–23]. Some studies of multiple species experiencing the same climate regime have found opposing directions of change among them [11,16,23,24].
There are several potential caveats to the analyses and interpretation of body size trends in animals [25]. First, selecting an appropriate measure to represent body size may be problem-atic. Examples are the use of the size of teeth in studies of quaternary mammals or the use of body mass in studies of body size of birds [24,26]. Ecological factors such as habitat structure, food availability or competition within a community may influence the size of organs such as teeth, bills or limbs independently of body size [24,27–29].
though forcing linear regressions through non-linear trends is problematic.
The third caveat is that the time span of the data set needs to be long enough to distinguish between long-term trends and microevolutionary adaptive change such as may be caused by year-to-year variation of local weather [33–35]. Even under the scenario of recent climate change, local fluctuations in weather conditions may trigger phenotypic responses and thus better explain morphological change in short-term data sets [35]. However, analyses of body-size trends using data going back for more than 50 years are scarce [11,12].
Here, we present an analysis of morphological change based on museum specimens of eleven bird species collected in southern
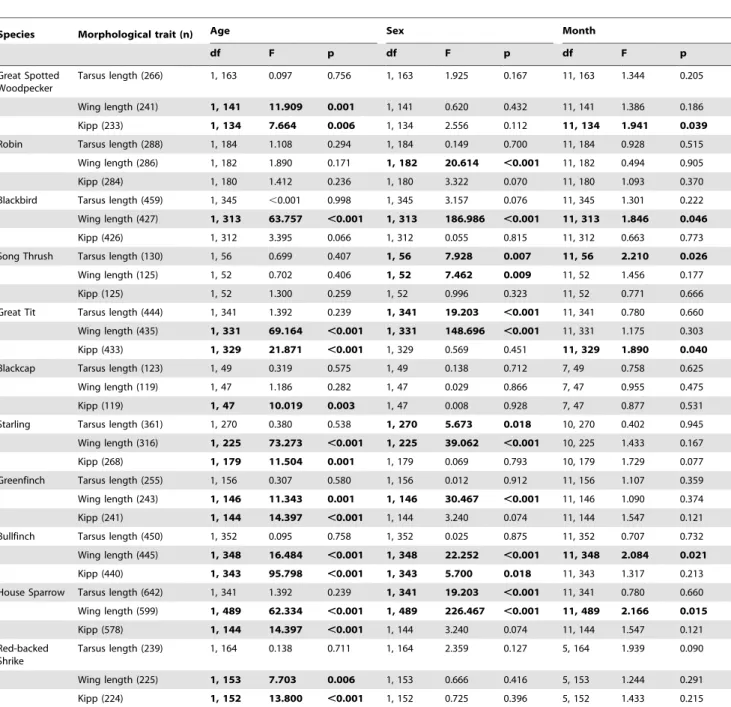
Table 1.Associations of morphological traits with the age, sex and month of collection of specimens in 11 bird species.
Species Morphological trait (n) Age Sex Month
df F p df F p df F p
Great Spotted Woodpecker
Tarsus length (266) 1, 163 0.097 0.756 1, 163 1.925 0.167 11, 163 1.344 0.205
Wing length (241) 1, 141 11.909 0.001 1, 141 0.620 0.432 11, 141 1.386 0.186
Kipp (233) 1, 134 7.664 0.006 1, 134 2.556 0.112 11, 134 1.941 0.039
Robin Tarsus length (288) 1, 184 1.108 0.294 1, 184 0.149 0.700 11, 184 0.928 0.515
Wing length (286) 1, 182 1.890 0.171 1, 182 20.614 ,0.001 11, 182 0.494 0.905
Kipp (284) 1, 180 1.412 0.236 1, 180 3.322 0.070 11, 180 1.093 0.370
Blackbird Tarsus length (459) 1, 345 ,0.001 0.998 1, 345 3.157 0.076 11, 345 1.301 0.222
Wing length (427) 1, 313 63.757 ,0.001 1, 313 186.986 ,0.001 11, 313 1.846 0.046
Kipp (426) 1, 312 3.395 0.066 1, 312 0.055 0.815 11, 312 0.663 0.773
Song Thrush Tarsus length (130) 1, 56 0.699 0.407 1, 56 7.928 0.007 11, 56 2.210 0.026
Wing length (125) 1, 52 0.702 0.406 1, 52 7.462 0.009 11, 52 1.456 0.177
Kipp (125) 1, 52 1.300 0.259 1, 52 0.996 0.323 11, 52 0.771 0.666
Great Tit Tarsus length (444) 1, 341 1.392 0.239 1, 341 19.203 ,0.001 11, 341 0.780 0.660
Wing length (435) 1, 331 69.164 ,0.001 1, 331 148.696 ,0.001 11, 331 1.175 0.303
Kipp (433) 1, 329 21.871 ,0.001 1, 329 0.569 0.451 11, 329 1.890 0.040
Blackcap Tarsus length (123) 1, 49 0.319 0.575 1, 49 0.138 0.712 7, 49 0.758 0.625
Wing length (119) 1, 47 1.186 0.282 1, 47 0.029 0.866 7, 47 0.955 0.475
Kipp (119) 1, 47 10.019 0.003 1, 47 0.008 0.928 7, 47 0.877 0.531
Starling Tarsus length (361) 1, 270 0.380 0.538 1, 270 5.673 0.018 10, 270 0.402 0.945
Wing length (316) 1, 225 73.273 ,0.001 1, 225 39.062 ,0.001 10, 225 1.433 0.167
Kipp (268) 1, 179 11.504 0.001 1, 179 0.069 0.793 10, 179 1.729 0.077
Greenfinch Tarsus length (255) 1, 156 0.307 0.580 1, 156 0.012 0.912 11, 156 1.107 0.359
Wing length (243) 1, 146 11.343 0.001 1, 146 30.467 ,0.001 11, 146 1.090 0.374
Kipp (241) 1, 144 14.397 ,0.001 1, 144 3.240 0.074 11, 144 1.547 0.121
Bullfinch Tarsus length (450) 1, 352 0.095 0.758 1, 352 0.025 0.875 11, 352 0.707 0.732
Wing length (445) 1, 348 16.484 ,0.001 1, 348 22.252 ,0.001 11, 348 2.084 0.021
Kipp (440) 1, 343 95.798 ,0.001 1, 343 5.700 0.018 11, 343 1.317 0.213
House Sparrow Tarsus length (642) 1, 341 1.392 0.239 1, 341 19.203 ,0.001 11, 341 0.780 0.660
Wing length (599) 1, 489 62.334 ,0.001 1, 489 226.467 ,0.001 11, 489 2.166 0.015
Kipp (578) 1, 144 14.397 ,0.001 1, 144 3.240 0.074 11, 144 1.547 0.121
Red-backed Shrike
Tarsus length (239) 1, 164 0.138 0.711 1, 164 2.359 0.127 5, 164 1.939 0.090
Wing length (225) 1, 153 7.703 0.006 1, 153 0.666 0.416 5, 153 1.244 0.291
Kipp (224) 1, 152 13.800 ,0.001 1, 152 0.725 0.396 5, 152 1.433 0.215
Shown are the degrees of freedom (df) as well as F and p values of ANOVA with the morphological trait as the dependent factor and age, sex and month of collection as explanatory variables. Bold: p,0.05.
doi:10.1371/journal.pone.0101927.t001
Figure 1. Mean annual temperature in southern Germany between 1881 and 2011.Solid line – regression spline fit from the GAM; dashed lines – 95% confidence intervals.
Germany and adjacent areas between 1889 and 2010. We examine variation over time in three aspects of morphology (tarsus length, wing length and the Kipp-index of wing pointedness), using additive models that allow for non-linear change. We additionally control for the potential effects of month of collection, sex and age of the individuals. Thus, our study was designed to address the caveats noted above. With respect to the assumption of generally decreasing body sizes in times of global warming [2], the goals of our study are: 1) to determine whether there has been significant long-term variation in morphology over time across all species; 2) to identify differences among species in morphological trends that may be associated with ecological drivers other than temperature; and 3) to identify associations between the observed trends in morphology and changes in climate in the study area.
Materials and Methods
Study area
The morphology of birds shows intraspecific latitudinal variation which is mostly correlated with migratory behaviour [36,37]. Therefore, we restricted our study to specimens that were collected in southern Germany and adjacent areas in Switzerland and Austria between about 47.0uN and 50.8uN and between about 6.9uE and 14.3uE. The great majority of the specimens used (75%) were collected in the German federal states of Baden-Wu¨rttem-berg and Bavaria between 47.27uand 50.57uN and between 7.5uE and 13.8uE.
Selection of study species
We selected a range of species that represent different migration strategies because non-migratory bird species follow Bergmann’s rule more strongly than migrants [38]. The migration categories Table 2.Association of three morphological variables for 11 bird species with the smooth term ‘‘year’’ in a GAM.
Species Morphological trait (n) df F p Adjusted R2
Great Spotted Woodpecker Tarsus length (311) 7.2, 302.8 4.327 ,0.001 0.097
Wing length (254) 6.7, 245.3 2.961 0.004 0.186
Kipp (245) 1,5, 230.5 0.472 0.607 0.146
Robin Tarsus length (376) 2.7, 372.3 2.170 0.082 0.019
Wing length (298) 1.0, 295.0 1.772 0.184 0.096
Kipp (371) 2.1, 367.9 1.531 0.210 0.008
Blackbird Tarsus length (513) 4.0, 508.0 1.070 0.376 0.005
Wing length (427) 1.7, 411.3 9.868 ,0.001 0.416
Kipp (468) 3.8, 463.2 2.718 0.022 0.024
Song Thrush Tarsus length (211) 3.4, 194.6 3.005 0.017 0.128
Wing length (197) 7.8, 187.2 2.842 0.004 0.197
Kipp (257) 3.9, 252.1 0.951 0.447 0.010
Great Tit Tarsus length (447) 6.2, 438.1 5.698 ,0.001 0.119
Wing length (438) 1.0, 434.0 4.663 0.031 0.356
Kipp (438) 1.3, 423.7 0.547 0.535 0.085
Blackcap Tarsus length (192) 1.0, 190.0 0.013 0.909 ,0.001
Wing length (186) 1.7, 183.3 4.886 0.007 0.051
Kipp (126) 2.8, 121.2 3.191 0.020 0.089
Starling Tarsus length (369) 7.9, 359.1 4.440 ,0.001 0.099
Wing length (321) 5.5, 312.5 1.632 0.130 0.407
Kipp (308) 1.5, 304.5 1.540 0.217 0.126
Greenfinch Tarsus length (510) 8.5, 500.5 2.916 0.002 0.034
Wing length (244) 1.0, 240.0 0.665 0.416 0.163
Kipp (242) 1.0, 239.0 0.039 0.844 0.124
Bullfinch Tarsus length (508) 2.8, 504.2 2.031 0.097 0.013
Wing length (445) 1.0, 430.0 4.656 0.032 0.091
Kipp (447) 1.0, 443.0 0.833 0.362 0.215
House Sparrow Tarsus length (662) 8.7, 651.3 12.940 ,0.001 0.145
Wing length (599) 7.4, 577.6 7.081 ,0.001 0.448
Kipp (594) 1.0, 591.0 1.092 0.297 ,0.001
Red-backed Shrike Tarsus length (264) 2.2, 260.8 2.464 0.068 0.025
Wing length (245) 1.0, 242.0 2.030 0.156 0.062
Kipp (244) 1.0, 241.0 8.366 0.004 0.107
Shown are the degrees of freedom (df), F and p values of the smooth term as well as the adjusted R2of the models. Bold: p
considered were: long-distance migrants from the study area to sub-Saharan Africa, short-distance or partial migrants in which either the entire or a proportion of the population migrates to the Mediterranean, and residents. Initially, we selected six species out of each migration category according to the catalogue of the Rosenstein Museum in Stuttgart, but after the visits to the first two and largest collections (Stuttgart, Munich), we discovered that we could not expect to get sufficient specimens for many species, especially for long-distance migrants. For this reason we restricted our analyses to eleven of our initial 18 target species. Of the eleven species, we measured 4529 specimens collected between 1889 and 2010 (Table S1). Some sample sizes for specific analyses may be
lower than the totals of measured specimens because it was not possible to measure all morphological variables in all specimens, and specimens were excluded when they did not meet our criteria for certain analyses (see below).
Measurements
Measurements were taken in collections which are listed in the Acknowledgements.
It has been debated which measurements represent the size of birds most adequately [26,30,39,40]. Several studies proposed tarsus length as the preferred single proxy for body size [39–41].
Figure 2. Fluctuations in tarsus length of eleven bird species in southern Germany between 1889 and 2010.Solid line – regression spline fit from the GAM; dashed lines – 95% confidence intervals. See methods for details. A p-value of.0.05 is indicated with (ns) after the species name, see table 2 for exact p-values.
doi:10.1371/journal.pone.0101927.g002
Table 3.Association of three morphological variables for 11 bird species with the smooth term ‘‘temperature’’ in a GAM.
Species Morphological trait (n) df F p Adjusted R2
Great Spotted Woodpecker Tarsus length (311) 1.3, 308.7 2.088 0.138 0.010
Wing length (254) 2.8, 249.2 1.757 0.147 0.134
Kipp (245) 1.0, 231.0 2.559 0.111 0.152
Robin Tarsus length (376) 1.2, 373.8 0.047 0.889 ,0.001
Wing length (298) 1.7, 294.3 0.833 0.442 0.097
Kipp (371) 1.3, 368.7 6.380 0.004 0.028
Blackbird Tarsus length (513) 6.4, 505.6 1.171 0.316 0.011
Wing length (427) 1.9, 411.1 3.641 0.020 0.399
Kipp (468) 5.1, 461.9 2.926 0.007 0.033
Song Thrush Tarsus length (211) 6.5, 191.5 2.991 0.004 0.162
Wing length (197) 1.1, 193.9 0.017 0.934 0.113
Kipp (257) 1.7, 254.3 1.642 0.194 0.010
Great Tit Tarsus length (447) 2.5, 442.5 3.742 0.010 0.067
Wing length (438) 1.2, 433.8 0.475 0.556 0.351
Kipp (438) 7.0, 418.0 2.332 0.018 0.114
Blackcap Tarsus length (192) 1.0, 190.0 0.253 0.615 ,0.001
Wing length (186) 1.0, 184.0 1.892 0.171 0.005
Kipp (126) 2.1, 122.0 1.912 0.140 0.044
Starling Tarsus length (369) 4.9, 362.1 1.508 0.176 0.036
Wing length (321) 3.8, 315.2 1.691 0.140 0.117
Kipp (308) 1.0, 305.0 0.128 0.720 0.119
Greenfinch Tarsus length (510) 1.0, 508.0 0.755 0.385 ,0.001
Wing length (244) 1.0, 240.0 0.020 0.888 0.161
Kipp (242) 1.0, 239.0 1.237 0.267 0.128
Bullfinch Tarsus length (508) 8.0, 499.0 1.469 0.159 0.017
Wing length (445) 4.5, 426.5 2.578 0.022 0.110
Kipp (447) 1.0, 443.0 0.003 0.954 0.213
House Sparrow Tarsus length (662) 7.8, 652.2 6.170 ,0.001 0.069
Wing length (599) 1.1, 583.9 0.443 0.525 0.397
Kipp (594) 1.0, 591.0 0.025 0.874 ,0.001
Red-backed Shrike Tarsus length (264) 1.0, 262.0 0.957 0.329 ,0.001
Wing length (245) 1.0, 242.0 0.001 0.972 0.054
Kipp (244) 7.3, 234.7 2.208 0.026 0.133
Shown are the degrees of freedom (df), F and p values of the smooth term as well as the adjusted R2of the models. Bold: p
Gosler et al. [30] described wing length as the best single linear proxy of body size (but see [39,41,42]). However, wing length is also related to migration and habitat use [43,44]. Wing pointedness is related to the efficiency of long-distance flight, with migrants having more pointed wings [36,37,45,46].We considered tarsus length, wing length and the Kipp-index of wing pointedness in parallel to appraise whether trends were consistent across all traits and whether alternative explanations suggest some of these traits might not be good surrogates for body size. With respect to the expectation of decreasing body size [2] and reduced migratory activity [47] as a response to the current global warming, the three measurements are expected to decrease during the study period and especially during the last four decades.
Wing length was measured from the wrist to the tip with a butted ruler (Wmax [48]), and the primary projection with a piece of laminated millimetre-gridded paper with a precision of 0.5 mm. The tarsus was measured by taking the distance between the back of the intertarsal joint and the lower front edge of the last undivided scale before the toes diverge (Tar 2 in [48]). The length was marked using the tip of dividers (pair of compasses) and the length read from them on millimetre-gridded paper under a
magnifying lamp with a precision of 0.1 mm. The Kipp-index [49], hereafter ‘‘Kipp’’, is calculated as the percentage of the primary projection (distance from the tip of the first secondary feather to the tip of the longest primary feather) of the wing length (Kipp = primary projection/wing length*100).
All measurements were taken by K.-H. Siebenrock, thereby avoiding inter-measurer variation [30,50]. We analysed within-observer consistency by blindly repeating the measurements of 98 blackbirds Turdus merula (97 for tarsus) in 2012 that were first measured in 2007. The mean of the repeated values differed by, 0.01 mm for tarsus length, 0.02 mm for wing length and 0.04 mm for the primary projection. Analysing the data according to Lessells & Boag [51], repeatabilities were 50%, 97% and 84% for tarsus length, wing length and primary projection respectively. The repeatability for tarsus length was surprisingly low in contrast to other studies [52–54], which is probably due to the sometimes problematic assignment of a reference point for measurements of museum specimens [55]. Nevertheless, these inconsistencies in tarsus measurements did not vary with year of collection of specimens (hereafter: year); a linear model with the differences between two measurements as dependent and year as the
Figure 3. Fluctuations in wing length of eleven bird species in association with the five-year mean annual temperature.Solid line – regression spline fit from the GAM; dashed lines – 95% confidence intervals. See methods for details. A p-value of.0.05 is indicated with (ns) after the species name, see table 3 for exact p-values.
independent variable revealed an equal distribution of differences over time (Figure S1). Therefore, we consider that any trends over time in our data are not influenced by low repeatability although confidence intervals around estimates of temporal trends may be higher for tarsus length.
Data analyses
Generalized Additive Models. We used generalized addi-tive models (GAMs), implemented in the package mgcv of the programme R 2.11.1 [56], to associate morphological variables with year and temperature. GAMs allow for arbitrary variation in the target variables through time [57,58] that potentially describe fluctuations of morphological characters better than linear models, while still approximating linear trends if these are biologically real. In order to avoid possible errors in interpretation due to biased availability of specimens by age or sex cohorts, or due to the presence of individuals that only migrated to or through the study area, we performed a two-step analysis for every species and morphological trait. In the first step, we considered only specimens with known sex and age (before the first primary moult or afterwards) according to Svensson [55], Jenni & Winkler [59] or
the label on the specimen, as well as specimens with known month of collection. We then used ANOVA to test for potential associations of sex, age or month of collection with tarsus length, wing length or Kipp. In the second step, we fitted GAMs to the data with either year or temperature as a smoothing term and the variables that were significant in the first step as fixed factors. Specimens for which information was not available for inclusion at the first step were included at the second step if the relevant variable was not significant at the first, thus considerably increasing our sample sizes for the GAMs.
Climate data. Mean annual temperatures between 1881 and 2011 for the German states of La¨nder Baden-Wuerttemberg and Bavaria were obtained from the Deutscher Wetterdienst (www. dwd.de). A GAM revealed that the smooth term year was significantly associated with temperature in the study area (F3.72,
126.28= 13.58, p,0.001, adjusted R 2
= 0.323). During the study period, there was a general non-linear trend for increasing temperatures (Figure 1). Between 1881 and about 1940, atures generally increased. From then until about 1970, temper-atures decreasing slightly, followed by a steep increase in
Figure 4. Fluctuations in tarsus length of eleven bird species in association with the five-year mean annual temperature.Solid line – regression spline fit from the GAM; dashed lines – 95% confidence intervals. See methods for details. A p-value of.0.05 is indicated with (ns) after the species name, see table 3 for exact p-values.
temperatures to the present day that is consistent with recent global warming [32].
Conditions during certain seasons may have a greater influence on survival compared to other seasons [60]. Therefore, morpho-logical adaptations to conditions during a crucial period within the annual cycle may not be detected when using temperature means over the entire annual cycle. However, linear regressions revealed that mean temperatures during seasons were significantly corre-lated with the temperature of the respective years: spring (March-May; n = 132, F1,128= 130.4, adjusted R2= 0.50, p =,0.001),
summer (June-August; n = 132,F1,128= 49.62, adjusted R2= 0.27,
p =,0.001), autumn (September-November; n = 132, F1,128=
27.15, adjusted R2= 0.17, p =,0.001) and winter (December-February; n = 132,F1,128= 59.93, adjusted R2= 0.31, p =,0.001).
Therefore, seasonal trends in temperature were not considered further.
Temperature in the year of collection may not be the most biologically-appropriate year to correlate with morphological characters. Many specimens have been collected early in the year and feathers grew in the previous year. Tarsi are fully grown when birds fledge [61] and thus temperature in subsequent years has no direct influence on the tarsus length of older individuals. Further, phenotypic expression of morphological characters may be more influenced by selective pressures acting in previous years. Therefore, we examined correlations between morphology and running means of temperature for the year of collection and the four preceding years. All species considered in this study have a generation length of less than 3.5 years [62]. Therefore, our approach includes temperatures experienced when the respective Table 4.Comparisons of models with alternate smooth terms (temperature – year) for each species and morphological trait.
Species Morphological trait Ddf DDeviance p
Great Spotted Woodpecker Tarsus length 26.0 252.3 ,0.001
Wing length 23.9 2204.2 ,0.001
Kipp 20.5 2.8
-Robin Tarsus length 21.6 29.3 0.004
Wing length 0.7 3.3 0.204
Kipp 20.8 ,0.1
-Blackbird Tarsus length 2.4 10.7 0.101
Wing length 0.2 296.4
-Kipp 1.3 9.4 0.030
Song Thrush Tarsus length 3.1 19.1 0.013
Wing length 26.6 2172.7 ,0.001
Kipp 22.2 23.5 0.373
Great Tit Tarsus length 23.7 222.0 ,0.001
Wing length 0.2 212.4
-Kipp 5.7 31.7 0.003
Blackcap Tarsus length 20.0 0.3
-Wing length 20.7 235.4 0.001
Kipp 20.8 214.0 0.006
Starling Tarsus length 23.0 223.8 ,0.001
Wing length 22.7 21496.7 ,0.001
Kipp 20.5 25.8 0.036
Greenfinch Tarsus length 27.5 214.5 0.001
Wing length 0.0 23.0
-Kipp 20.0 3.2
-Bullfinch Tarsus length 5.1 3.6 0.221
Wing length 3.5 96.2 0.009
Kipp 20.0 21.4 ,0.001
House Sparrow Tarsus length 20.9 238.0 ,0.001
Wing length 26.3 2244.2 ,0.001
Kipp 0.0 22.1
-Red-backed Shrike Tarsus length 21.2 26.5 0.007
Wing length 0.0 29.3
-Kipp 6.3 21.4 0.042
Ddf andDDeviances describe the differences between paired models (GAMs), with negative values indicating that the model including ‘‘year’’ as a smooth term explains more variance than the model including ‘‘temperature’’ as the smooth term. P-values were calculated from F-tests, whose degrees of freedom wereDdf. For contrasts in which the degrees of freedom differed by less than 1, no statistical comparisons were possible.
traits developed as well as temperatures causing potential selective pressures on one or two previous generations of most individuals considered in this study. Hence, temperatures that may cause phenotypic responses as well as microevolutionary adaptations are included.
To test whether temperature explained fluctuations in mor-phology better than a time trend alone, we fitted similar GAMs to the same data as described above, but with temperature instead of year as the smooth term. We compared pairs of GAMs (temperature, year) for each morphological trait and species with a likelihood ratio test. The accepted significance level was p#0.05.
Results
The first step of our analyses revealed that month of collection was significantly associated with variation in measurements in six cases (tarsus length – 1 species, wing length – 3 species, Kipp – 2 species; Table 1). Sex was significantly associated with the morphological traits in 13 (tarsus length – 4 species, wing length – 8 species, Kipp – 1 species; Table 1) and age in 16 cases (wing length – 8 species, Kipp – 8 species; Table 1) respectively.
The second step of our analyses revealed that tarsus length varied significantly with the smooth term year in six species (Table 2). Of these, tarsus length in the song thrush Turdus philomelosincreased with an especially pronounced trend during the last two decades (Figure 2d). In the great-spotted woodpecker (Figure 2a) and the great titParus major (Figure 2e), the overall trend for tarsus length was decreasing, whereas three species (starling Sturnus vulgaris, greenfinch Chloris chloris, house sparrow Passer domesticus, Figure 2g,h,j) showed fluctuating tarsus lengths without a clear trend throughout the study period. The similarity of trends from ca. 1940 to 2010 in these last three species, and especially the pronounced increasing trend during the last decades of the study period (Figure 2g,h,j), is remarkable and was also apparent in the song thrush. In only three species was tarsus length significantly associated with the five-year mean of temperature (Table 3), but there was no clear general trend in tarsus length in association with temperature in these three species. However, in the great tit and house sparrow, tarsus length decreased distinctly when mean temperatures were relatively high (Figure 3e,j), though in the song thrush the opposite was the case (Figure 4d). In the song thrush, the GAM including temperature as a smooth term
Figure 5. Fluctuations in wing length of eleven bird species in southern Germany between 1889 and 2010.Solid line – regression spline fit from the GAM; dashed lines – 95% confidence intervals. See methods for details. A p-value of.0.05 is indicated with (ns) after the species name, see table 2 for exact p-values.
explained significantly more variation in tarsus length than the GAM including year as the smooth term. In the great tit and the house sparrow, the opposite was the case (Table 4).
The smooth term year was a significant predictor of wing length in seven species (Table 2). Amongst these species, there was no particular trend over the entire study period in the great-spotted woodpecker and the song thrush, both showing a distinct increase in wing length during the most recent decades (Figure 5a,d). Five species (blackbird, great tit, blackcap Sylvia atricapilla, bullfinch Pyrrhula pyrrhula, house sparrow; Figure 5c,e,f,i,j) showed a significant overall decrease in wing length. The starling also showed a distinct decrease in wing length since the 1970s (Figure 5g), but the overall association of wing length with year was not significant (Table 2). The linearly decreasing wing lengths of the robin Erithacus rubecula, the greenfinch and the red-backed shrike were also not significant (Figure 5b,h,k). In only two species was wing length significantly associated with the five-year mean of temperature (Table 3). Wing length decreased with higher temperatures in the blackbird (Figure 3c) but there was no distinct
trend of wing length with temperature in the bullfinch (Figure 3i). In the blackbird, the GAM including year as a smooth term explained more variation of the data compared to the GAM including temperature as the smooth term. In the bullfinch, the opposite was the case (Table 4).
Variation in Kipp was significantly associated with the smooth term year in only three species (Table 2). Kipp declined in the blackbird from the 1920s to the 1960s, after which it was constant (Figure 6c). In the blackcap, it showed a constant decrease until about 1980, after which it increased again (Figure 6f). In the red-backed shrike, Kipp increased linearly throughout the study period (Figure 6k). In four species, Kipp was significantly associated with the five-year mean of temperatures (Table 3), but there was no particular trend in any of these species (Figure 7). In the blackbird, the great tit and the red-backed shrike, the GAM including temperature as a smooth term explained significantly more variation of the data than the GAM including year as the smooth term. In the robin, both models explained a similar amount of variation of the data (Table 4).
Figure 6. Fluctuations in wing pointedness (Kipp) of eleven bird species in southern Germany between 1889 and 2010.Solid line – regression spline fit from the GAM; dashed lines – 95% confidence intervals. See methods for details. A p-value of.0.05 is indicated with (ns) after the species name, see table 2 for exact p-values.
Discussion
Our study found no support for the hypothesis of a general decrease in surrogates for body size in times of global warming, and no two species displayed similar changes in morphology over time when all three morphological traits were considered together. In the majority of species, there was no consistent variation in tarsus length across the study period (Figure 2), but starling, greenfinch and house sparrow showed remarkable parallel fluctuations. Wing length varied significantly and mostly decreased for seven out of eleven species (Figure 5). There was a non-significant linear decrease in two additional species, and in one species the non-significant fluctuations included a distinct decrease in wing length during the last decades (Figure 5). Kipp showed in general no significant fluctuations throughout the study period (Figure 6). Hardly any of the morphological traits was significantly associated with temperature. When they were, models including year as the smooth term often explained significantly more variation in the data. Overall, our results indicate that: (1) independent patterns of long-term variation in multiple morpho-logical traits have occurred within individual species; and (2) species-specific patterns of long-term variation for each trait have been the rule rather than the exception.
The lack of support for the general hypothesis that birds have become smaller during periods of global warming is in contrast to other studies that claimed a recent general decrease in body size of birds [12,17,63,64] (but see [20,22]). Many of these studies used wing length as a surrogate for body size which may not be an appropriate predictor of overall body size [39–41]. In our study, wing lengths also declined in a number of species throughout the study period, but not in correlation with temperature. Wing length is also related to migratory activity with shorter wings indicating shorter migration distances [36,37]. The mean migration distance of many bird populations, as well as the proportion of migratory individuals within populations, have decreased in recent decades presumably due to climate change [47,65]. This may have released populations from the selective pressure to optimise wing shape for migration. Thus, a reduction in wing length may reflect decreasing migratory activity as a response to climate change, rather than decreasing body size. However, a decrease in migration distances or the proportion of migratory individuals should also lead to a reduction in wing pointedness [36,37,46]. We found evidence of reduced wing pointedness only in the blackbird, a species for which a reduction in migratory activity has been shown [66], and only during a limited period. Thus, the hypothesis that decreasing wing length is a response to the reduction of migratory activity remains to be validated and the observed changes may have been caused by other ecological factors such as change in habitat availability [67]. However, decreasing wing length is unlikely to indicate a reduction in body size as a response to increased temperature.
Choice of morphological characters determines patterns of change over time [68]. Tarsus length has been considered to be a more appropriate surrogate for size than wing length [39–41]. In our study, tarsus length did not show any consistent trend among species. Where there were significant fluctuations in tarsus length over time or with temperature, they did not necessarily support the a priori hypothesis of a decreasing trend. Indeed, four species (Figure 2d,g,h,j) showed a pronounced increasing trend during the
recent decades of accelerated global warming. Nestlings of birds grow larger tarsi when reared under more favourable conditions [61,69]. Therefore, better foraging conditions related to higher temperatures may result in larger tarsi, yielding the opposite trend to the predicted adaptive change to varying thermoregulatory needs (see also [20]).
Treating wing and tarsus length as surrogates for body size leads to some contradictory results (e.g. trends during the last decades for great-spotted woodpecker, Figure 2a, 5a; starling, Fig. 2g, 5g; house sparrow, Figure 2j, 5j). Similar contradictions have also been found in previous studies [70], further indicating pitfalls when interpreting trends in single measurements. The conclusion that body size in birds has declined in response to climate change may have been biased in some studies by the use of wing length as the only measure for size.
The low support for models that included temperature as the smoothing term also suggests that climate change has not been a universally important driver of morphological change. Using long term data sets of museum specimens, change in bill length in the Hawaiian i’iwi Vestiaria coccinea was associated with altered food sources [27]. An increase in wing pointedness in North American forest passerines was linked to habitat fragmentation [67]. House sparrows in urbanised habitats have shorter tarsi than those living in rural areas [71]. Changes in prey availability have been suggested as the cause of variation in size of the European goshawk Accipiter gentilis[28,72]. Therefore there are many hints that various factors influence morphology irrespective of climate change or only indirectly related to it.
In conclusion, we found almost no morphological variation that was directly correlated with change in five-year means of temperatures. The general warming that has occurred in southern Germany since the 1880s was not paralleled by the expected change in surrogates for birds’ body size. We argue that use of long-term datasets and non-linear models of change over time, along with consideration of multiple surrogates, may prompt similar conclusions in other regions or globally. Furthermore, drivers of adaptation other than ambient temperature [73,74] should be considered when trying to understand fluctuations in morphology.
Supporting Information
Figure S1 Result of the repeated measurement of 95
tarsus lengths of blackbirds. Shown are the differences
between the two measurements of a single bird (dots) and the result of a linear regression of the differences between the two measurements (d Measurement) on the year of collection of the respective individuals (F1, 93,0.001, p = 0.988, adjusted R
2 , 0.001). The regression line is shown and it is virtually identical with a line with the function y = 0 which would also be the result of such a regression when there would be no differences between the repeated measurements at all. Therefore our measurements can be used to analyse size trends despite a relatively low repeatability between measurements.
(DOC)
Table S1 Numbers of specimens considered per year and species.
(DOC)
Figure 7. Fluctuations in wing pointedness (Kipp) of eleven bird species in association with the five-year mean annual temperature.
Solid line – regression spline fit from the GAM; dashed lines – 95% confidence intervals. See methods for details. A p-value of.0.05 is indicated with (ns) after the species name, see table 3 for exact p-values.
Acknowledgments
We are grateful to the many people who let us visit their collections, sent us specimens, and otherwise assisted us in many ways. Without them the project would not have been possible. These were in alphabetic order of the city and names: Basel, Naturhistorisches Museum – R. Winkler; Berlin, Museum fu¨r Naturkunde – B. Brenneis, P. Eckhoff, S. Frahnert; Bremen, U¨ bersee-Museum – P.R. Becker; Bonn, Museum A. Ko¨nig – R. van den Elzen; Darmstadt, Technische Universita¨t – B. Koch; Frankfurt, Go¨the Universita¨t – R. Prinzinger, H. Traeu; Frankfurt, Senckenberg Museum – G. Mayr; Karlsruhe, Staatliches Museum fu¨r Naturkunde – T. Bu¨cher, H.-W. Mittmann; Mu¨nchen, Zoologische Staatssammlung – R. Diesener; Mu¨nster, LWL Museum fu¨r Naturkunde – J.-O. Kriegs; Stuttgart,
Staatliches Museum fu¨r Naturkunde – H. Ellrich, I. Heynen, S. Ka¨bmann, R. Kreschel, J. Panniger, K. Schwarz; Tu¨bingen, Eberhard Karls Universita¨t – J. Ro¨singer, E. Weber. B. Leisler gave useful advice about the design of this study. J. Korb helped with literature search. V. Kosarev kindly helped with the preparation of the figures.
Author Contributions
Conceived and designed the experiments: VS WF WMH FW KHS. Performed the experiments: KHS VS. Analyzed the data: VS WMH. Contributed reagents/materials/analysis tools: KHS FW. Wrote the paper: VS WMH WF FW KHS.
References
1. Millien V, Lyons SK, Olson L, Smith FA, Wilson AB, et al. (2006) Ecotypic variation in the context of global climate change: revisiting the rules. Ecology Letters 9: 853–869.
2. Sheridan JA, Bickford D (2011) Shrinking body size as an ecological response to climate change. Nature Climate Change 1: 401–406.
3. Smith FA, Betancourt JL, Brown JH (1995) Evolution of body size in the woodrat over the past 25,000 years of climate change. Science 270: 2012–2014. 4. Smith FA, Betancourt JL (2006) Predicting woodrat (Neotoma) responses to anthropogenic warming from studies of the palaeomidden record. Journal of Biogeography 33: 2061–2076.
5. Hill ME, Hill MG, Widga CC (2008) Late QuaternaryBisondiminution on the Great Plains of North America: evaluating the role of human hunting versus climate change. Quaternary Science Reviews 27: 1752–1771.
6. Johnston RF, Selander RK (1973) Evolution in the house sparrow. III. Variation in size and sexual dimorphism in Europe and North and South America. American Naturalist 107: 373–390.
7. Baker AJ (1980) Morphometric differentiation in New Zealand populations of the house sparrow (Passer domesticus). Evolution 34: 638–653.
8. Yom-Tov Y, Green W, Coleman J (1986) Morphological changes in the brush-tail possum in New Zealand. Journal of Zoology 208: 583–593.
9. Grant PR, Grant BR (2002) Unpredictable evolution in a 30-year study of Darwin’s finches. Science 296: 707–711.
10. Pergams ORW, Ashley MV (2001) Microevolution in island rodents. Genetica 112–113: 245–256.
11. Yom-Tov Y, Yom-Tov S, Wright J, Thorne CJR, Du Feu R (2006) Recent changes in body weight and wing length among some British passerine birds. Oikos 112: 91–101.
12. Gardner JL, Heinsohn R, Joseph L (2009) Shifting latitudinal clines in avian body size correlate with global warming in Australian passerines. Proceedings of the Royal Society B 276: 3845–3852.
13. Bergmann C (1847) Ueber die Verha¨ltnisse der Wa¨rmeo¨konomie der Thiere zu ihrer Gro¨sse. Go¨ttinger Studien Abthl. 1: 595–708.
14. Scholander PF (1955) Evolution of climatic adaptation in homeotherms. Evolution 9: 15–26.
15. McNab BK (2010) Geographic and temporal correlations of mammalian size reconsidered: a resource rule. Oecologia 164: 13–23.
16. Gardner JL, Peters A, Kearney MR, Joseph L, Heinsohn R (2011) Declining body size: a third universal response to warming? Trends in Ecology and Evolution 26: 285–291.
17. Van Buskirk J, Mulvihill RS, Leberman RC (2010) Declining body sizes in North American birds associated with climate change. Oikos 119: 1047–1055. 18. Rode KD, Amstrup SC, Regehr EV (2010) Reduced body size and cub recruitment in polar bears associated with sea ice decline. Ecological Applications 20: 768–782.
19. Yom-Tov Y, Yom-Tov J (2005) Global warming and Bergmann’s rule and body size in the masked shrewSorex cinereusKerr in Alaska. Journal of Animal Ecology 74: 803–808.
20. Goodman RE, Lebuhn G, Seavy NE, Gardali T, Bluso-Demers JD (2012) Avian body size changes and climate change: warming or increasing variability. Global Change Biology 18: 63–73.
21. Koontz TL, Shepherd UL, Marshall D (2001) The effect of climate change on Merriam’s kangaroo rat,Dipodomys merriami. Journal of Arid Environments 49: 581–591.
22. Guillemain M, Mondain-Monval J-Y, Johnson AR, Simon G (2005) Long-term climatic trend and body size variation in tealAnas crecca. Wildlife Biology 11: 81– 88.
23. Salewski V, Hochachka W, Fiedler W (2010) Global warming and Bergmann’s rule: do central European passerines adjust their body size to rising temperatures? Oecologia 162: 247–260.
24. Dayan T, Simberloff D, Tchernov E, Yom-Tov Y (1991) Calibrating the paleothermometer: climate, communities, and the evolution of size. Paleobiology 17: 189–199.
25. Yom-Tov Y, Geffen E (2011) Recent spatial and temporal changes in body size of terrestrial vertebrates: probable causes and pitfalls. Biological Reviews 86: 531–541.
26. Piersma T, Davidson NC (1991) Confusions of mass and size. Auk 108: 441– 443.
27. Smith TB, Freed LA, Lepson JK, Carothers JH (1995) Evolutionary consequences of extinctions in a population of a Hawaiian honeycreeper. Conservation Biology 9: 107–113.
28. Tornberg R, Mo¨nkko¨nen M, Pahkala M (1999) Changes in diet and morphology of Finnish goshawks from 1960s to 1990s. Oecologia 121: 369–376. 29. Vanhooydonck B, Herrel A, Gabela A, Podos J (2009) Wing shape variation in
the medium ground finch (Geospiza fortis): an ecomorphological approach. Biological Journal of the Linnean Society 98: 129–138.
30. Gosler AG, Greenwood JJD, Baker JK, Davidson NC (1998) The field determination of body size and condition in passerines: a report to the British Ringing Committee. Bird Study 45: 92–103.
31. Flinks H, Salewski V (2012) Quantifying the effect of feather abrasion on wing and tail lengths measurements. Journal of Ornithology 153: 1053–1065. 32. IPCC (2007) Climate change 2007: The scientific basis. In: Solomon S, Qin D,
Manning M, Chen Z, Marquis M, Averyt KB, Tignor M, Miller HL, editors. Contributions of Working Group I to the Fourth Assessment Report of the Intergovernmental Panel on Climate Change: ‘‘The Physical Science Basis’’. Cambridge: Cambridge University Press. pp. 1–18.
33. Merila¨ J, Gustafsson L (1996) Temporal stability and microgeographic homogeneity of heritability estimates in a natural bird population. Journal of Heredity 87: 199–204.
34. Teplitsky C, Mills JA, Alho JA, Yarrall JW, Merila¨ J (2008) Bergmann’s rule and climate change revisited: Disentangling environmental and genetic responses in a wild bird population. Proceedings of the National Academy of Sciences, USA 105: 13492–13496.
35. Husby A, Hille SM, Visser ME (2011) Testing mechanisms of Bergmann’s Rule: Phenotypic declines but no genetic change in body size in three passerines bird populations. American Naturalist 178: 202–213.
36. Fiedler W (2005) Ecomorphology of the external flight apparatus of blackcaps (Sylvia atricapilla) with different migration behaviour. Annals of the New York Academy of Sciences 1046: 253–263.
37. Fo¨rschler MI, Bairlein F (2011) Morphological shifts of the external flight apparatus across the range of a passerine (Northern Wheatear) with diverging migratory behaviour. PLOS ONE 6(4): e18732.
38. Meiri S, Dayan T (2003) On the validity of Bergmann’s rule. Journal of Biogeography 30: 331–351.
39. Rising JD, Somers KM (1989) The measurement of overall body size in birds. Auk 106: 666–674.
40. Freeman S, Jackson WM (1990) Univariate metrics are not adequate to measure avian body size. Auk 107: 69–74.
41. Senar JC, Pascual J (1997) Keel and tarsus length may provide a good predictor of avian body size. Ardea 85: 269–274.
42. Moser TJ, Rusch DH (1988) Indices of structural size and condition of Canada Geese. Journal of Wildlife Management 52: 202–208.
43. Leisler B, Winkler H (1985) Ecomorphology. Current Ornithology 2: 155–186. 44. Winkler H, Leisler B (2005) To be a migrant. Ecomorphological burdens and chances. In: Greenberg R, Marra PP, editors. Birds of two Worlds. Baltimore: Johns Hopkins University Press. pp. 79–86.
45. Kipp FA (1958) Zur Geschichte des Vogelzugs auf der Grundlage der Flu¨gelanpassungen. Vogelwarte 19: 233–242.
46. Baldwin MW, Winkler H, Organ CL, Helm B (2010) Wing pointedness associated with migratory distance in common garden and comparative studies of stonechats (Saxicola torquata). Journal of Evolutionary Biology 23: 1050–1063. 47. Visser ME, Perdeck AC, van Balen JH, Both C (2009) Climate change leads to decreasing bird migration distances. Global Change Biology 15: 1859–1865. 48. Eck S, Fiebig J, Fiedler W, Heynen I, Nicolai B, et al. (2011) Measuring Birds
-Vo¨gel vermessen. Wilhelmshaven: Deutsche Ornithologen-Gesellschaft. 49. Kipp FA (1959) Der Handflu¨gel-Index als flugbiologisches Mab. Vogelwarte 20:
77–86.
50. Salewski V, Fiedler W (2008) Verderben viele Ko¨che den Brei? Zur Anwendung von Linearen Gemischten Modellen bei der Analyse von Datensa¨tzen mit bearbeiterbedingter Varianz. Berichte der Vogelwarte Hiddensee 18: 63–73. 51. Lessells CM, Boag PT (1987) Unrepeatable repeatabilities: a common mistake.
52. van Noordwijk AJ, van Balen JH, Scharloo W (1988) Heritability of body size in natural populations of the Great Tit (Parus major) and its relation to age and environmental conditions during growth. Genetic Research 51: 149–162. 53. Lougheed SC, Arnold TW, Bailey RC (1991) Measurement error of external
and skeletal variables in birds and its effect on principal components. Auk 108: 432–436.
54. Perktas¸ U, Gosler AG (2010) Measurement error revisited: its importance for the analysis of size and shape of birds. Acta Ornithologica 45: 161–172. 55. Svensson L (1992) Identification Guide to European Passerines. Stockholm:
Svensson.
56. R Development Core Team (2010) R: A language and environment for statistical computing. Vienna: R Foundation for Statistical Computing. 57. Wood S (2006) Generalized additive models: an introduction to R. London:
Chapman & Hall.
58. Zuur AF, Ieno EN, Walker NJ, Saveliev AA, Smith GM (2009) Mixed effects models and extensions in Ecology with R. New York: Springer.
59. Jenni L, Winkler H (1994) Moult and Aging of European Passerines. London, New York: Academic Press.
60. Robinson RA, Baillie SR, Crick HQP (2007) Weather-dependent survival: implications of climate change for passerine population processes. Ibis 149: 357– 364.
61. Alatalo RV, Lundberg A (1984) Density-dependence in breeding success of the pied flycatcher (Ficedula hypoleuca). Journal of Animal Ecology 53: 969–977. 62. Bauer H-G, Bezzel E, Fiedler W (2005) Das Kompendium der Vo¨gel
Mitteleuropas. Wiebelsheim: AULA-Verlag.
63. Jakober H, Stauber W (2000) Werden die Neunto¨ter (Lanius collurio) kleiner? Journal fu¨r Ornithologie 141: 408–417.
64. Yom-Tov Y (2001) Global warming and body mass decline in Israeli passerine birds. Proceedings of the Royal Society B 268: 947–952.
65. Fiedler W (2003) Recent changes in migratory behaviour of birds: a compilation of field observations and ringing data. In: Berthold P, Gwinner E, Sonnenschein E, editors. Avian Migration. New York: Springer. pp. 21–37.
66. van Vliet J, Muster CJM, Ter Keurs WJ (2009) Changes in migration behaviour of blackbirdsTurdus merulafrom the Netherlands. Bird Study 56: 276–281. 67. Desrochers A (2010) Morphological response of songbirds to 100 years of
landscape change in North America. Ecology 91: 1577–1582.
68. Dayan T, Simberloff D (1998) Size patterns among competitors: ecological character displacement and character release in mammals, with special reference to island populations. Mammal Review 28: 99–124.
69. Alatalo RV, Gustafsson L, Lundberg A (1990) Phenotypic selection on heritable size traits: environmental variance and genetic response. American Naturalist 135: 464–471.
70. Moreno-Rueda G, Rivas JM (2007) Recent changes in allometric relationships among morphological traits in the dipper (Cinclus cinclus). Journal of Ornithology 148: 489–494.
71. Liker A, Papp Z, Bo´kony V, Landvai A´ Z (2008) Lean birds in the city: body size and condition of house sparrows along the urbanization gradient. Journal of Animal Ecology 77: 789–795.
72. Yom-Tov Y, Yom-Tov S (2006) Decrease in body size of Danish goshawks during the twentieth century. Journal of Ornithology 147: 644–647. 73. McNab BK (2010) Geographic and temporal correlations of mammalian size
reconsidered: a resource rule. Oecologia 164: 13–23.