Butterflies Allows for a Comprehensive Analysis of
Synteny with the Lepidopteran Reference Genome
Patrı´cia Beldade1,2*, Suzanne V. Saenko1, Nicolien Pul1, Anthony D. Long3
1Institute of Biology, Leiden University, Leiden, The Netherlands,2Instituto Gulbenkian de Cieˆncia, Oeiras, Portugal,3Department of Ecology and Evolutionary Biology, University of California Irvine, Irvine, California, United States of America
Abstract
Lepidopterans (butterflies and moths) are a rich and diverse order of insects, which, despite their economic impact and unusual biological properties, are relatively underrepresented in terms of genomic resources. The genome of the silkworm
Bombyx morihas been fully sequenced, but comparative lepidopteran genomics has been hampered by the scarcity of
information for other species. This is especially striking for butterflies, even though they have diverse and derived phenotypes (such as color vision and wing color patterns) and are considered prime models for the evolutionary and developmental analysis of ecologically relevant, complex traits. We focus on Bicyclus anynana butterflies, a laboratory system for studying the diversification of novelties and serially repeated traits. With a panel of 12 small families and a biphasic mapping approach, we first assigned 508 expressed genes to segregation groups and then ordered 297 of them within individual linkage groups. We also coarsely mapped seven color pattern loci. This is the richest gene-based map available for any butterfly species and allowed for a broad-coverage analysis of synteny with the lepidopteran reference genome. Based on 462 pairs of mapped orthologous markers inBi. anynanaandBo. mori, we observed strong conservation of gene assignment to chromosomes, but also evidence for numerous large- and small-scale chromosomal rearrangements. With gene collections growing for a variety of target organisms, the ability to place those genes in their proper genomic context is paramount. Methods to map expressed genes and to compare maps with relevant model systems are crucial to extend genomic-level analysis outside classical model species. Maps with gene-based markers are useful for comparative genomics and to resolve mapped genomic regions to a tractable number of candidate genes, especially if there is synteny with related model species. This is discussed in relation to the identification of the loci contributing to color pattern evolution in butterflies.
Citation:Beldade P, Saenko SV, Pul N, Long AD (2009) A Gene-Based Linkage Map forBicyclus anynanaButterflies Allows for a Comprehensive Analysis of Synteny with the Lepidopteran Reference Genome. PLoS Genet 5(2): e1000366. doi:10.1371/journal.pgen.1000366
Editor:Michael W. Nachman, University of Arizona, United States of America
ReceivedSeptember 25, 2008;AcceptedJanuary 5, 2009;PublishedFebruary 6, 2009
Copyright:ß2009 Beldade et al. This is an open-access article distributed under the terms of the Creative Commons Attribution License, which permits
unrestricted use, distribution, and reproduction in any medium, provided the original author and source are credited.
Funding:This work was performed under the auspices of the US Department of Energy’s Office of Science, Biological and Environmental Research Program, and by the University of California, Lawrence Berkeley National Laboratory under contract No. DE-AC02-05CH11231, Lawrence Livermore National Laboratory under Contract No. DE-AC52-07NA27344, and Los Alamos National Laboratory under contract No. DE-AC02-06NA25396. The authors also wish to acknowledge support from the National Science Foundation USA (NSF grant to ADL, DEB-0235697), the Dutch Organization for Scientific Research (NWO grant to PB, VENI 863.04.013) and the Portuguese Foundation for Science and Technology (FCT grant to PB, PTDC/BIA-BDE/65295/2006).
Competing Interests:The authors have declared that no competing interests exist. * E-mail: [email protected]
Introduction
With the need for a wider sampling of biological diversity [1–3], the availability of tools for large-scale genetic and genomic analysis is rapidly being extended beyond a handful of classical model systems. Gene collections are growing for various species and with them, the need for methods to assign genes to genetic maps and to assess synteny with relevant sequenced genomes. Gene-based linkage maps are invaluable in the search for the loci that contribute to phenotypic evolution; they are more easily transferable and comparable between species than anonymous markers, and facilitate resolution of mapped genomic regions to candidate genes, also via comparisons of maps or gene functions between species.
The Lepidoptera (butterflies and moths) are a diverse order of insects with an abundance of species, including many agricultural pests, and one of two species of domesticated insects. Lepidopter-ans have some unusual genetic properties, such as holocentric
chromosomes, heterogametic females, and male-restricted meiotic recombination, whose underlying mechanisms and consequences for genome evolution remain to be fully explored. However, lepidopteran species are relatively under-represented in terms of genomic resources with little available outside the model silkworm Bombyx mori[4]. Comparative genomics among lepidopterans and a detailed comparative analysis of theB. morigenome have been hampered by the relative scarcity of relevant genomic information. Dipterans, the closest insect lineage with available sequenced genomes, diverged from lepidopterans more than 200 MYA, and there is relatively little genomic information within the Lepidop-tera. This is especially striking for butterfly species (derived from moths some 100 MYA), despite much interest in their diverse, derived, and ecologically-relevant wing patterns.
described in relation to wing development in Drosophila melanogaster have been implicated in formation (reviewed in [5,8]) and variation [9–11] of wing patterns in butterflies. Despite the success of the Drosophila-based candidate gene approach, it is clear that a more unbiased approach will be necessary. For example, for those cases where there are no obvious candidate genes [12], and because it is conceivable, if not likely, that genes other than those described for a derived model system will be relevant for traits that are restricted to a lineage diverged more than 200 MYA. For this reason, there have been a number of recent efforts to push forward butterfly genomics [13,14], including construction of large EST collections [15–17], and genetic linkage maps [18–21] for a few target species. The latter are, however, largely or exclusively composed of anonymous markers, limiting broad-coverage comparative analysis of gene co-segregation and order across species. Recent studies based on a limited number of pairs of mapped orthologous markers have proposed conservation of syntenic blocks and gene order betweenB. mori andManduca sexta moths and/orHeliconius melpomenebutterflies [22–25]. Extending this type of analysis to many more pairs of mapped orthologs will be crucial to exploring the use ofB. morias a pan-lepidopteran genomics reference, and to allow integration of genomics information now accumulating for different species of butterflies [14].
Bicyclus anynanais probably the closest to a butterfly equivalent of a ‘‘lab rat’’. This species was introduced to captivity some two decades ago and it has since been the focus of studies on the evolution and development of wing patterns and other phenotypes [26]. Two key processes in morphological evolution are captured on the wings of these butterflies; diversification of evolutionary novelties (as are the scale-based color patterns of butterflies [27]), and of serially-repeated structures (as are the eyespots of many Nymphalids [28]). Laboratory populations ofB. anynanahave been used to examine the genetic, developmental, and physiological basis of phenotypic variation [29], and have provided the material for identification of anonymous [30] and expressed gene-based [15,31] markers. Here, we describe a study that genetically maps SNPs in a large number of ESTs toB. anynanachromosomes. We use a mapping panel composed of a number of small families to maximize the number of mapped markers and produce the
densest gene-based map available to date for any butterfly species. This map includes a number of color pattern loci defined by spontaneous Mendelian mutations and enabled a large-scale analysis of synteny with the lepidopteran reference species. The usefulness of gene-based linkage maps and comparative analysis of chromosomal composition is illustrated in relation to the identification of color pattern loci.
Results/Discussion
We used a biphasic linkage mapping method [32] to map 508 markers on expressed genes and seven color pattern loci in B. anynanalinkage groups (LGs). With the largest collection of anchor loci mapped to date for any butterfly species, we were able to do a broad-coverage comparison of gene co-segregation and gene order between B. anynana butterflies and the lepidopteran reference species,Bombyx mori. Our analysis confirmed previous reports of conserved synteny in the Lepidoptera and also detected several small- and large-scale chromosomal rearrangements separatingB. anynanabutterflies andB. morimoths.
Expressed Gene-Derived and Color Pattern Markers
We selected 768 SNPs in expressed genes to genotype in a mapping panel composed of 288 individuals from 12 F2 families (Table S1). These markers correspond to 745 SNPs in 744 UniGene contigs (marker name starting with BaC) and 23 SNPs in 14 selected candidate genes (marker name starting with BaG). The contigs were identified from the assembly of over 100,000 EST reads, and the candidate genes were selected based on their developmental roles (see Methods). We selected a single SNP for most genes, with the exception of 5 genes whose potential role in development warranted extra effort. Seventy percent (533 of 768) of the target SNPs converted into good assays, defined as those with 90% of the panel individuals being genotyped and with a minor allele frequency greater than 5%. For these SNPs (Table S2), each of the 12 families had an average of 60 SNPs that were informative in females only (ranging from a maximum of 84 to a minimum of 43), 63 SNPs that were informative in males only (ranging from 81 to 44), and 141 SNPs that were doubly-informative (ranging from 155 to 119). On average, each of those SNPs was male-informative only in 1.4 families, female-informative-only in 1.3 families and both male and female informative in 3.2 families. Upon visual inspection of the genotypes for the 533 markers (Table S2), we identified 513 markers with autosomal segregation patterns, 9 with segregation patterns consistent with sex linkage, and 11 with several Mendelian inconsistencies which were excluded from further analysis.
Absence of recombination in lepidopteran females can be exploited to construct genetic linkage maps via ‘‘biphasic mapping’’ [32]; marker pairs that are female fully-informative are used to initially assign markers to segregation groups, and male informative markers are then used to order markers within those groups. We used this strategy and CRIMAP software for pedigree analysis [33] and were able to assign 508 SNPs to 28B. anynana linkage groups (Table 1; Figures 1–4), possibly corresponding to the 27 autosomes and Z sex chromosome of this species [20]. We were able to map 10 of our 14 candidate genes (BaG markers): cubitus interruptus (ci), Ecdysone receptor (EcR), engrailed (en), APC-like (Apc),naked cuticle(nkd),cinnamon(cin),Henna(Hn),echinus(ec),Catalase (Cat), and Heat-shock protein 70(Hsp70). Failure to map the other four candidate genes was due to a failed assay (split ends, spen), Mendelian inconsistencies (scabrous,sca), or the SNP being fixed in the mapping panel (wingless,wgandgroucho,gro).
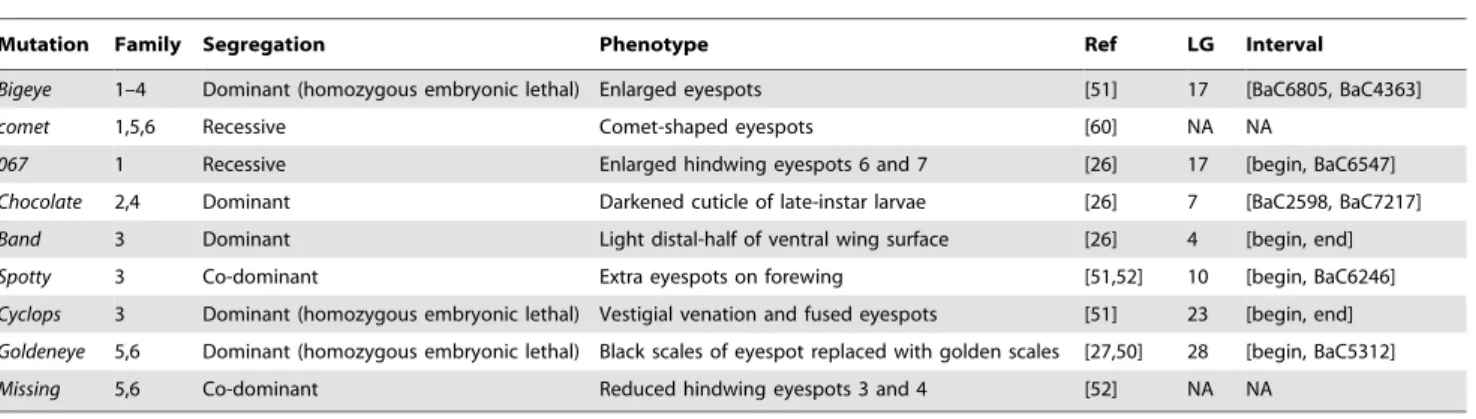
We also attempted to map nine Mendelizing mutations affecting body or larval coloration which were segregating in some of the 12 Author Summary
full-sib mapping families (Table 2). Two of the visible markers could not be mapped (LOD score not significant), and the other seven were assigned to six LGs. Mapped markers typically had poorly resolved map positions, often corresponding to the entire length of the chromosome (Figures 1–4, Table 2). Among the mapped visible mutants, two are particularly worrisome: 1) the Spotty mutation for which a 2 LOD support interval included positions at either end, but excluded the middle region of LG10 , and 2) the Goldeneye mutation which mapped to LG28 whose validity we are uncertain of (see below). Poor mapping resolution for the visible markers likely reflects the fact that: 1) any given mutation was typically only segregating in 1–4 families (Table 2), 2) in the case of non co-dominant mutations a fraction of the segregants needed to be scored as ‘‘missing’’ which resulted in further loss of resolution, and 3) the mutations may not be 100% penetrant. Nonetheless, the mapping of these mutations to chromosomes is a very valuable first step towards efforts to clone
the corresponding loci. Fine mapping efforts need now only employ markers in the same linkage groups.
With 508 markers in expressed genes and seven visible mutants, this is the densest non-anonymous marker map ever reported for a butterfly species. Up until now, the most anchor loci mapped in this group was 101 for Heliconius melpomene (cf. [23]), another Nymphalid.
B. anynanaGene-Based Linkage Map
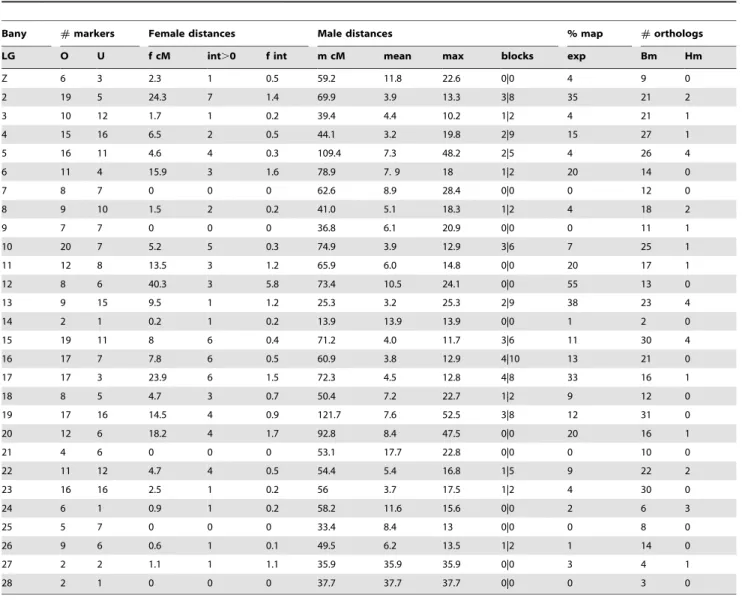
For all the SNPs assigned to a given segregation group we used male informative markers to build a map for that group (Figures 1– 4). For 297 of the 508 gene-based markers, we were able to assign a position in the corresponding LG (hereafter, ‘‘ordered markers’’; Table S3). The remaining 211 markers were not assigned to a unique position, but their position was typically narrowed to two or three intervals (hereafter, ‘‘unordered markers’’; Table S4). LGs had on average 10.6 ordered and 7.5 unordered markers with Table 1.Summary of mapping information for the gene-based markers assigned toBicyclus anynanalinkage groups.
Bany #markers Female distances Male distances % map #orthologs
LG O U f cM int.0 f int m cM mean max blocks exp Bm Hm
Z 6 3 2.3 1 0.5 59.2 11.8 22.6 0|0 4 9 0
2 19 5 24.3 7 1.4 69.9 3.9 13.3 3|8 35 21 2
3 10 12 1.7 1 0.2 39.4 4.4 10.2 1|2 4 21 1
4 15 16 6.5 2 0.5 44.1 3.2 19.8 2|9 15 27 1
5 16 11 4.6 4 0.3 109.4 7.3 48.2 2|5 4 26 4
6 11 4 15.9 3 1.6 78.9 7. 9 18 1|2 20 14 0
7 8 7 0 0 0 62.6 8.9 28.4 0|0 0 12 0
8 9 10 1.5 2 0.2 41.0 5.1 18.3 1|2 4 18 2
9 7 7 0 0 0 36.8 6.1 20.9 0|0 0 11 1
10 20 7 5.2 5 0.3 74.9 3.9 12.9 3|6 7 25 1
11 12 8 13.5 3 1.2 65.9 6.0 14.8 0|0 20 17 1
12 8 6 40.3 3 5.8 73.4 10.5 24.1 0|0 55 13 0
13 9 15 9.5 1 1.2 25.3 3.2 25.3 2|9 38 23 4
14 2 1 0.2 1 0.2 13.9 13.9 13.9 0|0 1 2 0
15 19 11 8 6 0.4 71.2 4.0 11.7 3|6 11 30 4
16 17 7 7.8 6 0.5 60.9 3.8 12.9 4|10 13 21 0
17 17 3 23.9 6 1.5 72.3 4.5 12.8 4|8 33 16 1
18 8 5 4.7 3 0.7 50.4 7.2 22.7 1|2 9 12 0
19 17 16 14.5 4 0.9 121.7 7.6 52.5 3|8 12 31 0
20 12 6 18.2 4 1.7 92.8 8.4 47.5 0|0 20 16 1
21 4 6 0 0 0 53.1 17.7 22.8 0|0 0 10 0
22 11 12 4.7 4 0.5 54.4 5.4 16.8 1|5 9 22 2
23 16 16 2.5 1 0.2 56 3.7 17.5 1|2 4 30 0
24 6 1 0.9 1 0.2 58.2 11.6 15.6 0|0 2 6 3
25 5 7 0 0 0 33.4 8.4 13 0|0 0 8 0
26 9 6 0.6 1 0.1 49.5 6.2 13.5 1|2 1 14 0
27 2 2 1.1 1 1.1 35.9 35.9 35.9 0|0 3 4 1
28 2 1 0 0 0 37.7 37.7 37.7 0|0 0 3 0
Bany LG=B. anynanalinkage groups whose number reflects homology withB. moriLGs (see Figures 1–4);#markers= number of ordered (O) and unordered (U) markers. For the ordered markers:f cM= female map size;int.0= number of cases where ‘‘female distance’’ between consecutive markers is not zero,f int= average ‘‘female distance’’ for all consecutive markers;m cM= male map size;mean= average distance between markers in males (not excluding intervals with distance = 0 cM);
max= maximum distance between markers;block= number of blocks of markers mapping to same cM position | number of markers in those blocks.% map exp= map expansion (calculated asf cM/m cM). For all markers:#orthologs= number of markers with mapped orthologs inBombyx mori(Bm) andHeliconius melpomene(Hm). All data for ordered and unordered markers are available in Tables S3 and S4, respectively.
standard deviations of 5.5 and 4.6 respectively (Table 1). Three linkage groups (LG24, LG27, and LG28) consisted only of single ordered markers at the tips and zero to two extra, unordered markers. In addition, despite a total of 24 markers assigned to LG13, this LG only had markers placed at the tips. The reasons for poor marker resolution in LG13 are unknown.
Our total estimated map length, based on LG ‘‘male-based’’ distance between terminal markers, was 1642.2 cM, with individual LG length varying between ,14 cM (LG14) and
,122 cM (LG19) (Table 1). This map length is well within that estimated for different butterfly species (1430 cM–2542 cM, [18,19,21]) and close to that estimated forB. anynanabased largely on AFLP markers (1354 cM or 1873 cM depending on the mapping software usedcf.[20]). However, because of the probable non-zero distance between terminal markers and chromosome ends, the ‘‘male distance’’ between terminal markers can be an underestimate of actual LG lengths.
Our dataset allows for two types of quality control of map assignments. First, estimates of map distance in females (which should be zero since they do not have recombination) is a measure of potential map expansions due to errors. About 26% (70 of 269) of the ‘‘female distances’’ between neighbor ordered markers were greater than 0 cM (Table 1). The average distance for the non-zero distances was 3.0 cM, and included 11 distances greater than 5 cM, and 4 greater than 10 cM (Table S3). The total female map is 212.4 cM implying a map expansion due to genotyping errors and/or the mapping algorithm of ,12.9%. The extent of this expansion varies greatly between LGs (Table 1); while for most, the expansion is lower than 10%, for LG12 it reaches 55% (due mainly to a single terminal marker; see Table S3). Secondly, male recombinational distance between multiple SNPs at the same gene measures error in map position assignments. We have two genes where multiple markers have been ordered,Apc (LG6) andEcR (LG10). ForApctwo of the three ordered markers overlap and the third maps at a distance of 5.4 cM from them, while forEcRall
three markers map to positions within 2.6 cM from each other (Figures 1–4). The average maximum distance between ordered non-overlapping markers at the same locus is 4 cM, and the average distance of the four possible distances between consecutive markers (0, 5.4, 1.9, 0.7) is 2 cM. Some of this error is certainly associated with genotyping errors, but it may also result from our mapping approach which attempts to integrate marker informa-tion over several families (see below). In any case, this analysis suggests that distances smaller than ,5 cM might not be well resolved in our map.
Mapping Strategy
Our method was designed to maximize the number of gene-based markers assigned to linkage groups with minimumde novo SNP identification. This approach involved: 1) focusing on SNPs identified in EST collections (thus, in expressed genes) and for which the minor allele was seen at least twice (thus making it less likely that SNPs are cDNA-related errors; [31]), 2) using a mapping panel composed of a number of small families rather than one large one (maximizing the number of mapped markers at the expense of their mapping resolution; see below) and CRI-MAP software for pedigree analysis, 3) using Illumina GoldenGate genotyping technology (without any per SNP assay optimization), and 4) following a biphasic linkage mapping method [32] which takes advantage of the fact that there is no recombination in lepidopteran females.
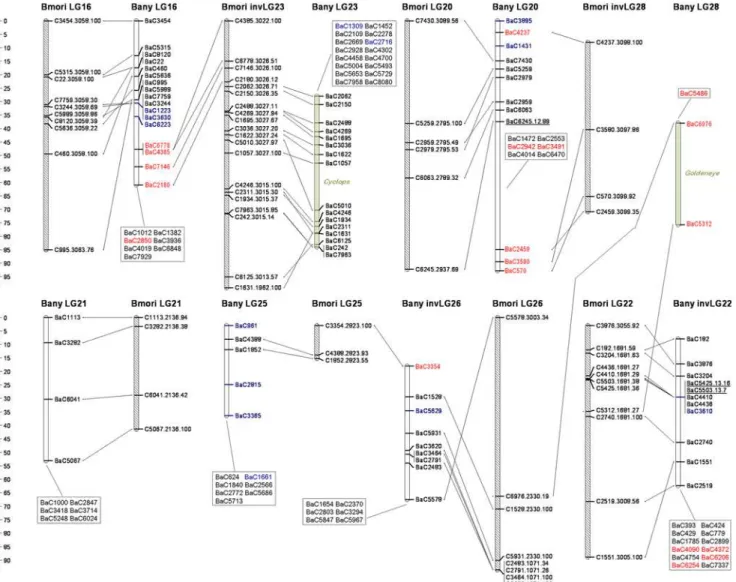
We chose to use a mapping panel made up of a number of small families rather than the more typical single large family. With this strategy we maximize the chance of assigning any given SNP to a LG (as this only requires having one female informative family), and, once assigned to a linkage group, we maximize the chance of identifying at least a second family in which that SNP is (also) male informative. Of the 508 mapped markers, 11 corresponding to nine Z-linked loci and to two autosomal markers (BaC645 on LG2 and BaC4454 on LG11;cf.Methods) were not female-informative Figure 1.Bicyclus anynanalinkage map and pan-macrolepidopteran synteny.OrthologousB. anynana(empty) andBombyx mori(dashed) LGs are shown with lines connecting orthologous markers. Numbering ofB. anynanaLGs reflects homology withB. mori(except for LG28). LGs labeled with ‘‘inv’’ were inverted to match marker order in the other species. Only thoseB. morimarkers with mappedB. anynanaorthologs are shown; their label follows the format A.B.C, with A = correspondingB. anynanamarker name except for the ‘‘Ba’’ prefix, B =B. moriscaffold containing the marker, and C = log10(e-score) of the corresponding blast. Ordered markers are shown along the LGs (cM distances betweenB. anynanamarkers can be seen on scale to the right of each row of LGs), and unordered markers inside boxes. Marker names are shown in green if they correspond to visible mutations (likely position displayed as green shading inside the corresponding LG), blue if they either do not blast anyB. moriscaffold or blast aB. moriscaffold which is not mapped, red if they blast aB. moriscaffold on a non-orthologous (i.e. different-number)B. moriLG, and black for all markers in orthologousB. moriLGs. UnderlinedB. anynanamarkers have mapped orthologs inHeliconius melpomene; nomenclature D.E.F for ordered markers follows: D =B. anynanamarker name, E =H. melpomenelinkage group [23] it blasts to, and F = log10(e-score) of the corresponding blast (same information for unordered markers is available in Table S4).
(i.e. heterozygous) in any family. Similarly, only three SNPs were not male informative in any family (Table S2). A panel derived from several independent parental pairs, additionally allows for estimates of population SNP frequencies, which will be useful in future mapping experiments. The disadvantages of this strategy are noticeable in terms of mapping resolution when a marker is male informative only in a single (or few) families and because of the need to integrate marker information across families. The majority of the SNPs (264 of 508) were male-informative (including both SNPs informative only in males and those doubly-informative) in at least five families (corresponding to at least 120 individuals in the mapping panel), and three SNPs were informative for a maximum of ten families (240 individuals).
In downstream uses of this map (e.g., for mapping QTLs or visible mutants), we will be able to choose from mapped, intermediate-frequency, informative SNPs, to design assays for larger mapping panels derived from a smaller number of founders. For this, having a large number of gene-based markers (even if mapped with limited resolution) and knowledge of SNP frequency is more useful than having a very accurate map of sparse markers (which may not be informative in another context).
Pan-Lepidopteran Reference Genome: The Silkworm
Bombyx mori
A recent very high density SNP map for Bombyx mori [34] combined with a new assembly (unpublished) of the whole-genome Figure 2. See legend to Figure 1.
sequence of this species [35,36] with larger average scaffold sizes, may be used as a pan-Lepidoptera reference. Using blastn, we assigned 1711 of the 1755 mapped SNPs in the silkwormB. mori [34] to the recent genome-sequencing scaffolds [37] (Table S5). The mapped markers aligned to 185 of the 645 different scaffolds, consistent with the highly skewed distribution of scaffold lengths. Of the 185 scaffolds to which markers mapped 29%, 10%, 6%, and 6% had one through four mapped markers, respectively. On the other hand,,90% of the mapped markers were assigned to only 91 scaffolds having more than four markers each, implying that the bulk of the currentB. morigenome assembly is contained in 91 large scaffolds. As a check on the quality of the current assembly, we looked for scaffolds with more than four mapped markers in which at least one marker mapped to a different linkage group than the remainder. We observed seven scaffolds (7.7%) with material coming from two chromosomes and two additional scaffolds (2.2%) with material derived from three chromosomes, suggesting that there are errors with the current assembly. A visual inspection suggests that those assembly errors tend to be associated with the very ends of scaffolds. So, although the fraction of large scaffold with such errors is significant, very little of the assembly is affected. We next fitted local regressions for each scaffold that allowed for predictions of genetic positions (cM) given a physical position (bp) on the scaffold (see Methods). TheB. morimap thus
generated was the basis for the comparative analysis with ourB. anynanagene-based map.
The currentB. morimap consists of over 1650 SNPs covering 1413 cM [34]. With 28 chromosome pairs,B. morihas the largest chromosome number of all insect genomes sequenced to date. Previous studies of deep synteny across insects showed that divergent gene order correlates with divergent protein sequence [38], and that there is more conservation of syntenic groups between B. mori and the coleopteran Tribolium castaneum than betweenB. mori and the hymenopteran Apis mellifera [34]. Both these orders have presumably split from a common ancestor with lepidopterans earlier than dipterans did. However, analysis of synteny blocks with sequenced representatives of the Diptera is hampered by the large difference in chromosome number; typically around 30 pairs in most lepidopteran species [39] and between three and six pairs for the various sequenced dipteran (mosquito and Drosophila) species. Among lepidopterans, and despite the available phylogenetic framework for comparative analysis (e.g. [40–44]), relatively sparse genomic resources have resulted in very few attempts to examine synteny. Previous studies compared synteny blocks between moths andHeliconiusbutterflies based on a modest number of mapped orthologous pairs (maximum 72 with many ‘‘unordered’’ [23]). Here, in a comparison between B. mori and B. anynana genetic maps, we Figure 3. See legend to Figure 1.
increased this number by more than seven times, with a large fraction of our markers being ‘‘ordered’’. This type of analysis, hopefully extending also to representatives of the microlepidoptera (all lepidopterans examined to date are macrolepidopterans), will be crucial to put the gene collections and genetic maps, growing for a variety of butterfly species, into phylogenomic context.
Pan-Macrolepidopteran Macro-Synteny: Conservation of Chromosomal Gene Composition
We used blast to identify orthologs of the gene-based markers in B. anynana (Neolepidoptera; Papilionoidea; Nymphalidae; Satyr-inae) mapped in other lepidopteran species: the butterflyHeliconius melpomene (Neolepidoptera; Papilionoidea; Nymphalidae; Helico-niinae), and the silwormBombyx mori(Neolepidoptera; Bombycoi-dea; Bombycidae; Bombycinae). Of the 508B. anynanamarkers, 29 (18 ordered and 11 unordered) had an ortholog among the 101 anchor loci mapped in H. melpomene[23], and 462 (269 ordered and 193 unordered) could be assigned to a mapped B. mori scaffold. Of the remaining 46 mappedB. anynanamarkers (blue in Figures 1–4), 20 had orthologs inB. moriscaffolds which we could not assign to aB. moriLG and 26 did not have significant sequence similarity with anyB. moriscaffold.
Despite the ca. 100 MY that separate butterflies and moths [23,42], there is much conservation of the grouping of genes in linkage groups (Figures 1–5). Our numbering of B. anynana LGs reflects homology withB. moriwith the exception ofB. anynanaLG28, which has only two markers and none with orthologs mapping toB. moriLG28 (Figures 1–4). Of the 462 pairs of mapped orthologous markers in the two species, 425 (,92%) are found in orthologous LGs (Figure 5). The 37 orthologous genes found on non-orthologous LGs, include 17 that are associated with three large chromosomal rearrangements (involving LG2 and LG24, LG16 and LG23, and LG20 and LG28), and 20 which are potential single gene transpositions. The latter may also include blast false positive (even though only five cases had e-values higher than 1.0e-20; Figure 5), blasts to pseudo- or duplicate genes, or mapping errors (e.g., markers mapping to non-syntenic linkage groups that are isolated at the tips of chromosomes are especially suspicious). BothB. moriandB. anynana have 28 pairs of chromosomes, while basal lepidopterans have 31 pairs [45] and different species of butterflies and moths have very variable numbers [39,45–47]. The instances where individual B. anynanaLGs are made up of syntenic blocks from differentB. moriLGs suggest that the two lineages have undergone independent karyotype reductions, via non-homologous chromosomal fusions.
Figure 4. See legend to Figure 1.
A previous study compared linkage group assignment for 72 orthologous pairs of markers available for another Nymphalid butterfly (Heliconius melpomene) and the reference lepidopteran (Bombyx mori) and concluded that extensive synteny existed [22,23]. Some striking differences, however, are apparent between the genome-wide analysis of macro-synteny forB. moriandB. anynana (this paper) and that forB. moriandH. melpomene[23]. First, the comparison betweenH. melpomeneandB. moridid not detect any of the chromosomal rearrangements we document (Figures 1–4). This may be because these rearrangements are not present in Heliconius, or because they could not be detected given the
relatively small number of mapped orthologs pairs inH. melpomene and B. mori. Thus, it remains unclear to what extent the rearrangements we see in B. anynana are characteristic of Nymphalid butterflies or more lineage-restricted. Second, we see no evidence of the six chromosomal fusions proposed to distinguish theH. melpomeneand B. morigenetic maps [23]. This probably reflects the fact thatHeliconiusbutterflies have a lower chromosome number (21 pairs instead of the 28 pairs in bothB. anynanaand B. mori), and must thus have undergone further, or independent, chromosomal fusions relative to B. anynana. It is, however, noteworthy that the proposed fusions separating H. Table 2.Visible mutants in mapping panel.
Mutation Family Segregation Phenotype Ref LG Interval
Bigeye 1–4 Dominant (homozygous embryonic lethal) Enlarged eyespots [51] 17 [BaC6805, BaC4363]
comet 1,5,6 Recessive Comet-shaped eyespots [60] NA NA
067 1 Recessive Enlarged hindwing eyespots 6 and 7 [26] 17 [begin, BaC6547]
Chocolate 2,4 Dominant Darkened cuticle of late-instar larvae [26] 7 [BaC2598, BaC7217]
Band 3 Dominant Light distal-half of ventral wing surface [26] 4 [begin, end]
Spotty 3 Co-dominant Extra eyespots on forewing [51,52] 10 [begin, BaC6246]
Cyclops 3 Dominant (homozygous embryonic lethal) Vestigial venation and fused eyespots [51] 23 [begin, end]
Goldeneye 5,6 Dominant (homozygous embryonic lethal) Black scales of eyespot replaced with golden scales [27,50] 28 [begin, BaC5312]
Missing 5,6 Co-dominant Reduced hindwing eyespots 3 and 4 [52] NA NA
For each visible marker, we list which families were segregating for the mutant allele, and the marker’s segregation properties and phenotype plus references where it has been described. We also report on the LG where the marker mapped to, and the one LOD support interval (see also Figures 1–4; NA is used for those markers we were not able to map).
doi:10.1371/journal.pgen.1000366.t002
Figure 5. Oxford Grid representing conservation of marker co-segregation betweenBicyclus anynanaandBombyx morilinkage groups.For each inter-specific LG pair, the number in the cell represents the total number of mapped orthologous markers (blast cut-off e-score 1.0e-05; numbers in brackets correspond to number of blast hits with e-scores greater that 1.0e-20). Grey shading highlights LG pairs sharing at least one orthologous gene.
melpomene and B. mori are based on few pairs of mapped orthologous markers (mostly 1–3 pairs [23]) and our analysis shows that single marker transpositions do occur (Figures 1–5).
Pan-Macrolepidopteran Micro-Synteny: Conservation of Gene Order
Figures 1–4 illustrate synteny between B. anynanaand B. mori orthologous markers: both in terms of the grouping of markers in LGs (see also Figure 5), and in terms of conservation of gene order along individual LGs. For most LGs with multiple ordered markers, we have evidence for some reordering of genes which suggests multiple inversions separatingB. anynanaandB. mori.
From the 23B. anynanaLGs with greater than three ordered and non-overlapping markers (i.e. excluding multiple markers mapping to the same genetic position), with a mappedB. moriortholog on a syntenic block, only LG10 and LG21 have fully conserved marker order (Figures 1–4). For the remaining LGs, we see evidence of order rearrangements ranging from one (e.g. LG9, LG18) to multiple (e.g. LG17, LG19) markers whose relative position inB. anynana differs from that in B. mori. Where the marker order inferred for B. anynana differed from that of the orthologous markers inB. mori, we compared the log10 likelihoods of the two (Table S6). Of the 24 comparisons made (complete LGs or LG fragments with homology to differentB. moriLGs), inferred marker order inB. anynanawas at least twice as likely thanB. moriorder in 20 cases (and at least 630 times more likely for 18 of the comparisons). For the four situations where theB. moriorder was better supported than the one originally inferred for B. anynana (LG2, LG6, LG10, and LG17), and for LG13 (which had many but very poorly resolved markers and where the original inferred order was only,2 times better than that ofB. mori), we used theB. moriorder as a starting point in CRI-MAP and further improved it (see Methods). In all cases except LG10, and the LG2 segment homologous toB. moriLG2, the final order was different from that inB. mori. The difference between the log10 likelihoods for the final inferred marker order inB. anynanaand that inB. moriranges between 1.1 for LG13 (i.e. the inferred B. anynanaorder is,13 times more likely than that in B. mori) and 34.8 for LG11 (i.e. inferred order,10‘34 times better) (Table S6). Becausede novo map construction using CRI-MAP uses a ‘‘hill climbing’’ algorithm to maximize marker order likelihood, the map order arrived at is dependent on the particular subset of markers used to initiate a build. This explains why the build corresponding to some B. anynanaLGs reached a local maximum that could be improved upon by using theB. morigene order as seed. Note that marker mapping was further improved by re-adding to the map markers with no mappedB. mori ortholog and by re-assessing unordered markers in those LGs. The mapping information in all Tables and Figures corresponds to the final CRI-MAP builds.
Our data suggest that previous conclusions of highly conserved gene order between H. melpomeneand B. mori[23–25] may have been over-stated, perhaps as a result of the limited number of markers examined (maximum of 10 ordered orthologous pairs in one syntenic block [25]). Future work adding extra markers and improving marker mapping resolution inB. anynana, and extending comparative analysis to additional species will be crucial to rigorously quantify the extent of inversions separating different lepidopteran lineages. Unfortunately, the number of shared ordered markers in theH. melpomeneandB. anynanamaps prevents evaluating the consistency of gene order within Nymphalid butterflies. We have a single B. anynana LG (LG15) with greater than two ordered markers with mapped orthologs inH. melpomene. However, of those four markers, only one has a resolved genetic
map position in H. melpomene [23] making impossible the assessment of conservation of gene order.
Previous studies that analyzed order of more than three ordered H. melpomene-B. morimarker pairs were much more localized than the study presented here. They either focused on one individual chromosome (and reported on four perfectly aligned markers [24]), or on a BAC-level scale (and reported on nine of ten aligned markers [25]). However, conservation of gene order for small collections of orthologous markers can occur by chance alone (e.g., four perfectly aligned markers occur by chance,10% of the time), and comparisons of marker order at the level of single BACs can only infer conservation at sub-centimorgan scales. Here, we extended the analysis of gene order to many more markers in many more linkage groups and alert for the fact that, even though we have syntenic blocks and broad conservation of gene order (see, for example, LG10), we also have clear evidence of multiple rearrangements (see, for example, LG19). These intra-chromo-somal rearrangements do not mean thatB. moricannot serve as a pan-macrolepidopteran reference, but they do argue that marker order is likely conserved over tens of centimorgans as opposed to entire linkage groups. Our observations are remarkably similar to the emerging consensus view in the Drosophila clade (including species diverged some 40 MYA), that the assignment of genes to Mullerian elements is highly conserved but gene order within those elements is variable [48,49]. It will be interesting to look both more widely (across species from different families) and also more narrowly (across multiple species within some selected genera) in the Lepidoptera. It is still unclear how the relatively numerous and relatively small (in insect terms) chromosomes in this diverse group have evolved and what the role of the holocentric chromosome structure and male-restricted recombi-nation has been in the process.
Mapping Butterfly Color Pattern Loci
Aside from enabling analysis of macro- and micro-synteny, gene-based maps are of great value in studies attempting to map genes that contribute to phenotypic variation because they greatly facilitate the resolution of mapped genomic regions into a tractable number of candidate genes. This is not only because the mapping analysis itself can exclude candidate genes (namely, those in non-implicated LGs), and identify candidate genes among available markers, but also because conservation of gene grouping and gene order in related species with dense linkage maps might allow identification of extra candidate genes within the implicated genomic regions. For example, the B. mori ortholog to the pigmentation geneblacklocalizes to aB. moriscaffold (nscaf2986 in [37]) mapping to theChocolate-containing region ofB. anynanaLG7. This makesblack an interesting candidate gene for the Chocolate larval phenotype (Figure 6I).
theengrailed-containing LG2, and hence none can be alleles at this locus. This, of course, does not mean that theengrailedlocus cannot contribute to complex naturally occurring segregating variation or other laboratory mutations affecting wing patterns. Future studies trying to refine the location of each of our mapped color pattern loci will need only to concentrate on markers throughout single LGs, greatly reducing the genotyping effort.
Another exciting aspect of having color pattern loci in gene-based maps of different lepidopteran species is the possibility to investigate to what extent color pattern diversification in different lineages has a similar genetic basis. Recent studies have shown that color pattern loci contributing to race variation map to homologous genomic regions in different Heliconius species [12,53]. Whether these loci play a role in color pattern variation outsideHeliconiusand to what extent color pattern diversification has repeatedly recruited the same loci in different lineages are interesting questions in evolutionary (developmental) biology. We looked forH. melpomeneandB. moricolor pattern loci mapping to orthologous LGs to those where we mapped visible markers inB. anynana (Table 3). Particularly interesting is the case of the B. anynana Bigeye and 067 spontaneous mutations, both affecting
eyespot size (Figure 6, Table 2). We mapped these to LG17, which, based on comparisons toB. mori, we know is orthologous to H. melpomeneLG15 (Table 3). This is the linkage group carrying the color pattern loci above-mentioned which have been implicated in the race-divergence in three differentHeliconiusspecies [6,12,23]. Also, theBandmutant with lighter background coloration on the distal section of the wings maps to LG4 whoseHeliconiusortholog carries a white/yellow color switch locus [10]. In the future, emerging comparative maps in Heliconius and Bicyclus can be exploited to accelerate the dissection of the genetic basis of wing pattern variation in butterflies; potentially aided by patterns of conserved microsynteny detected for ‘‘developmental genes’’ in insect genomes [54].
Concluding Remarks
With gene collections growing for a variety of species, so is the need for methods that enable the mapping of markers in those genes and comparisons with genetic maps of relevant reference species. These maps will aid in the genetic dissection of phenotypic variation in non-model systems, enable analysis of synteny and genome evolution, and facilitate future sequence-assembly efforts. Here, we report on the mapping of 508 markers in expressed genes and seven color pattern loci in an emerging butterfly model system. We used our map to compare gene grouping and gene order with the lepidopteran reference genome. Based on 462 pairs of orthologous markers mapped in Bicyclus anynana and Bombyx mori, we show that there is extensive conservation of syntenic blocks and gene order but not as much as had been previously suggested. We illustrate how gene-based maps and synteny with relevant species in relation to dissecting the genetic basis of wing pattern variation.
Materials and Methods
Butterfly Material
We used different Bicyclus anynana laboratory populations to establish a mapping panel of 288 individuals from 12 families. Figure 6. MappedB. anynanapigmentation mutants.Ventral surface of fore- (top) and hind-wing (bottom) of adult butterflies from different laboratory stocks: (A) ‘‘wildtype’’, and mutants (B)Bigeyewith all eyespots enlarged, (C)067with hindwing eyespots 6 and 7 enlarged, (D)Spottywith two extra eyespots on forewing, (E)Cyclopswith fused eyespots, (F)Goldeneyewith golden scales replacing the typically black scales of the eyespot mid-ring, and (G)Bandwith lighter distal wing half. Top view of a fifth and final instar larvae of different laboratory stocks: (H) ‘‘wildtype’’, and (I) Chocolatemutant with dark-brown integument.
doi:10.1371/journal.pgen.1000366.g006
Table 3.Color pattern loci in orthologous lepidopteran LGs.
B. anynana H. melpomene* B. mori* LG4 Band K mst,L,l-w,Spc
LG7 Chocolate – q,Gb,obt
LG10 Spotty – w-1,w-2,w-3,w-5,Dus,Dp
LG17 Bigeye,067 Yb/Sb/N B,Ws,bts,ow
LG23 Cyclops B/D op
LG28 Goldeneye – –
*References for loci nomenclature and phenotype:H. melpomene[12,23,25], and B. mori[61].
These were all F2 families composed of a F1 mother and father, and 22 offspring (typically 11 females and 11 males). The F2 families were obtained by using single-pairs of P grand-parents that were either from ‘‘outbred’’, or 1–3 generation inbred (i.e., single brother-sister mating pairs) populations. DNA from thorax or head of freshly frozen butterflies (killed in liquid nitrogen and stored at 280uC until processed) was extracted using the QIAGEN tissue kit following manufacturer’s recommendations. Genomic DNA was checked for quality and yield on agarose gel and NanoDrop spectrophotometer. From each of the 288 individuals in the mapping panel, 1.7mg of genomic DNA in 100ml of QIAGEN kit elution buffer was dried down (SpeedVac), re-suspended in 20ml water, and sent to Southern California Genotyping Consortium - Illumina Genotyping Core Laboratory at UCLA [55].
SNP Markers
We selected 768 SNPs to genotype using the Illumina Golden Gate platform [56]. The 768 target SNPs were identified in 759 expressedB. anynana genes (Table S1). These correspond to 744 contigs resulting from the assembly of an on-going, large-scale EST project (sequencing of the new ,91,000 ESTs (GenBank GE654128–GE745563), assembly of those together with the previously published collection of ,10,000 ESTs [15] and 13 genes available on GenBank nr database, and discovery and characterization of SNPs will be described elsewhere), and 14 candidate genes identified in previous sequencing efforts (including [15,29,57] ). The contig-derived markers (name starting with BaC) correspond to SNPs with a minor allele count of two or greater identified in CAP3 alignments of at least 4 EST reads. We identified,1,200 contigs with at least one such ‘‘double-hit’’ SNP and chose the 745 target SNPs based on criteria listed below. The candidate genes (marker designation starting with BaG) were selected based on their potential role in wing color patterns or other phenotypes of interest. The genesci,EcR,en, andwg, as well as others from the Wingless signaling pathway,Apc, gro, nkd, and spen, are presumably involved in butterfly wing pattern formation [8,58]. The genescinandHnare involved in pigmentation. Other candidate genes represent various key biological processes, such as wing disc development (sca), programmed cell death (ec), lifespan (Cat), and stress response (Hsp70).
We attempted to choose only one high quality SNP for each gene but, in the case of a minority of putativeB. anynanahomologs of developmental candidate genes, we designed two or more assays. These were: two SNPs in the pigmentation gene yellow (BaC4163), in ci (BaG15), en (BaG21), and nkd (BaG24 and BaG25); and four SNPs in Apc (BaG14 and BaG16), and EcR (BaG19 and BaG20). Many criteria went into choosing the target SNPs, including: the estimated frequency of the SNP (preference given to SNPs with high frequency of the minor allele), absence of secondary polymorphisms in the,100 bp up- and down-stream of it, the contig annotation (preference given to markers in genes with sequence similarity to genes in public databases), and score for Illumina ‘‘type-ability’’. Sequences associated with the 768 markers we attempted to genotype are available in Genbank’s sequence or EST archive; accession numbers in Table S1.
Initial Data Filtering
A large fraction of the SNPs assayed converted into working assays and,75% had a call rate of greater than 95%. The poorest 15% of SNP assays had a call rate of 0%, whereas the best 80% had a minimum call rate of 89%. The individuals in our genotyping panel consistently generated good data; a 95% Confidence Interval on the number of called SNPs over
individuals was 626 to 644 with the poorest and second poorest individuals yielding 527 and 600 called SNPs, respectively. Consistent with this narrow confidence interval, we did not consider removing any individuals from the study because of poor quality DNA. The vast majority of SNPs were ascertained from an EST project so the observation that 15–25% of the attempted SNPs did not convert to a useful assay was not unexpected. Reasons for failure to convert include factors such as: SNPs having a low allele frequency in the mapping panel, some SNPs being falsely identified due to over assembly problems, introns resulting in non-functioning Golden-Gate assays, and errors in flanking regions that the Golden-Gate oligonucleotides anneal to [31]. We chose to focus solely on SNPs for which greater than 90% of the genotyped individuals were ‘‘called’’ and whose minor allele frequency over all called individuals was greater than 5%. These criteria resulted in a set of 533 ‘‘converting’’ SNPs (,70% of assays attempted). Most SNPs not meeting our inclusion criteria were very clearly failed assays, so either relaxing or increasing the stringency for a SNP’s inclusion did not greatly change the number of SNPs in further analyses.
Manual Curation
We visually examined the dataset for clear genotyping errors that resulted in a SNP showing a pattern of inheritance inconsistent with Mendelian expectations (Table S2). SNPs fell into three categories: 1) inheritance that was sex linked (nine SNPs), 2) several Mendelian inconsistencies (eleven SNPs), or 3) no or a handful of Mendelian inconsistencies (513 SNPs). Sex-linked SNPs were duly noted as they were treated differently in subsequent steps, and SNPs showing several Mendelian inconsis-tencies (possibly genotyping mistakes, duplicated genes, gene families) were excluded from further consideration. For the SNPs with no or a small number of Mendelian inconsistencies, we manually changed the genotypes of those inconsistent individuals to missing. In the majority of cases this meant discarding the genotype of 1–2 of the 22 full-sib offspring in a family, but in a minority of cases the most parsimonious change involved discarding a parental genotype. This set of 513 hand-annotated putative autosomal SNPs plus the nine sex-linked SNPs were used in all subsequent mapping analysis.
Assigning Markers to Segregation Groups
Ordering Markers within Segregation Groups
For all the SNPs assigned to a given segregation group we used CRIMAP [33] to build a map for that group. As a result of our having 12 full-sib families, in many instances in which there existed a female informative SNP in one family, at least one other family displayed a: 1) male fully-informative SNP-pair (e.g., dad = AaBb & mom = aabb), 2) a male semi-informative SNP-pair (e.g., dad = AaBb & mom = Aabb), or 3) a doubly-informative SNP-pair (e.g., dad = AaBb & mom = AaBb). CRIMAP was designed for integrating such information in complex human pedigree data [33]. We wrote scripts to take the genotyping data for all the SNPs within a segregation group, irrespective of inheritance patterns, and create input files for CRIMAP. We then used the ‘‘build’’ option of CRIMAP to make a consensus map for each segregation group using default parameters, with the exception of lowering the PUK_LIKE_TOL from 3.0 to 1.0. We built a sex-chromosome map using CRIMAP by simply encoding the ‘‘second-allele’’ in each female as a ‘‘9’’ (i.e., an allele not present).
We manually inspected the resulting maps. In cases where the two ‘‘ordered-loci’’ used to initialize the Expectation Maximiza-tion algorithm underlying CRIMAP were loosely linked we re-ran thebuildoption with a different set of random starting loci. In other cases where we observed SNPs that were completely linked in males we re-ran the ‘‘build’’ using the ‘‘hap_sys’’ option for those SNPs. We then used the ‘‘flips4’’ option on the ordered loci to confirm that our maps had the highest possible likelihood, creating a new order when necessary, and re-running the ‘‘build’’ and ‘‘flips4’’ analysis until the order stabilized.
We then used the ‘‘two-point’’ option in CRIMAP in an attempt to assign to segregation groups the remaining 146 putative autosomal markers, not initially assigned. This resulted in our being able to: 1) assign 134 markers to pre-existing segregation groups, 2) merge two pairs of pre-existing linkage groups in single groups, and 3) identify two novel small linkage groups (one having three and the other four SNPs). Typically, added markers displayed a high LOD score for linkage with several members of a pre-existing linkage group and below background LOD scores with members of any other group. The few SNPs that could not be assigned to any segregation group were typically only informative in a single family and/or showed segregation patterns that were unlikely under Mendelian inheritance. Based on the newly defined segregation groups and starting with the markers ordered in the previous round, we carried out another round of ‘‘builds’’, followed by another round of ‘‘flips4’’, and iterating until we achieved an ordering for which the ‘‘flips4’’ command could no longer identify orders with higher likelihoods. Details about the mapping of the ordered and unordered markers are found in Tables S3 and S4, respectively.
Mapping of Visible Mutants
A total of nine Mendelizing visible mutants affecting adult or larval coloration were segregating in six of the twelve full-sibs families used for mapping (Table 2). All offspring of these families were phenotyped and 22 were selected so that each phenotypic class was represented in approximately similar numbers in the mapping panel. Consequently, segregation patterns of the visible mutants in the mapping families do not follow Mendelian ratios. To assign each visible marker to a linkage group, we used the ‘‘two-point’’ option of CRIMAP. This allowed us to assign seven of the nine mutant genes to linkage groups. Despite attempts with lower LOD threshold scores and/or examining only a subset of families we were unable to assign the other two mutants,cometand Missing, to linkage groups. For the seven mutants mapping to
linkage groups we used the ‘‘all’’ option of CRIMAP separately for each mutant and its respective linkage group in an attempt to localize that mutation within a linkage group.
Orthologous Markers in Other Lepidopteran Species
For all genes in theB. anynanamap, we used blastn and tblastx analysis (e-score cut-off value of 1.0e-05) against the scaffolds from theB. morigenome assembly (May 1, 2008; only the ‘‘nscaf’’ fasta entries from [37]), and against the mapped anchor loci inHeliconius melpomene[23]. Two genes in our collection (cianden) did not have a significant direct blast hit to any of the target H. melpomene markers (‘‘na’’ notation in marker name in Figures 1–4). However, we were able to identify orthologous pairs based on annotation available for both species via blast analysis to collections from other species. For the contigs with a B. mori ortholog, we used custom prediction algorithms (see below) to estimate its position in theB. morimap. Details of the blast analysis withB. moriandH. melpomenecan be found in Tables S3 and S4 for theB. anynana ordered and unordered markers, respectively.
Integration with aBombyx moriMap
We downloaded the new collection ofB. moriscaffolds and used blastn to query all the mapped B. mori SNPs from (‘‘DE’’ accessions from [34]) against the collection [37] (Table S5). We then wished to develop a prediction equation for every scaffold, that when given a base position on that scaffold would return the map position associated with that base position. Such a prediction equation would allow us to estimate aB. morimap position for any B. morigene. ForB. moriscaffolds having greater than four mapped markers this predictor is simply the slope and intercept obtained from a linear regression of map position on base position (of the midpoint of the highest scoring blast hit). ForB. moriscaffolds with one to four markers this predictor is simply the average position of the markers mapping to that scaffold. For scaffolds with no mapped markers the predictor is undefined. This heuristic seemed reasonable, as a large fraction of the genome is contained in scaffolds with more than four mapped markers, and scaffolds harboring four or fewer markers are typically small enough that returning a single map position for the midpoint of that scaffold is acceptable. During this annotation effort we discovered a small number of B. mori scaffolds with termini mapping to different chromosomes, we assumed these are mis-assembly errors and removed these sections of scaffold from further consideration.
Assessing Differences in Marker Order Relative toBombyx mori
ortholog). This final build went though additional ‘‘flips’’ rounds and then ‘‘fixed’’ was run on the final order to obtain the map displayed in Figures 1–4.
Graphical Maps
We used the MapChart software [59] to build a graphical representation of the B. anynana genetic map, and of synteny betweenB. anynanaandB. morichromosomes (Figures 1–4) . The map produced by MapChart was further processed to include unordered markers and visible mutations. B. mori markers were named with the corresponding B. anynanamarker name,B. mori scaffold number, and blast e-score (see legend to Figures 1–4). For the graphical display of the synteny analysis, we multiplied estimated map positions ofB. morimarkers by a factor of two so as to facilitate visualization of homologies with the otherwise relatively condensedB. moriLGs. For markers with an estimated position of less than 0 cM, that marker’s position was set as 0 cM and the positions of other markers on same linkage group were adjusted accordingly.
Supporting Information
Table S1 Information on the 768 target SNPs (including frequency, sequence and conversion).
Found at: doi:10.1371/journal.pgen.1000366.s001 (0.54 MB TXT)
Table S2 Genotypes of 288 panel individuals for each of the 533 converted SNPs.
Found at: doi:10.1371/journal.pgen.1000366.s002 (1.04 MB XLS)
Table S3 Mapping details for ordered markers including
comparisons toB. moriandH. melpomene.
Found at: doi:10.1371/journal.pgen.1000366.s003 (0.03 MB TXT)
Table S4 Mapping details for unordered markers including
comparisons toB. moriandH. melpomene.
Found at: doi:10.1371/journal.pgen.1000366.s004 (0.01 MB TXT)
Table S5 Location of mapped B. mori markers in the unpublished scaffold sequences ofB. mori.
Found at: doi:10.1371/journal.pgen.1000366.s005 (0.07 MB TXT)
Table S6 Statistical comparison of marker order inferred forB. anynanaand that inB. mori.
Found at: doi:10.1371/journal.pgen.1000366.s006 (0.01 MB TXT)
Text S1 Readme: text file explaining contents of each of the supplemental tables.
Found at: doi:10.1371/journal.pgen.1000366.s007 (0.01 MB TXT)
Acknowledgments
The authors wish to thank Jasper Felten (SNP identification in some candidate genes), Arjen van’t Hof and Bas Zwaan (one mapping family and discussions), Joe DeYoung (advice on GoldenGate platform), Paul Brake-field (visible mutants), and four anonymous reviewers.
Author Contributions
Conceived and designed the experiments: PB ADL. Performed the experiments: PB ADL. Analyzed the data: PB SVS ADL. Contributed reagents/materials/analysis tools: PB SVS NP ADL. Wrote the paper: PB ADL. Provided the material for and assisted in mapping the visible markers: SVS. Prepared the butterfly material and identified the SNPs in candidate genes: NP.
References
1. Feder ME, Mitchell-Olds T (2003) Evolutionary and ecological functional genomics. Nat Rev Genet 4: 649–655.
2. Mitchell-Olds T, Feder M, Wray G (2008) Evolutionary and ecological functional genomics. Heredity 100: 101–102.
3. Abzhanov A, Extavour CG, Groover A, Hodges SA, Hoekstra HE, et al. (2008) Are we there yet? Tracking the development of new model systems. Trends Genet 24: 353–360.
4. Goldsmith MR, Shimada T, Abe H (2005) The genetics and genomics of the silkworm,Bombyx mori. Annu Rev Entomol 50: 71–100.
5. Beldade P, Brakefield PM (2002) The genetics and evo-devo of butterfly wing patterns. Nat Rev Genet 3: 442–452.
6. Joron M, Jiggins CD, Papanicolaou A, McMillan WO (2006)Heliconiuswing patterns: an evo-devo model for understanding phenotypic diversity. Heredity 97: 157–167.
7. Wittkopp PJ, Beldade P (2009) Development and evolution of insect pigmentation: Genetic mechanisms and the potential consequences of pleiotropy. Semin Cell Dev Biol, in press (2008 E-pub AOP).
8. McMillan WO, Monteiro A, Kapan DD (2002) Development and evolution on the wing. Trends Ecol Evol 17: 125–133.
9. Beldade P, Brakefield PM, Long AD (2002) Contribution of Distal-less to quantitative variation in butterfly eyespots. Nature 415: 315–318.
10. Kronforst MR, Young LG, Kapan DD, McNeely C, O’Neill RJ, et al. (2006) Linkage of butterfly mate preference and wing color preference cue at the genomic location ofwingless. Proc Natl Acad Sci U S A 103: 6575–6580. 11. Clark R, Brown SM, Collins SC, Jiggins CD, Heckel DG, et al. (2008) Colour
pattern specification in the Mocker swallowtailPapilio dardanus: the transcription factor invected is a candidate for the mimicry locus H. Proc Biol Sci 275: 1181–1188.
12. Joron M, Papa R, Beltran M, Chamberlain N, Mavarez J, et al. (2006) A conserved supergene locus controls colour pattern diversity in Heliconius
butterflies. PLoS Biol 4.
13. Papanicolaou A, Joron M, Mcmillan WO, Blaxter ML, Jiggins CD (2005) Genomic tools and cDNA derived markers for butterflies. Mol Ecol 14: 2883–2897. 14. Beldade P, McMillan WO, Papanicolaou A (2008) Butterfly genomics eclosing.
Heredity 100: 150–157.
15. Beldade P, Rudd S, Gruber JD, Long AD (2006) A wing Expressed Sequence Tag resource forBicyclus anynanabutterflies, an evo-devo model. BMC Genomics 7: 130.
16. Papanicolaou A, Gebauer-Jung S, Blaxter ML, Owen McMillan W, Jiggins CD (2008) ButterflyBase: a platform for lepidopteran genomics. Nucleic Acids Res 36: D582–587.
17. Vera JC, Wheat CW, Fescemyer HW, Frilander MJ, Crawford DL, et al. (2008) Rapid transcriptome characterization for a nonmodel organism using 454 pyrosequencing. Mol Ecol 17: 1636–1647.
18. Jiggins CD, Mavarez J, Beltran M, McMillan WO, Johnston JS, et al. (2005) A genetic linkage map of the mimetic butterflyHeliconius melpomene. Genetics 171: 557–570.
19. Kapan DD, Flanagan NS, Tobler A, Papa R, Reed RD, et al. (2006) Localization of Mu¨llerian mimicry genes on a dense linkage map ofHeliconius erato. Genetics 173: 735–757.
20. van’t Hof AE, Marec F, Saccheri IJ, Brakefield PM, Zwaan B (2008) Cytogenetic characterization and AFLP-based genetic linkage mapping for the butterfly
Bicyclus anynana, covering all 28 karyotyped chromosomes. PLoS ONE, in press. 21. Wang B, Porter AH (2004) An AFLP-based interspecific linkage map of
sympatric, hybridizingColiasbutterflies. Genetics 168: 215–225.
22. Yasukochi Y, Ashakumary LA, Baba K, Yoshido A, Sahara K (2006) A second generation integrated map of the silkworm reveals synteny and conserved gene order between lepidopteran insects. Genetics 173: 1319–1328.
23. Pringle EG, Baxter SW, Webster CL, Papanicolaou A, Lee SF, et al. (2007) Synteny and chromosome evolution in the lepidoptera: evidence from mapping inHeliconius melpomene. Genetics 177: 417–426.
24. Sahara K, Yoshido A, Marec F, Fukova I, Zhang HB, et al. (2007) Conserved synteny of genes between chromosome 15 ofBombyx moriand a chromosome of
Manduca sextashown by five-color BAC-FISH. Genome 50: 1061–1065.
25. Papa R, Morrison CM, Walters JR, Counterman BA, Chen R, et al. (2008) Highly conserved gene order and numerous novel repetitive elements in genomic regions linked to wing pattern variation inHeliconiusbutterflies. BMC Genomics 9: 345.
Krumlauf RE, eds. Emerging Model Organisms: A Laboratory Manual, Volume 1: Cold Spring Harbor Laboratory Press.
27. Saenko SV, French V, Brakefield PM, Beldade P (2008) Conserved developmental processes and the formation of evolutionary novelties: examples from butterfly wings. Philos Trans R Soc Lond B Biol Sci.
28. Monteiro A (2008) Alternative models for the evolution of eyespots and of serial homology on lepidopteran wings. Bioessays 30: 358–366.
29. Beldade P, Brakefield PM, Long AD (2005) Generating phenotypic variation: prospects from ‘‘evo-devo’’ research onBicyclus anynanawing patterns. Evolution & Development 7: 101–107.
30. van’t Hof AE, Zwaan BJ, Saccheri IJ, Daly D, Bot ANM, et al. (2005) Characterization of 28 microsatellite loci for the butterfly Bicyclus anynana. Molecular Ecology Notes 5: 169–172.
31. Long AD, Beldade P, Macdonald SJ (2007) Estimation of population heterozygosity and library construction-induced mutation rate from expressed sequence tag collections. Genetics 176: 711–714.
32. Heckel DG, Gahan LJ, Liu YB, Tabashnik BE (1999) Genetic mapping of resistance toBacillus thuringiensistoxins in diamondback moth using biphasic linkage analysis. Proc Natl Acad Sci U S A 96: 8373–8377.
33. Lander ES, Green P (1987) Construction of multilocus genetic linkage maps in humans. Proc Natl Acad Sci U S A 84: 2363–2367.
34. Yamamoto K, Nohata J, Kadono-Okuda K, Narukawa J, Sasanuma M, et al. (2008) A BAC-based integrated linkage map of the silkwormBombyx mori. Genome Biol 9: R21.
35. Mita K, Kasahara M, Sasaki S, Nagayasu Y, Yamada T, et al. (2004) The genome sequence of silkworm,Bombyx mori. DNA Res 11: 27–35.
36. Xia QY, Zhou ZY, Lu C, Cheng DJ, Dai FY, et al. (2004) A draft sequence for the genome of the domesticated silkworm (Bombyx mori). Science 306: 1937–1940.
37. http://silkworm.genomics.org.cn/.
38. Zdobnov EM, Bork P (2007) Quantification of insect genome divergence. Trends Genet 23: 16–20.
39. Lorkovic Z (1990) The butterfly chromosomes and their application in systematics and phylogeny. In: Kudrna O, ed. Butterflies of Europe Introduction to Lepidopterology. pp 332–396.
40. Brower AVZ (2000) Phylogenetic relationships among the Nymphalidae (Lepidoptera) inferred from partial sequences of thewinglessgene. Proc R Soc Lond Ser B - Biol Sci 267: 1201–1211.
41. Gaunt MW, Miles MA (2002) An insect molecular clock dates the origin of the insects and accords with palaeontological and biogeographic landmarks. Mol Biol Evol 19: 748–761.
42. Vane-Wright D (2004) Entomology - Butterflies at that awkward age. Nature 428: 477–480.
43. Freitas AVL, Brown KS (2004) Phylogeny of the Nymphalidae (Lepidoptera). Syst Biol 53: 363–383.
44. Pena C, Wahlberg N, Weingartner E, Kodandaramaiah U, Nylin S, et al. (2006) Higher level phylogeny of Satyrinae butterflies (Lepidoptera: Nymphalidae) based on DNA sequence data. Mol Phylogenet Evol 40: 29–49.
45. Suomalainen E (1979) Chromosomal evolution of Lepidoptera. Hereditas 91: 316.
46. Robinson R (1971) Lepidoptera Genetics. Oxford, UK: Pergamon Press. 47. Kandul NP, Lukhtanov VA, Pierce NE (2007) Karyotypic diversity and
speciation inAgrodiaetusbutterflies. Evolution Int J Org Evolution 61: 546–559. 48. Schaeffer SW, Bhutkar A, McAllister BF, Matsuda M, Matzkin LM, et al. (2008) Polytene chromosomal maps of 11 Drosophila species: the order of genomic scaffolds inferred from genetic and physical maps. Genetics 179: 1601–1655. 49. Bhutkar A, Schaeffer SW, Russo SM, Xu M, Smith TF, et al. (2008)
Chromosomal rearrangement inferred from comparisons of 12 Drosophila genomes. Genetics 179: 1657–1680.
50. Brunetti CR, Selegue JE, Monteiro A, French V, Brakefield PM, et al. (2001) The generation and diversification of butterfly eyespot color patterns. Curr Biol 11: 1578–1585.
51. Brakefield PM, Gates J, Keys D, Kesbeke F, Wijngaarden PJ, et al. (1996) Development, plasticity and evolution of butterfly wing patterns. Nature 384: 236–242.
52. Monteiro A, Chen B, Scott LC, Vedder L, Prijs HJ, et al. (2007) The combined effect of two mutations that alter serially homologous color pattern elements on the fore and hindwings of a butterfly. BMC Genet 8: 22.
53. Kronforst MR, Kapan DD, Gilbert LE (2006) Parallel genetic architecture of parallel adaptive radiations in mimetic Heliconius butterflies. Genetics 174: 535–539.
54. Engstrom PG, Ho Sui SJ, Drivenes O, Becker TS, Lenhard B (2007) Genomic regulatory blocks underlie extensive microsynteny conservation in insects. Genome Res 17: 1898–1908.
55. http://scgc.genetics.ucla.edu/.
56. Oliphant A, Barker DL, Stuelpnagel JR, Chee MS (2002) BeadArray technology: enabling an accurate, cost-effective approach to high-throughput genotyping. Biotechniques Suppl: 56–58, 60–51.
57. Beldade P, French V, Brakefield PM (2008) Developmental and genetic mechanisms for evolutionary diversification of serial repeats: eyespot size in
Bicyclus anynanabutterflies. J Exp Zoolog B Mol Dev Evol 310: 191–201. 58. Monteiro A, Glaser G, Stockslager S, Glansdorp N, Ramos D (2006)
Comparative insights into questions of lepidopteran wing pattern homology. BMC Dev Biol 6: 52.
59. Voorrips RE (2002) MapChart: software for the graphical presentation of linkage maps and QTLs. J Hered 93: 77–78.
60. Brakefield PM (1998) The evolution-development interface and advances with the eyespot patterns ofBicyclusbutterflies. Heredity 80: 265–272.