A methodological approach for the construction of a radiation hybrid map
of bovine chromosome 5
M. De Donato
1,2*, R.A. Brenneman
1,3*, D.M. Stelly
5, J.E. Womack
5and J.F. Taylor
1,61
Texas A&M University, Department of Animal Science, College Station, USA.
2
Present address: Departamento de Biomedicina, IIBCA, Universidad de Oriente, Venezuela.
3
Present address: Omaha’s Henry Doorly Zoo, Omaha, USA.
4
Laboratory of Plant Molecular Cytogenetics, Department of Soil and Crop Sciences, Texas A&M
University, College Station, USA.
5
Laboratory of Genetics, Department of Veterinary Pathobiology, Texas A&M University,
College Station, USA.
6
Present address: University of Missouri, Campus Drive, Columbia, USA.
Abstract
A bovine 5,000 rad WG-RH panel was used to construct an RH map of bovine chromosome 5 (BTA5). Twenty-one microsatellites and thirteen genes were scored in the panel using PAGE and radioactive labeling. Marker retention ranged from 8.9%-25.8% and averaged 17.8%. Pairwise locus analysis placed all markers in a single syntenic group with a LOD support of 4.0. At a LOD support of 8.0, a centromeric group of 23 syntenic markers was formed. Telomeric groups of 11 and 9 markers were assembled with a LOD support of 6.0 and 8.0, respectively. All markers were ordered by maximum likelihood methods using the program RHMAP. Only 13 markers were ordered with a LOD support of at least 3.0, while 25 and 29 markers were ordered with a support of at least 2.0 and 1.0, respectively. Total length of the comprehensive RH map was 435.9 cR5,000, with an average marker separation of 12.8 cR5,000. The
largest gaps in the map were 55.0 and 30.4 cR5,000in length. The locus orders of markers common to both the RH map
and the USDA-MARC linkage map were identical. The relationship between the RH and linkage maps was calculated to be 3.74 cR5,000/cM.
Key words:RH map, bovine, gene mapping.
Received: March 7, 2003; Accepted: August 6, 2003.
Introduction
Radiation hybrid (RH) mapping is a modification of the somatic cell hybrid mapping technique that can resolve the location of genes to very small chromosomal segments. RH mapping utilizes variation between two species that are genetically more distant than those used in intra/inter-specific crosses. In contrast to linkage mapping, RH map-ping does not depend on the intraspecies polymorphism of markers or their segregation within a pedigree structure to map genes, but is based on the random retention of unse-lected donor genome fragments as insertions, transloca-tions, and/or microchromosomes within hybrid cell lines.
Distance within a RH map is measured in centiRays (cR) and depends on the radiation dosage used to fragment the
donor genome. A distance of one cR5,000between two
mark-ers, for example, corresponds to a 1% frequency of break-age between the markers within the hybrid cell line panel, after exposure of the donor genome to an X-radiation
dos-age of 5,000 rads (McCarthyet al., 1997). Because the
fre-quency of breakage can be made high according to the radiation dosage applied, whole-genome RH mapping can produce high-resolution maps using a relatively small number of cell lines. For a linkage mapping study to obtain a similar resolution, a very large mapping population would be re-quired.
The whole-genome radiation hybrid method was cre-ated by irradiating human cells and fusing them to mouse
cells (Walteret al., 1994). Panels of human RHs provided a
useful tool for high-resolution mapping of the human ge-nome, being effectively utilized to integrate linkage and physical maps, to anchor or order large insert contigs, and to construct EST maps that currently contain more than
30,000 human genes (Deloukaset al., 1998).
www.sbg.org.br
Send correspondence to Marcos De Donato. Universidad de Oriente, Departamento de Biomedicina, IIBCA, Cerro del Medio, Cumana 6101, Venezuela. E-mail: [email protected]. *These au-thors contributed equally to this work.
However, RH mapping has not been effectively used
in other mammalian species, except for mouse (Schmittet
al., 1996; McCarthyet al., 1997), until a whole-genome
ra-diation hybrid panel (RHA) was constructed by Womacket
al. (1997) in cattle, using an X-radiation dosage of 5,000
rads. Recently, a high-dose radiation panel (12,000 rads,
BovR12) has been constructed in cattle (Rexroadet al.,
2000), and radiation panels also exist for rat (McCarthyet
al., 2000), dog (Priat et al., 1998), cat (Murphy et al.,
1999), pig (Yerleet al., 1998; Hawkenet al., 1999), and
zebrafish (Hukriedeet al., 1999).
Individual RH maps of BTA1, BTA5, BTA7, BTA13, BTA15, BTA18, BTA19, BTA23, BTA27,
BTA29, and BTAX have been published (Schläpferet al.,
1997; Bandet al., 1998; Yanget al., 1998; Guet al., 1999;
Rexroadet al., 1999, 2000; Amaranteet al., 2000; Bandet
al., 2000; Ozawaet al., 2000; Amaralet al., 2002; Ashwell
et al., 2002; Goldammeret al., 2002). Additionally, a first generation whole-genome cattle RH map has also been
published (Bandet al. 2000; http://cagst.animal.uiuc.edu).
Although this genome-wide RH map still contains gaps on many of the chromosomes, it represents a great advance-ment for the developadvance-ment of comparative maps, because it includes a large number of type I markers. However its util-ity will be subject to the establishment of the correct gene order in each map.
The objective of this study was to further develop the radiation hybrid map of BTA5 as a resource for gene map-ping and cloning of economic trait loci on BTA5. For this purpose, 21 microsatellites and 13 genes located on BTA5 were scored in the bovine RHA panel. Fourteen of the markers reported here were not included in the map
con-structed by Bandet al. (2000), including 5 genes that have
not been mapped previously.
Materials and Methods
Scoring of markers
The 5,000-rad radiation hybrid panel (RHA, Womack
et al., 1997), currently consisting of 90 individual cell lines, was used to develop a radiation hybrid map of BTA5. The map was constructed scoring eighteen microsatellites taken from the USDA Meat Animal Research Center (MARC,
Kappeset al., 1997) linkage map, and three microsatellites
derived from other maps. Primer information is available at
http://SOL.MARC.USDA.GOV/, except for PZB2F
(Seneseet al., 1997), RM154 (Kossareket al., 1996), and
TEXAN15 (Burnset al., 1995). Additionally, 13 genes,
with known human homologs, were scored on the panel (Table 1). The markers were cold-tested using the standard bovine cell line JEW38 DNA (50 ng) and the standard ham-ster cell line A23 DNA (50 ng), both used in the construc-tion of the RHA panel.
To obtain a higher resolution for genotype identifica-tion, all of the genotyping was performed using “hot” PCR.
For this, each forward primer was end-labeled with 32P
(NEN) using T4 Polynucleotide Kinase (Promega,
Madi-son, WI). All PCR was performed in a 30µL volume
con-taining panel DNA (50-100 ng), 200µM dNTPs, 0.75 mM
-3 mM of magnesium chloride, 1X Taq reaction buffer,
1.0 U ofTaqDNA polymerase, 0.1-0.7µM32P-labeled
for-ward and unlabeled reverse primers.
Most PCR products were run in 4.5 to 6.7% denatur-ing polyacrylamide gels containdenatur-ing 8 M urea, for 2.5 to 24 h at 15 to 50 W, depending on the size of the product. After electrophoresis, gels were blotted onto 3M filter paper, dried and exposed to X-ray film for 20 h to 10 days, de-pending on the radiation intensity of the PCR products as measured by a Geiger counter.
Due to the similarity in size of the amplified bovine and hamster PCR products or due to the presence of multi-ple bands, the loci CYP2D6, BM321, GAPD, MB, SP1 and TRA1 were run as single-strand conformational poly-morphisms (SSCP) using 0.5-0.67X MDE gels (FMC Bio-products). PCR products were electrophoresed at 5 W for 12 to 20 h, depending on the size of the products.
In addition to the genes reported here, we attempted to score the genes HOXC4 and PAH using previously
pub-lished primers (Lyonset al., 1997), and LYZ, using primers
designed from a publicly available bovine sequence (GenBank Accession No. M26242). However, these prim-ers amplified hamster fragments of about the same size and, since the fragments were greater than 700 bp, it was not possible to use the SSCP approach to resolve the sequence identities, even though the bovine fragments were preferen-tially amplified, yielding stronger bands than the hamster bands when resolved in a polyacrylamide gel. The same sit-uation occurred for MGF, however, an internal primer was designed from the partial sequence of the long fragment and, when used as the reverse primer, resulted in the ampli-fication of species-specific fragments, with a bovine frag-ment of about 250 bp, and a larger mouse fragfrag-ment.
Methodological approach
Most markers were run twice to detect ambiguous re-sults. The autoradiographs were independently scored by two people, who assigned genotypes of present (+), absent (-) or ambiguous (?). Differences between scores were usu-ally resolved by simultaneous rescoring of the autoradio-graphs. Unresolved differences were entered as ambiguous scores.
The RHMAP program package Version 3.0
(Boehnkeet al., 1991; Langeet al., 1995) was used to
First, RH2PT was used to calculate, by maximum likelihood, the LOD score support for the pairwise associa-tion of markers. Groups of loci that showed linkage at odds of more than 1,000:1 were subsequently ordered by maxi-mum likelihood, using the program RHMAXLIK. The op-tions specifying an equal retention probability model and the machine-generated order for adding loci, rather than the user-generated order, were used.
Three approaches were used to determine the prelimi-nary best order of loci to minimize computing time. First, the stepwise option was used for building locus orders in-cluding all the loci that showed linkage at a LOD score of 3.00. This option allows the determination of overall locus order, one locus at a time, but retains only those partial or-ders which are within a user-specified LOD score
(SAVMAX) of the current best partial order (Boehnkeet
al., 1991). In general, this approach considers many fewer
partial orders at the risk of missing the overall best order, but considerably reduces the required computing time. Larger values of SAVMAX increase the chance of identify-ing the best overall order, but imply a heavier computa-tional burden.
The second employed approach utilized the branch and bound option, with groups of 14 markers at a time. The
runs were initiated with the 14 most centromeric markers, with a moving frame of one marker towards the telomere for each subsequent analysis, and using the best locus order obtained in the stepwise approach. This method identifies early in the process a candidate order that is optimal, or nearly so, and eliminates solutions that are inferior either to the candidate order or to better orders subsequently en-countered. However, the number of orders evaluated scales exponentially with the number of loci to be ordered, and is computationally prohibitive when all markers are simulta-neously analyzed. With a large number of loci, the ap-proach of partial runs with a sliding frame makes the analysis manageable.
The third approach was to analyze, with the stepwise option and no LOD support restriction, maps with all but one marker, deleting each marker one at a time, in order to identify problematic and/or the most influential markers for specific orders.
When the best order was obtained, the scoring data were rearranged according to the locus order, and a reevalu-ation of the scoring was performed. All of the scores which produced fragments containing only a single marker, as well as fragments containing the scores +-+, +?+ and ++?, were reexamined on the autoradiographs. The scoring of
Table 1- Genes and primer information for the type I loci scored in the RH map of BTA5. Gene symbols are in accordance with the Human Gene
Nomenclature database. Product sizes are approximate. The species and GenBank accession numbers of the sequences used for designing the primers used in this study are shown in the source column.
Symbol Gene name Annealing T °C
Product size bp
Primer Sequences Source
COL2A1 Collagen, type II, alpha 1 chain 60 600 TGGTGGAGCAGCAAGAGC
CCTTCTTGAGGTTGCCAGC
Lyonset al.,1997
CYP2D6 Cytochrome P450 subfamily
IID
60 600 CGGAGGATGGGCTGAAGGAA TCGGGGTGGCTGGGTCG
Bovine: X68481
GAPD Glyceraldehyde-3-dehydrogenase
60 400 AAGGCAGAGAACGGGAAGC GGGGGCATCGGCAGAAGGT
Bovine: U85042
HMOX1 Heme oxydase 58 400 GGAGGAGGAGATTGAGCACAACA
AGCGGTACAGCTGCTTGAACTTG
Jianget al.,1998
IFNG Interferon gamma 50 300 TCCTGCCTACAATATTTGAATTT CATTGTATCATCAAGTGAAATAA
Lyonset al., 1997
IGF1 Insulin-like growth factor 1 48 130 AGGAGGGAGTGCAGGAAACAAGAAC CAAGCCTGCTGAATGAATGTCTCTA
Bovine: M22044
IGFBP6 Insulin-like growth factor
bind-ing protein 6
60 450 GGAGAGAATCCCAAGGAGAG AGAAGCCCCTATGGTCACA
Human: M69055
MB Myoglobin 60 100 GCCAAGCATCCTTCAGACTT
GGAAGCCCAGCACCTTGTAC
Bovine: D00409
MGF Mast cell growth factor (stem cell factor)
54 800,
250
ATCCATTGATGCCTTCAAGG CTGTCATTCCTAAGGGAGCTG
CATGCCACTGATATTTGCTTTT
Lyonset al., 1997
This study
MYF5 Myogenic factor 5 55 250 GCCCACCCCTTGCCTCTCTG CGCCTTCCGCCGATCCAT
Bovine: M95684
SLC2A3 Solute carrier family 2 (glucose
transporter protein), member 3
57 250 GATGAACCTGCTGGCCTTCATATC CTGGGCGATGAGGATGCC
Jianget al.,1998
SP1 Transcription factor SP1 50 250 CAGCAGGTGGAGAAGGAGAGAA GGGAACTCAGGGCAGGCAAAT
Human: J03133
TRA1 Tumor rejection antigen 1 (GP96)
57 300 TCCGTAAAACTCTGGACATGATC CCAGCCATGAAGTAGATTTTGTC
the most influential hybrid cell lines for the best and next-to-the-best orders was also reexamined.
Results
Twenty-one microsatellite markers and 13 genes with known human homologs were scored on the bovine RHA panel. Here we report the assignment and ordering of 7 microsatellite markers and 7 genes not included in the RH
map constructed by Bandet al. (2000). Of these markers,
only CSSM22, SLC2A3, and CYP2D6 have previously
been scored in the RHA panel (Barendseet al., 2000), but a
definitive order was not established. Mapping of the genes MGF, IGFBP6, TRA1, HMOX1, and GAPD is first re-ported in this study. These genes have well characterized human and mouse homologs that will expand the compara-tive maps among these species.
The percentage of radiation hybrid lines definitively typed (+ or -) ranged from 95.6 to 100%, with an average of 99.1% (Tables 2 and 3). Of the 90 hybrid lines in the RHA panel, 52.2% were informative for the scored markers, 45.6% retained none of the markers, and 2 hybrids retained all of the scored markers, although one had one untyped
Table 2- Features of the RH map of BTA5. The percentage of lines typed is for the lines with + or - scores. Linkage groups formed in the 2-point analysis
at different LOD supports are represented by bars. The position of the markers is according to the order in the comprehensive map, which represents the most likely marker order obtained with no LOD support restriction.
Marker Percentage typed
Percentage retained
Linkage groups (LOD) Comprehensive map position
LOD support 4.00 6.00 8.00
ILSTS042 98.9 22.5 0 >3.0
BM6026 98.9 21.3 4.1 <1.0
MYF5 97.8 20.5 19.7 >2.0
BP1 98.9 21.3 27.5 >2.0
MGF 95.6 19.8 43.1 >3.0
BL23 96.7 21.8 46.6 >2.0
IGFBP6 98.9 23.6 60.5 >3.0
BM321 98.9 22.5 64.4 >2.0
SP1 100.0 22.2 64.4 >2.0
CSSM34 97.8 19.3 67.7 >3.0
C0L2A1 97.8 20.5 67.7 >3.0
IFNG 100.0 17.8 94.8 >3.0
RM500 100.0 16.7 114.4 >3.0
BMS490 100.0 16.7 129.9 >1.0
ETH10 100.0 20.0 148.9 >3.0
RM154 100.0 16.7 167.9 >3.0
CSSM22 100.0 14.4 175.5 >3.0
IGF1 98.9 14.6 192.0 >2.0
TRA1 100.0 14.4 199.8 >3.0
HMOX1 100.0 14.4 216.3 >3.0
MB 100.0 15.6 220.1 >1.0
TEXAN15 100.0 17.8 227.5 <1.0
BM1819 98.9 16.9 227.5 <1.0
BMS1248 100.0 12.2 282.5 >2.0
BM8230 100.0 10.0 300.4 >2.0
BM315 100.0 8.9 325.1 <1.0
SLC2A3 95.6 10.5 330.9 >3.0
PZB2F 100.0 13.3 342.2 >1.0
JAB2 100.0 13.3 359.1 >2.0
GAPD 100.0 13.3 359.1 >2.0
MAF48 100.0 16.7 379.8 >2.0
ETH152 97.8 24.7 410.1 >1.0
CYP2D6 98.9 24.7 420.9 >2.0
BM8126 98.9 25.8 435.9 >1.0
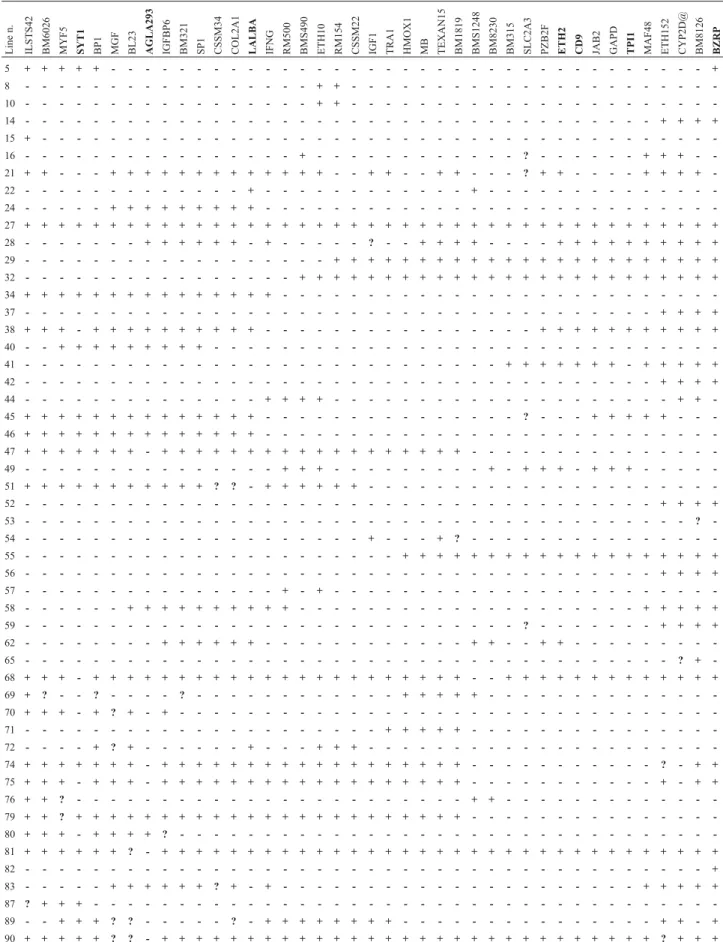
Table 3- Scoring data for the informative cell lines for the markers used in the construction of the RH map of BTA5. Loci are placed according to their most likely order determined by maximum likelihood methods. Hybrid cell lines for which all markers were absent are not shown. Boldface markers were scored by Barendseet al. (2000).
Line
n.
ILSTS42 BM6026 MYF5 SYT1 BP1 MGF BL23 AGLA293 IGFBP6 BM321 SP1 CSSM34 COL2A1 LALBA IFNG RM500 BMS490 ETH10 RM154 CSSM22 IGF1 TRA1 HMOX1 MB TEXAN15 BM1819 BMS1248 BM8230 BM315 SLC2A3 PZB2F ETH2 CD9 JAB2 GAPD TPI1 MAF48 ETH152 CYP2D@ BM8126 BZRP
5 + + + + + - - - - - - - - - - - - - - - - - - - - - - - - - - - - - - - - - - - +
8 - - - - - - - - - - - - - - - - - + + - - - - - - - - - - - - - - - - - - - - -
-10 - - - - - - - - - - - - - - - - - + + - - - - - - - - - - - - - - - - - - - - -
-14 - - - - - - - - - - - - - - - - - - - - - - - - - - - - - - - - - - - - - + + + +
15 + - - - - - - - - - - - - - - - - - - - - - - - - - - - - - - - - - - - - - - -
-16 - - - - - - - - - - - - - - - - + - - - - - - - - - - - - ? - - - - - - + + + -
-21 + + - - - + + + + + + + + + + + + + - - + + - - + + - - - ? + + - - - - + + + +
-22 - - - - - - - - - - - - - + - - - - - - - - - - - - + - - - - - - - - - - - - -
-24 - - - - - + + + + + + + + + - - - - - - - - - - - - - - - - - - - - - - - - - -
-27 + + + + + + + + + + + + + + + + + + + + + + + + + + + + + + + + + + + + + + + + +
28 - - - - - - - + + + + + + - + - - - - - ? - - + + + + - - - - + + + + + + + + + +
29 - - - - - - - - - - - - - - - - - - + + + + + + + + + + + + + + + + + + + + + + +
32 - - - - - - - - - - - - - - - - + + + + + + + + + + + + + + + + + + + + + + + + +
34 + + + + + + + + + + + + + + + - - - - - - - - - - - - - - - - - - - - - - - - -
-37 - - - - - - - - - - - - - - - - - - - - - - - - - - - - - - - - - - - - - + + + +
38 + + + - + + + + + + + + + + - - - - - - - - - - - - - - - - + + + + + + + + + + +
40 - - + + + + + + + + + - - - - - - - - - - - - - - - - - - - - - - - - - - - - -
-41 - - - - - - - - - - - - - - - - - - - - - - - - - - - - + + + + + + + - + + + + +
42 - - - - - - - - - - - - - - - - - - - - - - - - - - - - - - - - - - - - - + + + +
44 - - - - - - - - - - - - - - + + + + - - - - - - - - - - - - - - - - - - - - + +
-45 + + + + + + + + + + + + + + - - - - - - - - - - - - - - - ? - - - + + + + + - -
-46 + + + + + + + + + + + + + + - - - - - - - - - - - - - - - - - - - - - - - - - -
-47 + + + + + + + - + + + + + + + + + + + + + + + + + + - - - - - - - - - - - - - -
-49 - - - - - - - - - - - - - - - + + + - - - - - - - - - + - + + + - + + + - - - -
-51 + + + + + + + + + + + ? ? - + + + + + + - - - - - - - - - - - - - - - - - - - -
-52 - - - - - - - - - - - - - - - - - - - - - - - - - - - - - - - - - - - - - + + + +
53 - - - - - - - - - - - - - - - - - - - - - - - - - - - - - - - - - - - - - - - ?
-54 - - - - - - - - - - - - - - - - - - - - + - - - + ? - - - - - - - - - - - - - -
-55 - - - - - - - - - - - - - - - - - - - - - - + + + + + + + + + + + + + + + + + + +
56 - - - - - - - - - - - - - - - - - - - - - - - - - - - - - - - - - - - - - + + + +
57 - - - - - - - - - - - - - - - + - + - - - - - - - - - - - - - - - - - - - - - -
-58 - - - - - - + + + + + + + + + + - - - - - - - - - - - - - - - - - - - - + + + + +
59 - - - - - - - - - - - - - - - - - - - - - - - - - - - - - ? - - - - - - - + + + +
62 - - - - - - - - + + + + + + - - - - - - - - - - - - + + - - + + - - - - - - - -
-65 - - - - - - - - - - - - - - - - - - - - - - - - - - - - - - - - - - - - - - ? +
-68 + + + - + + + + + + + + + + + + + + + + + + + + + + - - + + + + + + + + + + + + +
69 + ? - - ? - - - - ? - - - - - - - - - - - - + + + + + - - - - - - - - - - - - -
-70 + + + - + ? + - + - - - - - - - - - - - - - - - - - - - - - - - - - - - - - - -
-71 - - - - - - - - - - - - - - - - - - - - - + + + + + - - - - - - - - - - - - - -
-72 - - - - + ? + - - - - - - + - - - + + + - - - - - - - - - - - - - - - - - - - -
-74 + + + + + + + - + + + + + + + + + + + + + + + + + + - - - - - - - - - - - ? - + +
75 + + + - + + + - + + + + + + + + + + + + + + + + + + - - - - - - - - - - - + - + +
76 + + ? - - - - - - - - - - - - - - - - - - - - - - - + + - - - - - - - - - - - -
-79 + + ? + + + + + + + + + + + + + + + + + + + + + + + - - - - - - - - - - - - - -
-80 + + + - + + + + ? - - - - - - - - - - - - - - - - - - - - - - - - - - - - - - -
-81 + + + + + + ? - + + + + + + + + + + + + + + + + + + + + + + + + + + + + + + + + +
82 - - - - - - - - - - - - - - - - - - - - - - - - - - - - - - - - - - - - - - - - +
83 - - - - - + + + + + + ? + - + - - - - - - - - - - - - - - - - - - - - - + + + + +
87 ? + + + - - - - - - - - - - - - - - - - - - - - - - - - - - - - - - - - - - - -
-89 - - + + + ? ? - - - - - ? - + + + + + + + + - - - - - - - - - - - - - - - + + - +
marker. Marker retention ranged from 8.9% for BM8230 to 25.8% for BM8126, with an average retention frequency of 17.8% (Table 2).
Using a likelihood ratio test, the hypothesis that reten-tion frequencies were equal for each marker could not be
rejected (χ233= 41.5; p 0.10). However, the average
reten-tion frequencies were 21.4% for the sub-centromeric (ILSTS042-COL2A1), 16.3% for the proximal interstitial
(IFNG-HMOX1), 11.6% for the distal interstitial
(BMS1248-GAPD), and 23.0% for the telomeric
(ETH152-BM8126) chromosomal regions. Four pairs of markers possessed identical retention patterns in the panel (BM321-SP1, CSSM34-COL2A1, BM1819-TEXAN15 and JAB2-GAPD), making it impossible to determine the order of each of the markers in the pair.
Pairwise analysis placed all of the markers within a single linkage group at a LOD support of 4.0 (Table 2). At a LOD support of 6.0, two linkage groups were formed, a centromeric group containing 23 markers and a telomeric group containing 11 markers. The centromeric group re-mained associated when the LOD support was increased to 8.0, but only 9 of the telomeric markers remained associ-ated.
Analysis of the data using the stepwise option of RHMAXLIK ordered all of the markers unambiguously, except for the four unresolved pairs. Greater values of SAVMAX (6.0 and 9.0) provided identical orders, suggest-ing that the detected order was optimal. The next best
or-ders produced a change in marker order from
BM315-SLC2A3-PZB2F to PZB2F-SLC2A3-BM315 or PZB2F-BM315-SLC2A3. All other marker orders
pro-duced Log10likelihood values substantially different from
these orders.
The comprehensive map showing the most likely marker order (Table 2, Figure 1b) spanned 435.9 cR5,000, calculated using the stepwise option. This order requires
110 breaks among the markers and has a Log10likelihood
value of -195.5. The average distance between markers was
12.8 cR5,000, and the major gaps were 55.0 cR5,000between
HMOX1 and BMS1248, and 30.4 cR5,000between MAF48
and ETH152; no other gaps longer than 27.1 cR5,000were
found. Thirteen markers were ordered with a LOD support of at least 3.00, while 25 and 29 markers were ordered with a LOD support of at least 2.00 and 1.00, respectively.
The approach of ordering the markers using the branch and bound option, for the analysis of partial maps of 14 markers at one time, revealed the same order, with some exceptions. Running the partial maps containing the mark-ers in the 14 marker frame RM500-BM315 and the 5 subse-quent frames to IGF1-MAF48 produced some changes in the marker order. The order of the segment TRA1-BM1819 was changed to TRA1-IGF1-TEXAN15-BM1819-MB-HMOX1 in all 6 frames. Additionally, the order of markers in the segment BMS1248-MAF48 was changed. This re-flects the low retention frequencies of the markers in the
in-terval from BM1819 to SLC2A3, which resulted in the for-mation of the two strongly supported centromeric and telomeric groups divided by this interval.
The approach of ordering the markers using the step-wise option and deleting one marker at a time led to similar conclusions. The elimination of the markers TRA1, HMOX1, TEXAN15 or BMS1248 produced the order TRA1-IGF1-TEXAN15-BM1819-MB-HMOX1, as previ-ously detected. In addition, the elimination of BM315 and BM8126 inverted the order of the marker pairs PZB2F-SLC2A3 and CYP2D6-ETH152, respectively.
The retention data for the most likely order of mark-ers indicated that there were 79 BTA5 fragments retained in the panel (Table 3). Fifteen (19.0%) fragments contained only one marker, and 13 (16.5%) contained two markers. Thirty-two (40.5%) of the fragments contained at least 5 markers. In this calculation of the number of fragments, the ambiguous data were reassigned to be + or - depending on position, according to the following rules: +?+ = +++, -?- = —-, and +?- = +—. The average size of the BTA5 frag-ments in the panel for this chromosome was estimated to be 1.7 Mb.
Discussion
The average marker retention frequency for BTA5 was much lower than has been observed for most chromo-somes (Table 4), except for BTA2, BTA7 and BTA15 (BTAX was lower, but was also present in only one copy, since the library was developed from a male cell line). The average retention for the markers used in the previously
published RH maps of BTA5 were similar (Band et al.,
2000; Barendseet al., 2000; Ozawaet al., 2000).
The average retention for the more than 1000 markers
scored by Bandet al. (2000) in their bovine chromosome
maps was higher (22.4%) than the average for BTA5. These authors found evidence for wide variation in marker retention rates from one chromosome to another, ranging from 14.4% for BTA27 to 34.3% for BTA28 (BTA19 which harbored the selectable marker possessed an average marker retention of 45.3%). There appears to be a tendency for the smaller chromosomes to have higher retention rates than the larger chromosomes. Wide variation in the average retention of markers has also been found among human
chromosomes (Gyapayet al., 1996), ranging from 21.1 to
61.6%, with an average of 29.2%, murine chromosomes
(Van Ettenet al., 1999), ranging from 23.4 to 37.9, with an
average of 30%, and canine chromosomes (Priat et al.,
1998).
The variation found in retention rate among BTA5
markers was also found in the map of Bandet al., showing
the same patterns for the centromeric, interstitial and telomeric segments. A higher retention among centromeric
markers was also reported for BTA23 (Bandet al., 1998),
while it was less evident for BTA13 (Schläpfer et al.,
where a higher retention was observed for interstitial mark-ers. An increase in retention frequency at the centromere has also been documented for many human chromosomes
(Jameset al. 1994; Stewartet al., 1997), but not for murine
chromosomes (McCarthyet al., 1997).
The stepwise option for building locus orders pro-duced the marker order with the highest likelihood. Even though this approach may miss the global best order, this risk is greatly reduced when there is prior knowledge of or-der on many of the markers. In this case, many of the mark-ers have previously been ordered in linkage maps, providing an approximate order for the initial map. How-ever, when there is no prior knowledge of order, this ap-proach should be used with caution, reevaluating the resulting orders against other approaches.
When using the branch and bound algorithm for 14 marker frames, most partial locus orders agreed with the or-der found for the previous frame. The consensus oror-der of loci from this analysis was identical to the order obtained using the stepwise option. This approach was particularly valuable for identifying weaknesses in the map where es-tablishing a robust marker order may be problematic. For example, we found that the order of markers in the segment IGF1-BM1819 was significantly affected by the more centromeric or telomeric markers, which oriented the
seg-ment. Similarly, the presence of ETH152 oriented the segment BMS1248-MAF48.
Using this approach, the segment IGF1-BM1819 could not be ordered unambiguously. The most important
indicators of the most likely order were the Log10
likeli-hood value, the number of breaks and the map size. Order
changes that substantially decreased the Log10likelihood
value, increased the number of breaks or the size of the map were indications of an incorrect locus order.
Analysis of the data using these approaches revealed two small chromosomal regions harboring the segments IGF1-BM1819 and BM315-PZB2F in which establishing marker order was problematic. These segments are located in the chromosome region possessing the lowest marker re-tention. However, since there was agreement among the marker orders generated under each of the approaches, the best marker order shown here (Table 2, Figure 1b) is thought to be the best order obtainable.
One possibility for solving the problems identified in this map could be the addition of markers that fall within these regions, especially those which have been included in other maps and for which there is a prior knowledge of cor-rect ordering with respect to the other markers present. On the other hand, this approach may very well result in the production of sets of markers with identical retention pat-terns, due to the low marker retention frequencies in these
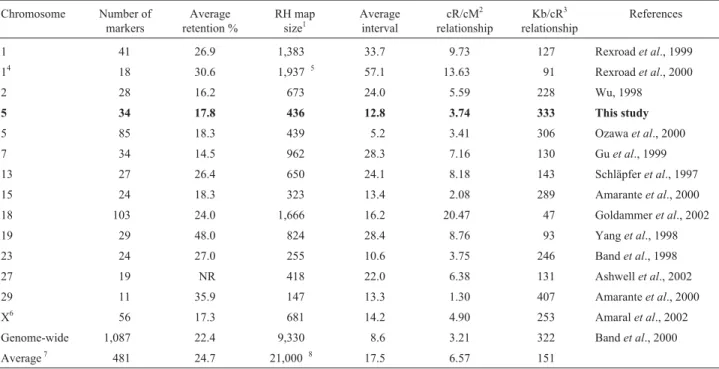
Table 4- Comparison of RH maps from several bovine chromosomes, constructed using the RHA panel.
Chromosome Number of markers
Average retention %
RH map size1
Average interval
cR/cM2 relationship
Kb/cR3 relationship
References
1 41 26.9 1,383 33.7 9.73 127 Rexroadet al., 1999
14 18 30.6 1,937*5 57.1 13.63 91 Rexroadet al., 2000
2 28 16.2 673 24.0 5.59 228 Wu, 1998
5 34 17.8 436 12.8 3.74 333 This study
5 85 18.3 439 5.2 3.41 306 Ozawaet al., 2000
7 34 14.5 962 28.3 7.16 130 Guet al., 1999
13 27 26.4 650 24.1 8.18 143 Schläpferet al., 1997
15 24 18.3 323 13.4 2.08 289 Amaranteet al., 2000
18 103 24.0 1,666 16.2 20.47 47 Goldammeret al., 2002
19 29 48.0 824 28.4 8.76 93 Yanget al., 1998
23 24 27.0 255 10.6 3.75 246 Bandet al., 1998
27 19 NR 418 22.0 6.38 131 Ashwellet al., 2002
29 11 35.9 147 13.3 1.30 407 Amaranteet al., 2000
X6 56 17.3 681 14.2 4.90 253 Amaralet al., 2002
Genome-wide 1,087 22.4 9,330 8.6 3.21 322 Bandet al., 2000
Average7 481 24.7 21,000*8 17.5 6.57 151
1
regions. Since there are few fragments present that contain the problematic region, a better approach would be to score these markers in another panel, such as the BovR12, or to use additional mapping techniques, such as linkage
map-ping,in situhybridization and contig construction, to
estab-lish the correct marker order.
The RH map of BTA5 (Figure 1) revealed no differ-ence in marker order with the MARC linkage map or the
RH maps published by Ozawaet al. (2000) and Bandet al.
(2000). However, these previously published maps show some order differences with the linkage map, within the segments MYF5-BMS610 and BM2830-ETH152.
The size of the RH map of BTA5 is 8.7% larger than
the map of Bandet al. (2000). This could be due to the
dif-ferent software packages used to construct each map, which employ different algorithms to calculate marker order and distances. However, there might be another explanation, since there are regions of larger as well as smaller sizes for the markers common to our map (Figure 1). For example, the distance between ILSTS042 and BM6026 is larger in
the Bandet al. map than in ours, while the distance between
BM6026 and MYF5 is smaller. Consequently, in their map, the regions BL23-IFNG and MAF48-ETH152 are larger, but the region IFNG-MAF48 is significantly smaller than in our map.
Even though the retention frequencies among the three BTA5 maps are similar, there are some significant differences, in particular, the average retention frequencies of the common markers are slightly higher than obtained here. Significant differences were seen between the
Barendse et al. map and ours for the markers BM6026
(lower than our retention), CSSM22 (higher), ETH152
(higher) and CYP2D (lower), and between the Bandet al.
and our map for MYF5 (higher), IFNG (lower), BM8230 (higher) and ETH152 (higher). In addition, the markers CSSM34 and COL2A1 were not ordered in our map be-cause they possessed identical retention patterns, however,
they were ordered in the Bandet al. map, at a distance of
about 7.5 cR5,000. Thus, it is very likely that the differences in marker distances among the maps can be attributed to differences in the scoring of the markers.
We considered the use of radioactively labeled PCR and polyacrylamide gel electrophoresis to be a very sensi-tive technique that could identify spurious bands that were close to, but not of the same size as, the target PCR amplifi-cation fragment, and resolve a weak radiographic signal that could not be detected by ethidium bromide staining. In this sense, the scoring performed with ethidium bromide staining would be more prone to errors than the method we used to score our markers.
The physical-linkage relationship between our RH
and the MARC linkage map (Kappeset al., 1997) was
esti-mated to be 3.81 cR5,000/cM, calculated by dividing the RH map distance by the linkage map distance between the markers BM6026 and BM8126. Additionally, the
esti-mated relationship between the RH map and the chromo-some size of 134.4 Mb (based on a genome size of 3,000 Mb and the estimated chromosome size of 4.48% by
Popescuet al., 1996) was estimated to be 333 kb/cR5,000
(assuming an increase in size of 8.7% from the Bandet al.
map of 439 cR5,000). The cR/cM relationship between the centromeric markers tended to be smaller than for the telomeric markers, but varied greatly. When analyzing the resolution of both the linkage and the radiation hybrid maps, no definitive conclusions could be made. For exam-ple, the markers MYF5 and BP1, as well as BMS1248 and BM8230, were not resolved in the MARC linkage map, but were resolved in the RH map presented here and in the Band et al. map; however, the markers TEXAN15 and BM1819, and JAB2 and GAPD were resolved in the TEXAN linkage map (Jeremy F. Taylor and Scott K. Davis, unpublished results), but not in our RH map. Similarly, the markers BM315 and BMS1658, and BM2830 and MAF48 were resolved in the MARC linkage map, but not in the Bandet al. RH map.
The ordering in the Barendseet al. (2000) map
dif-fered for several of the markers included in our and in the Bandet al. (2000) maps. There was not a high support for
locus ordering in the Barendseet al. (2000) map,
suggest-ing that their locus order is not correct. We utilized the
Barendseet al.scoring data for the markers not scored here
to determine their position within our map. For this pur-pose, each marker was sequentially added to the map, and
the Log10likelihood value, the number of breaks and map
size were calculated (Table 5). Introducing the markers AGLA293, SYT1, LALBA and BZRP into our map pro-duced major rearrangements, significantly increasing the number of breaks and the map length. Only introduction of the markers ETH2, CD9 and TPI1 produced modest
de-creases in the Log10likelihood, increases in the number of
breaks and also of map length with no major rearrange-ments in the locus order. An analysis of the map including all three markers produced rearrangements in the segment BM315-GAPD/JAB2. When all three markers were in-cluded, the order of the original markers was maintained, but the map size increased (11.7%, Figure 1).
Comparing the order of markers obtained here with
that obtained by Barendseet al. (2000), we found three
re-gions with differences: one where the markers BM6026, SYT1 and BP1 were included, another where ETH2, CD9 and TPI1 were included, and one involving the loci ETH152, CYP2D6 and BZRP. For the segment BM6026-BP1, the order presented here agrees with that obtained in
the Bandet al.(2000) RH map and the MARC linkage map
(Kappes et al. 1997). It is worth mentioning that, even
though SYT1 is believed to be close to MYF5 because of their proximity in the human genome (http://www.ncbi. nlm.nih.gov/cgi-bin/Entrez/maps.cgi), the scoring pattern
obtained by Barendseet al. for this locus creates 4 double
3), which may explain the low support for ordering both
here and in the Barendse et al. map. For the segment
ETH2-TPI1, the order Cen-ETH2-CD9-Tel obtained here
agrees with the order obtained in the Bandet al. map.
Addi-tionally, the order CD9-GAPD-TPI1 obtained here agrees with the order for these genes in the short arm of human chromosome 12. Scoring for CD9 in cell line 49 and for TPI1 in cell line 41 (Table 3) also produces double breaks in the fragments. Finally, for the segment ETH152-BZRP, the order CYP2D6-BZRP-Tel agrees with the order for these genes in the long arm of human chromosome 22.
The size of the RH map of BTA5 was smaller than for other chromosomes which have a smaller physical size (Ta-ble 4). The radiation hybrid/genetic linkage relationship
was similar to that reported by Bandet al. (2000), but a lot
smaller than for most of the previously published chromo-somes, which range from 4.9 to 20.47 cR5,000/cM. The rela-tionships for BTA15, BTA23 and BTA29, however, were smaller. Similarly, the physical/radiation hybrid relation-ship for BTA5 was the largest of all the chromosomes, ex-cept for BTA29. The map size and the relationships cR/cM and kb/cR for BTA18 were markedly different from those of the other chromosomes. The estimated cR map size of the bovine genome was estimated to be about 21,000 cR5,000, when using the data for BTA18, but only about
17,700 cR5,000when excluding these data. The cR/cM
rela-tionship also exhibited a significant decrease from 6.57 to 5.57 when the BTA18 data were excluded.
References
Amaral ME, Kata SR and Womack JE (2002) A radiation hybrid map of bovine X Chromosome (BTAX). Mamm Genome 13:268-271.
Amarante MR, Yang YP, Kata SR, Lopes CR and Womack JE (2000) RH maps of bovine chromosomes 15 and 29: conser-vation of human chromosomes 11 and 5. Mamm Genome 11:364-8.
Ashwell MS, Sonstegard TS, Kata S and Womack JE (2002) A ra-diation hybrid map of bovine chromosome 27. Anim Genet 33:75-76.
Band M, Larson JH, Womack JE and Lewin HA (1998) A radia-tion hybrid map of BTA23: identificaradia-tion of a chromosomal rearrangement leading to separation of the cattle MHC class II subregions. Genomics 53:269-275.
Band MR, Larson JH, Rebeiz M, Green CA, Heyen DW, Dono-van J, Windish R, Steining C, Mahyuddin P, Womack JE and Lewin HA (2000) An ordered comparative map of the cattle and human genomes. Genome Res 10:1359-1368. Barendse W, Armitage SM, Aleyasin A and Womack JE (2000)
Differences between the radiation hybrid and genetic linkage maps of bovine chromosome 5 resolved with a quasi-phylo-genetic method of analysis. Mamm Genome 11:369-372. Boehnke M, Lange K and Cox DR (1991) Statistical methods for
multipoint radiation hybrid mapping. Am J Hum Genet 49:1174-1188.
Burns BM, Taylor JF, Herring KL, Herring AD, Holder MT, Col-lins JS, Guerra TM, Sanders JO and Davis SK (1995) Bo-vine microsatellite dinucleotide repeat polymorphisms at the TEXAN11, TEXAN12, TEXAN13, TEXAN14, and TEXAN15 loci. Anim Genet 26:201-202.
Deloukas P, Schuler GD, Gyapay G, Beasley EM, Soderlund C, Rodriguez-Tomé P, Hui L, Matise TC, McKusick KB, Beckmann JS, Bentolila S, Bihoreau M-T, Birren BB, Browne J, Butler A, Castle AB, Chiannilkulchai N, Clee C, Day PJR, Dehejia A, Dibling T, Drouot N, Duprat S, Fizames C, Fox S, Gelling S, Green L, Harrison P, Hocking R, Holloway E, Hunt S, Keil S, Lijnzaad P, Louis-Dit-Sully C, Ma J, Mendis A, Miller J, Morissette J, Muselet D, Nusbaum HC, Peck A, Rozen S, Simon D, Slonim DK, Sta-ples R, Stein LD, Stewart EA, Suchard MA, Thangarajah T, Vega-Czarny N, Webber C, Wu X, Hudson J, Auffray C, Nomura N, Sikela JM, Polymeropoulos MH, James MR, Lander ES, Hudson TJ, Myers RM, Cox DR, Weissenbach J, Boguski MS and Bentley DR (1998) A physical map of 30,000 human genes. Science 282:744-746.
Goldammer T, Kata SR, Brunner RM, Dorroch U, Sanftleben H, Schwerin M and Womack JE (2002) A comparative radia-tion hybrid map of bovine chromosome 18 and homologous
Table 5- Analysis of the maps produced by adding markers scored by Barendseet al. (2000). Only the markers not scored in this study were used for this
analysis.
Loci added Log likelihood N. breaks Map length Order1
Comprehensive Map -195.5 110 435.9 See Figure 1
AGLA293 -210.3 126 522.4 Cen-AGLA293-CSSM34 ILSTS042-IFNG SYT1 -207.2 121 494.0 Cen-SYT1-BP1-MYF5-BM6026-ILSTS042-MGF
LALBA -205.0 118 472.6 CSSM34-LALBA-IFNG
ETH2 -196.5 110 434.7 PZB2F-ETH2-JAB2/GAPD
CD9 -196.8 110 433.7 PZB2F-SLC2A3-BM315-CD9-JAB2/GAPD
TPI1 -198.7 112 446.2 PZB2F-JAB2/GAPD-TPI1-MAF48
BZRP -207.5 120 476.3 BM8126-BZRP-Tel
ETH2, CD9, TPI1 -203.2 114 453.7 BM8230-ETH2-PZB2F-SLC2A3-BM315-CD9-JAB2/ GAPD-TPI1-MAF48
SYT1, AGLA293, LALBA, ETH2, CD9, TPI1, BZRP
-227.9 132 525.6 See Figure 1
chromosomes in human and mice. Proc Natl Acad Sci USA 99:2106-2111.
Gyapay G, Schmitt K, Fizames C, Jones H, Vega-Czarny N, Spillett D, Muselet D, Prud’Homme JF, Dib C, Auffray C, Morissette J, Weissenbach J, Goodfellow PN,et al.(1996) A radiation hybrid map of the human genome. Hum Molec Genet 5:339-346.
Gu Z, Womack JE and Kirkpatrick BW (1999) A radiation hybrid map of bovine chromosome 7 and comparative mapping with human chromosome 19p arm. Mamm Genome 10:1112-1114. Hawken R, Alexander L, Murtaugh J, Flickinger G, Beattie C,
Yerle M, Pinton P, Robic A, Delcros C, Milan D, Gellin J and Schook L (1999) Construction and characterization of a porcine radiation hybrid panel. Plant and Animal Genome VII, USDA, San Diego, California, USA, p 345.
Hukriede NA, Joly L, Tsang M, Miles J, Tellis P, Epstein JA, Barbazuk WB, Li FN, Paw B, Postlethwait JH, Hudson TJ, Zon LI, McPherson JD, Chevrette M, Dawid IB, Johnson SL and Ekker M (1999) Radiation hybrid mapping of the zebrafish genome. Proc Natl Acad Sci USA 96:9745-9750. James MR, Richard CW, Schott JJ, Yousry C, Clark K, Bell J,
Terwilliger JD, Hazan J, Dubay C, Vignal A, Agrapart M, Imai T, Nakamura Y, Polymeropoulos M, Weissenbach J, Cox DR, and Lathrop GM (1994) A radiation hybrid map of 506 STS markers spanning human chromosome 11. Nat Genet 8:70-76.
Jiang Z, Priat C and Galibert F (1998) Traced orthologous ampli-fied sequence tags (TOASTs) and mammalian comparative maps. Mamm Genome 9:577-587.
Kappes SM, Keele JW, Stone RT, McGraw RA, Sonstegard TS, Smith TPL, Lopez-Corrales NL and Beattie CW (1997) A second-generation map of the bovine genome. Genome Res 7:235-249.
Kossarek LM, Finlay O, Grosse WM, Su X and McGraw RA (1996) Seven bovine dinucleotide repeat polymorphisms: RM042, RM128, RM134, RM154, RM162, RM181, RM509. Anim Genet 27:61-63.
Lange K, Boehnke M, Cox DR and Lunetta KL (1995) Statistical methods for polyploid radiation hybrid mapping. Genome Res 5:136-150.
Lyons LA, Laughlin TF, Copeland NG, Jenkins NA, Womack JE and O’Brien SJ (1997) Comparative anchor tagged se-quences (CATS) for integrative mapping of mammalian genomes. Nat Genet 15:47-56.
McCarthy LC, Terrett J, Davis ME, Knights J, Smith AL, Critcher R, Schmitt K, Hudson J, Spurr NK and Goodfellow PN (1997) A first-generation whole genome-radiation hybrid map spanning the mouse genome. Genome Res 7:1153-1161.
McCarthy LC, Bihoreau MT, Kiguwa SL, Browne J, Watanabe TK, Hishigaki H, Tsuji A, Kiel S, Webber C, Davis ME, Knights C, Smith A, Critcher R, Huxtall P, Hudson JR Jr, Ono T, Hayashi H, Takagi T, Nakamura Y, Tanigami A, Goodfellow PN, Lathrop GM and James MR (2000) A whole-genome radiation hybrid panel and framework map of the rat genome. Mamm Genome 11:791-795.
Murphy WJ, Menotti-Raymond M, Lyons LA, Thompson MA and O’Brien SJ (1999) Development of a feline whole ge-nome radiation hybrid panel and comparative mapping of human chromosome 12 and 22 loci. Genomics 57:1-8.
Ozawa A, Band MR, Larson JH, Donovan J, Green CA, Womack JE and Lewin HA (2000) Comparative organization of cattle chromosome 5 revealed by comparative mapping by annota-tion and sequence similarity and radiaannota-tion hybrid mapping. Proc Natl Acad Sci USA 97:4150-4155.
Popescu CP, Long S, Riggs P, Womack JE, Schmutz S, Fries R and Gallagher DS (1996) Standardization of cattle chromo-some nomenclature: report of the committee for the stan-dardization of the cattle karyotype. Cytogenet Cell Genet 74:259-261.
Priat C, Hitte C, Vignaux F, Renier C, Jiang Z, Jouquand S, Cheron A, Andre C and Galibert F (1998) A whole-genome radiation hybrid map of the dog genome. Genomics 54:361-378.
Rexroad CE, Schlapfer JS, Yang Y, Harlizius B and Womack JE (1999) A radiation hybrid map of bovine chromosome one. Anim Genet 30:325-332.
Rexroad CE 3rd, Owens EK, Johnson JS and Womack JE (2000) A 12,000 rad whole genome radiation hybrid panel for high resolution mapping in cattle: characterization of the centro-meric end of chromosome 1. Anim Genet 31:262-265. Schläpfer J, Yang Y, Rexroad C and Womack JE (1997) A
radia-tion hybrid framework map of bovine chromosome 13. Chromosome Res 5:511-519.
Schmitt K, Foster JW, Feakes RW, Knights C, Davis ME, Spillett DJ and Goodfellow PN (1996) Construction of a mouse whole-genome radiation hybrid panel and application to MMU11. Genomics 34:193-197.
Senese C, Motavalian M, Urciuoli M, Di Gregorio P, Ramunno L, Rando A and Masina P (1997) Two bovine polymorphic microsatellite loci (PZ251 and PZB2F). Anim Genet 28:318. Stewart EA, NcKusick KB, Aggarwal A, Bajorek E, Brady S, Chu A, Fang N, Hadley D, Harris M, Hassain S, Lee R, Maratululam A, O’Conner K, Perkins S, Piercy M, Qin F, Reif T, Sanders C, She X, Sun W, Tabar P, Voyticky S, Cowles S, Fan J, Mader C, Quackenbush J, Myers RM, and Cox DR (1997) An STS-based radiation hybrid map of the human genome. Genome Res 7:422-433.
Van Etten WJ, Steen RG, Nguyen H, Castle AB, Slonim DK, Ge B, Nusbaum C, Schuler GD, Lander ES and Hudson TJ (1999) Radiation hybrid map of the mouse genome. Nat Genet 22:384-7.
Walter MA, Spillet DJ, Thomas P, Weissenbach J and Goodfellow PN (1994) A method for constructing radiation hybrid maps of whole genomes. Nat Genet 7:22-28. Womack JE, Johnson JS, Owens EK, Rexroad CE, Schlapfer J
and Yang Y-P (1997) Whole-genome radiation hybrid panel for bovine gene mapping. Mamm Genome 8:854-856. Wu X (1998) Comparative mapping and positional cloning of
ETLs on bovine chromosomes two and four. PhD Thesis, Texas A&M University, College Station, Texas, USA. Yang Y, Rexroad C, Schläpfer J and Womack JE (1998) An
inte-grated radiation hybrid map of bovine chromosome 19 and ordered comparative mapping with human chromosome 17. Genomics 48:93-99.
Yerle M, Pinton P, Robic A, Delcros C, Hawken R, Alexander L, Beattie C, Schook L, Milan D and Gellin J (1998) Construc-tion of a whole genome radiaConstruc-tion hybrid panel for high-resolution gene mapping in pig. Anim Genet 29(Suppl. 1):38.