CARLOS ALEXANDRE GOMES RIBEIRO
IDENTIFICAÇÃO DE REGIÕES GENÔMICAS RELACIONADAS À SECA E DEFICIÊNCIA DE FÓSFORO VIA ANÁLISE DE LIGAÇÃO E
MAPEAMENTO ASSOCIATIVO EM MILHO TROPICAL
Tese apresentada à Universidade Federal de Viçosa, como parte das exigências do Programa de Pós-Graduação em Genética e Melhoramento, para obtenção do título de Doctor Scientiae.
VIÇOSA
Ficha catalográfica preparada pela Biblioteca Central da Universidade Federal de Viçosa - Câmpus Viçosa
T
Ribeiro, Carlos Alexandre,
1985-R484i
2015
Identificação de regiões genômicas relacionadas á seca e
deficiência de fósforo via análise de ligação e mapeamento
associativo em milho tropical / Carlos Alexandre Ribeiro. –
Viçosa, MG, 2015.
ix, 89f. : il. (algumas color.) ; 29 cm.
Orientador: Everaldo Gonçalves de Barros.
Tese (doutorado) - Universidade Federal de Viçosa.
Inclui bibliografia.
1. Milho - Melhoramento genético. 2. Genética vegetal.
3. Mapeamento genético. 4. Milho - Consumo hídrico. 5. Milho
- Efeito do fósforo. I. Universidade Federal de Viçosa.
Departamento de Biologia Geral. Programa de Pós-graduação
em Genética e Melhoramento. II. Título.
CARLOS ALEXANDRE GOMES RIBEIRO
IDENTIFICAÇÃO DE REGIÕES GENÔMICAS RELACIONADAS À SECA E DEFICIÊNCIA DE FÓSFORO VIA ANÁLISE DE LIGAÇÃO E
MAPEAMENTO ASSOCIATIVO EM MILHO TROPICAL
Tese apresentada à Universidade Federal de Viçosa, como parte das exigências do Programa de Pós-Graduação em Genética e Melhoramento, para obtenção do título de Doctor Scientiae.
APROVADA: 22 de outubro de 2015.
___________________________ ____________________________
Dr. Luciano da Costa e Silva Prof. Rodrigo Oliveira de Lima
___________________________ _____________________________
Dra. Claudia Teixeira Guimarães Dra. Sylvia Morais de Sousa Tinoco (Coorientadora)
____________________________________ Prof. Everaldo Gonçalves de Barros
ii A meus pais Duílio e Rosa
iii
AGRADECIMENTOS
Agradeço primeiramente a Deus por me proporcionar a oportunidade de crescimento pessoal e profissional através da experiência adquirida em mais uma importante etapa em minha vida.
À Universidade Federal de Viçosa, especialmente ao Programa de Pós-Graduação em Genética e Melhoramento pela oportunidade de realizar o curso.
À CAPES e ao CNPq pela concessão do financiamento dos estudos.
À Embrapa Milho e Sorgo que contribuiu diretamente aos estudos efetuados através da logística disponibilizada.
Ao Generation Challenge Program pelo financiamento das atividades de pesquisa.
Ao Professor Everaldo Gonçalves de Barros, não só pela orientação, mas pela amizade e pelo exemplo de profissionalismo e dedicação.
À minhas coorientadoras Claudia Teixeira Guimarães e Maria Marta Pastina que participaram intensamente do desenvolvimento da pesquisa. Muito obrigado pelos conselhos e pela confiança depositada durante esses anos.
Ao meu coorientador da Universidade de Cornell (EUA), Edward Buckler pela oportunidade, pelo exemplo e pelos ensinamentos.
Aos conselheiros, funcionários, professores e pesquisadores da Universidade Federal de Viçosa e Embrapa Milho e Sorgo pelo apoio e valiosa contribuição científica e profissional durante o desenvolvimento do trabalho, em especial a Gislene pela significativa contribuição na execução dos trabalhos.
Aos meus colegas, amigos e familiares que me acompanharam nessa jornada, participando direta ou indiretamente deste trabalho e sem dúvida foram fundamentais em todas as etapas.
À Juliana pelo apoio constante, companheirismo, carinho e compreensão.
iv
SUMÁRIO
RESUMO ... vi
ABSTRACT ...viii
INTRODUÇÃO GERAL ... 1
Importância do milho ... 1
Efeito do estresse à seca na estabilidade de produção ... 1
Mecanismos de adaptação à seca em milho ... 2
Bases moleculares da resposta ao estresse à seca ... 4
Efeito do estresse por deficiência de fósforo na estabilidade de produção ... 5
Mecanismos de adaptação à deficiência de fósforo ... 6
Bases moleculares da resposta ao estresse por deficiência de P ... 7
Mapeamento de QTL e associativo para análise de características quantitativas ... 7
REFERÊNCIAS BIBLIOGRÁFICAS ... 9
CAPÍTULO 1 ... 17
Multi-environment QTL mixed models adjusted for phenological covariates for drought stress in tropical maize germplasm ... 17
Abstract ... 18
Introduction ... 19
Material and Methods ... 21
Plant material ... 21
Field experiments ... 21
Genotypic data and linkage map ... 22
Phenotypic data analysis ... 23
QTL mixed model analysis ... 25
Results ... 26
Phenotypic data ... 26
Multi-environment QTL analysis for MP1 (L2321 x L31212) ... 28
Multi-environment QTL analysis for MP2 (L1761121 x L521237) ... 28
Joint QTL results between populations ... 29
Discussion ... 30
Acknowledgments ... 33
References ... 33
v
Figures ... 45
Supplemental materials ... 50
CAPÍTULO 2 ... 52
Genome-wide association studies for root morphology and phosphorus acquisition efficiency in maize seedlings ... 52
Abstract ... 53
Introduction ... 54
Results ... 56
Phenotypic evaluation of the tropical maize association panel ... 56
Corrections of type I error using population structure and kinship matrix ... 57
Fast linkage disequilibrium decay within the panel ... 58
Genome wide association mapping ... 58
SNPs significantly associated with root morphology traits and total seedling dry weight ... 58
SNPs significantly associated with total seedling P concentration and total seedling P content . 60 Discussion ... 60
Morphology traits ... 60
Linkage disequilibrium... 60
Association studies and candidate genes ... 61
Material and methods ... 64
Plant material ... 64
Root morphology analysis and phosphorus quantification ... 64
Experimental design and adjusted means ... 65
SNP data ... 66
Population structure and Kinship matrix ... 67
Linkage disequilibrium (LD) ... 67
GWAS analysis and candidate genes ... 67
Acknowledgments ... 68
References ... 68
Tables ... 76
Figures ... 78
Supplemental Materials ... 85
vi
RESUMO
RIBEIRO, Carlos Alexandre Gomes, D.Sc., Universidade Federal de Viçosa, outubro de 2015.
Identificação de regiões genômicas relacionadas à seca e à deficiência de fósforo via análise de ligação e mapeamento associativo em milho tropical. Orientador: Everaldo Gonçalves de
Barros. Coorientadores: Claudia Teixeira Guimarães e Maria Marta Pastina.
vii
e background genéticos, com uso potencial no melhoramento assistido. A deficiência de fósforo (P) é um problema recorrente principalmente em solos tropicais. A proliferação e o desenvolvimento do sistema radicular são estratégias para maximizar a exploração do solo, aumentando a eficiência na aquisição de P pelas plantas. Esse estresse abiótico foi abordado por meio do mapeamento associativo em um painel composto por 561 linhagens de milho tropical. O painel foi genotipado com marcadores SNPs gerados pela genotipagem por sequenciamento (GBS) e fenotipado para características de morfologia radicular e aquisição de P em solução nutritiva sob baixa e alta concentração de P. Modelos lineares mistos corrigidos para os efeitos de estrutura de populações e de parentesco permitiram a identificação de 136 SNPs associados com um conjunto de seis características, considerando a significância de –log10 (P-valor) ≥ 5. O decaimento médio
viii
ABSTRACT
RIBEIRO, Carlos Alexandre Gomes, D.Sc., Universidade Federal de Viçosa, October, 2015.
Identification of genomic regions related to drought and phosphorus deficiency by linkage analysis and association mapping in tropical maize. Adviser: Everaldo Gonçalves de Barros.
Co-advisers: Claudia Teixeira Guimarães e Maria Marta Pastina.
ix
through association mapping on a panel of 561 tropical maize inbreed lines. The panel was genotyped with SNP markers generated by genotyping-by-sequencing (GBS) and phenotyped for root morphology traits and P acquisition in nutrient solution under low and high P concentration. Mixed linear models corrected for population structure and kinship effects allowed the identification of 136 SNPs associated with a set of six traits considering the significance of -log10
1
INTRODUÇÃO GERAL
Importância do milho
O milho (Zea mays L. spp. mays) é uma gramínea da família Poaceae, sendo o cereal mais produzido no mundo, com produção mundial estimada em um bilhão de toneladas do grão para a safra 2014/15 (USDA, 2015). O Brasil ocupa a terceira posição no ranking dos maiores produtores mundiais, atrás dos Estados Unidos e da China, e a segunda posição entre os maiores exportadores do grão, atrás apenas dos Estados Unidos. A produção brasileira de milho, considerando a primeira e a segunda safra de 2014/2015, foi de 84,7 milhões de toneladas ocupando uma área de 15,7 milhões de hectares, com uma produtividade média de 5,4 toneladas por hectare (CONAB, 2015). O milho é um dos produtos de maior destaque do setor agrícola nacional, devido as suas amplas formas de utilização, que incluem a alimentação animal, que representa a maior parte do consumo desse cereal (70%), principalmente para aves e suínos; a alimentação humana; a indústria, com a produção de solventes, vitaminas, conservantes, estabilizadores e adoçantes; a produção de óleo e de biocombustível.
Além da sua importância econômica e social, o milho é uma das espécies cultivadas mais bem estudadas do ponto de vista genético, fisiológico e bioquímico. O genoma do milho foi completamente sequenciado, cujo tamanho varia de 2,3 a 2,7 Gb (giga bases), ao longo de 10 cromossomos, contendo mais de 30.000 genes (Schnable et al., 2009). Assim, os estudos genéticos em milho têm contribuído significativamente para o entendimento da estrutura, função e inter-relações moleculares, apesar da sua complexidade genômica, composto por cerca de 80% de elementos transponíveis.
Efeito do estresse à seca na estabilidade de produção
2
et al., 2007). Sob condições de deficiência hídrica, um dos primeiros efeitos é a redução da turgescência da célula e alterações dos processos fisiológicos dependentes do turgor, como o crescimento celular (Taiz e Zeiger, 2004). A severidade do efeito causado pelo déficit hídrico dependerá da intensidade e da duração do estresse, além do quão adaptada está a cultura ou o genótipo para tolerar o estresse.
Além disso, como a ocorrência da seca em condições naturais é de difícil previsão, e muitas vezes associada a outros estresses como o calor e deficiência de nutrientes, dificulta ainda mais a mensuração desses efeitos em campo, o que implica em novos desafios frente às constantes alterações climáticas. Durante o déficit hídrico, a diminuição na disponibilidade de água afeta a taxa de transpiração bem como o transporte de metabólitos, que acarreta a diminuição da captação de nutrientes, como nitrogênio e fósforo, e a alteração na concentração desses compostos em diferentes órgãos da planta (Ge et al., 2012). Assim, quanto maior for o estresse hídrico, menor será a captação desses nutrientes.
Mecanismos de adaptação à seca em milho
3
planta em um estado de desidratação, sendo, às vezes, visto como a segunda linha de defesa, após os mecanismos de evitação (Blum, 2005). Os mecanismos de escape e evitação são muito mais conhecidos nas plantas do que mecanismos de tolerância, um dos principais exemplos de mecanismos de tolerância é a remobilização das reservas de carboidrato do caule para o enchimento de grãos sob estresse hídrico (Blum, 1998). Este processo permite o enchimento de grãos de forma eficaz, quando toda a fotossíntese da planta é inibida pelo estresse, desde que quantidade suficiente de carboidrato tenha sido armazenada antes do enchimento de grãos (Blum, 2005).
Além dos mecanismos morfológicos, mecanismos bioquímicos e fisiológicos alternativos são ativados em função da baixa disponibilidade de água no solo e/ou alta demanda evaporativa que retardam o aparecimento do déficit hídrico. Com o aumento da severidade do estresse hídrico, a fotossíntese e a transpiração são atingidas devido, principalmente, à regulação dos estômatos (Kumar et al., 1994). As células-guarda dos estômatos necessitam de água para sua abertura e fechamento, promovendo as trocas gasosas. O fechamento estomático diminui a entrada de CO2,
tornando-o pouco disponível para a assimilação na fotossíntese, reduzindo a eficiência da fotossíntese e acumulando energia nos centros de reação dos fotossistemas, o que resulta na formação de espécies reativas de oxigênio (ROS) que causam desintegração de membranas causada pelo estresse oxidativo (Tambussi et al., 2000).
Apesar do déficit hídrico causar efeitos negativos à produção ao longo de todo o desenvolvimento da cultura, em milho são elencados três importantes estádios de desenvolvimento, onde essa deficiência acarreta danos mais severos. Os estádios de desenvolvimento críticos são: i) iniciação floral e desenvolvimento da inflorescência, quando o número potencial de grãos é determinado (estádio v3); ii) período de fertilização, quando deve-se evitar a desidratação do grão de pólen e garantir o desenvolvimento do tubo polínico, sendo fixado o potencial de produção; e iii) enchimento de grãos, quando ocorre a deposição de matéria seca, sendo determinado o peso dos grãos (Magalhaes e Duraes, 2006).
4
alcançar uma estatura suficiente para ter um nível adequado de fotoassimilados (Lu et al., 2012). Embora a base da vulnerabilidade do milho no período de florescimento não seja entendida por completo, evidências indicam que as linhagens mais adaptadas favorecem a estrutura reprodutiva em detrimento da parte vegetativa sob déficit hídrico (Setter et al., 2011). Em condições de estresse em geral ocorre um atraso na emergência do estilo-estigma resultando em dessincronia de florescimento dos órgãos reprodutores masculino e feminino, ocasionando o aborto de grãos (Cattivelli et al., 2008).
Bases moleculares da resposta ao estresse à seca
Vários estudos vêm contribuindo para identificação de regiões genômicas relacionadas com a resposta ao estresse hídrico em milho (Agrama e Moussa, 1996; Malosetti et al., 2008; Messmer et al., 2009; Messmer et al., 2011; Almeida et al., 2013). Características como produção de grãos, altura de planta e intervalo de florescimento são frequentemente avaliadas em estratégias de mapeamento genético visando a identificação e a utilização de QTLs (Quantitative Trait Loci) no intuito de elevar a tolerância de genótipos em um contexto de melhoramento de plantas. Cinco QTLs para a redução do intervalo entre o florescimento masculino e feminino foram introgredidos por retrocruzamento assistido em linhagens elites de milho sensíveis à seca, resultando em uma maior estabilidade de produção em comparação a linhagens não melhoradas em condições de estresse hídrico severo (Ribaut e Ragot, 2007). No entanto, a vantagem produtiva diminuiu sob estresses menos intensos, desaparecendo quando o estresse causou uma redução na produção menor que 40%. Apesar de várias regiões genômicas identificadas, ainda é limitado o conhecimento a respeito da resposta ao estresse com relação aos genes envolvidos.
Estudos funcionais envolvendo a caracterização molecular do papel fisiológico de genes relacionados ao estresse hídrico em diferentes estágios de resposta podem ajudar a elucidar os mecanismos regulatórios envolvidos com a resposta ao estresse. O ácido abscísico (ABA) é um regulador central de diversas respostas de plantas para estresses ambientais tendo papel importante na integração de sinais após a percepção do estresse (Tran et al., 2007). O déficit hídrico tende a aumentar a concentração de ABA que promove o fechamento dos estômatos, limitando a difusão de CO2 de espaços intercelulares para o interior dos cloroplastos durante a seca exercendo
5
Quinases e fosfatases têm sido descritas como enzimas importantes na transdução de sinais em resposta ao estresse osmótico em plantas, como membros da família MAPK (Mitogen-Activated Protein Kinases) dependentes de Ca2+ e as SnRK (SNF1 related kinases), que atuam como um regulador do fechamento estomático em resposta ao ABA (Mustilli et al., 2002; Brock et al., 2010). Plantas com redução ou aumento na expressão de genes que codificam muitas destas quinases, são mais ou menos tolerantes ao estresse hídrico, respectivamente (Mustilli et al., 2002). Estes resultados demonstram a importância das quinases nos mecanismos de tolerância à seca, colocando-as como candidatas para estudo e potencial aplicação no desenvolvimento de genótipos tolerantes à seca.
Efeito do estresse por deficiência de fósforo na estabilidade de produção
O Cerrado brasileiro possui uma das maiores áreas potencialmente cultiváveis no mundo, cujo solo é ácido por natureza. Solos ácidos limitam a produção agrícola em 30 a 40% das terras cultivadas mundiais (Haug, 1984). A baixa fertilidade natural desses solos, juntamente com uma combinação de compostos minerais tóxicos como o alumínio e o manganês, inibem o crescimento radicular, limitando o desenvolvimento das plantas. Por outro lado, o bioma Cerrado apresenta diversas vantagens agronômicas no que tange à topografia, ao clima e às condições físicas do solo, assumindo, por isso, um papel importante na agricultura nacional.
6
Mecanismos de adaptação à deficiência de fósforo
As plantas utilizam vários mecanismos de adaptação à baixa disponibilidade de P, que podem ser classificados em dois grupos principais: eficiência de aquisição e eficiência de utilização interna (Vance et al., 2003; Parentoni e Souza Júnior, 2008). A eficiência de aquisição é definida como a quantidade de nutriente absorvido pela planta dividido pela quantidade de nutriente suprido à cultura (Moll et al., 1982). A eficiência de utilização interna está relacionada com a quantidade de produto (grãos) produzido por unidade de nutriente (Good et al., 2004), envolvendo, principalmente a reciclagem, a translocação e o armazenamento de fósforo na planta (Schachtman et al., 1998; Baligar et al., 2001; Shenoy e Kalagudi, 2005).
A eficiência na aquisição de P apresentou maior influência na eficiência no uso de P do que a eficiência de utilização interna em genótipos de milho tropical (Parentoni e Souza Júnior, 2008). Como o P possui baixa mobilidade no solo, a principal estratégia para sua aquisição consiste em maximizar a exploração do solo por meio da proliferação e da extensão do sistema radicular (Ramaekers et al., 2010). Assim, genótipos mais eficientes na aquisição de P apresentaram pelos radiculares longos e densos (Lynch, 2007), raízes laterais mais longas (Zhu e Lynch, 2004), maior ramificação e área de superfície radicular (Lynch, 2007). Além das mudanças na morfologia radicular, outros mecanismos estão envolvidos na adaptação a baixa disponibilidade de P como a exsudação de ácidos orgânicos e de outros compostos orgânicos de baixo peso molecular para a rizosfera e associação das raízes com microrganismos, como fungos micorrízicos arbusculares (Vance et al., 2003; Ramaekers et al., 2010; Lynch, 2011).
7
Bases moleculares da resposta ao estresse por deficiência de P
Genes que controlam o desenvolvimento radicular também podem ser alvos para a seleção com propósito de aumentar a tolerância à deficiência hídrica e de fósforo. Características como comprimento total radicular e área de superfície total têm sido correlacionadas tanto com maior tolerância a seca (Li et al., 2015) quanto para melhor aquisição de P (De Souza et al., 2012), demonstrando uso potencial de seleção considerando ambos os estresses. No entanto, a seleção de genótipos com base em características radiculares não vem sendo realizada em função das dificuldades na avaliação fenotípica.
Morfologia de raiz é uma característica complexa em milho, sendo controlada por vários genes (Tuberosa et al., 2002; Ramaekers et al., 2010). Apesar de vários QTLs associados com a morfologia do sistema radicular e com a aquisição de P terem sido identificados em solução nutritiva e em condições de campo (Zhu et al., 2005a; b; Chen et al., 2008), apenas um número limitado de genes candidatos foram associados com tais características. Um QTL de efeito maior controlando absorção de P (Pup1) foi identificado em arroz, explicando cerca de 80% da sua variação fenotípica (Wissuwa et al., 2002), sendo também associado com um aumento na área superficial da raiz em condições de baixo P (Wissuwa e Ae, 2001). Phosphorus-starvation tolerance 1 (PSTOL1) foi identificado como um gene responsável pelos efeitos do Pup1, que codifica uma proteína quinase envolvida no crescimento inicial da raiz e na absorção de P, aumentando também a produção de grãos em variedades em arroz cultivadas sob deficiência de P (Gamuyao et al., 2012). Recentemente, quatro homólogos do gene PSTOL1 de milho foram co-localizados com QTLs relacionados com características radiculares e índices de eficiência de aquisição de P em solução nutritiva sob estresse de P (Azevedo et al., 2015). Outros genes associados com a morfologia da raiz foram identificados em milho, tais como roothairless (rth1) (Wen et al., 2005), brittle stalk-2-like protein 3 (bk2L3) (Brady et al., 2007), e rootless concerning crown and seminal roots (rtcs) (Taramino et al., 2007).
Mapeamento por meio de ligação e associação para análise de características quantitativas
8
(Amplified Fragment Length Polymorphism), SSR (Simple Sequence Repeats) e SNP (Single-Nucleotide Polymorphism), o mapeamento genético começou a ser amplamente utilizado na decomposição de características genéticas complexas em seus componentes mendelianos. A grande disponibilidade de marcadores com densa cobertura dos genomas, aliada aos procedimentos estatísticos avançados, tem permitido a identificação de regiões genômicas associadas com características de interesse agronômico para a maioria das espécies vegetais.
O mapeamento de QTLs baseado em análises de ligação genética é realizado em populações estruturadas derivadas de cruzamento entre dois genótipos contrastantes para a característica de interesse, seguido por ciclos de autofecundação ou de retrocruzamentos, como retrocruzamento, F2 e RILs (Recombinant Inbred Lines). O grau de associação entre marcadores
moleculares e variações fenotípicas é um indicativo da frequência de recombinação entre o marcador e o QTL, quanto menor a frequência de recombinação entre os locos, maior será o grau de associação. A baixa frequência de recombinação entre locos não é garantia de proximidade física entre locos, pois outros fatores como proximidade do centrômero tendem a diminuir a frequência de recombinação. Alguns dos métodos utilizados para o mapeamento de QTL são os modelos lineares baseado em ANOVA e regressão linear, mapeamento por intervalo simples, mapeamento por intervalo composto (Jansen e Stam, 1994) e mapeamento por múltiplos intervalos (Kao et al., 1999).
9
germoplasmas melhorados, descendentes de um pequeno grupo de linhagens fundadoras (Yu et al., 2006). O controle dos falsos positivos provenientes da estrutura de população e do parentesco entre indivíduos permite uma maior precisão na identificação de regiões potenciais relacionadas com a característica de interesse, favorecendo a busca pelos genes alvo com maior segurança.
O mapeamento associativo tem como vantagens a análise de múltiplos alelos, representando um conjunto de genótipos ou mesmo a espécie, ao contrário de apenas dois alelos avaliados nas populações biparentais. As populações segregantes são demoradas para obtenção e envolvem um custo para o desenvolvimento, ao passo que um painel para mapeamento associativo requer apenas uma coleção de genótipos. A resolução do mapeamento genético (QTL e associativo) depende da recombinação entre o marcador e o loco que controla a característica de interesse. Desta forma, no caso das análises de ligação baseadas em populações experimentais, uma menor resolução é observada, devido ao menor número de gerações de recombinação comparado com populações não estruturadas, onde muitas gerações de recombinação ocorreram entre marcador e QTL, considerando o histórico de recombinação das linhagens avaliadas (Yu e Buckler, 2006).
Uma das limitações do mapeamento por desequilíbrio de ligação é a baixa confiabilidade na detecção de alelos raros na população, principalmente se eles possuírem um pequeno efeito sobre a característica. Nos casos de alelos raros, as populações biparentais seriam mais adequadas para o mapeamento, pois seriam feitos cruzamentos controlados em que a população experimental herdaria o alelo de interesse. Por estas razões, é possível afirmar que esses são métodos complementares e que uma estratégia interessante seria utilizar o mapeamento por associação para refinar a localização do QTL previamente identificado através da análise de ligação em populações estruturadas, assim contribuindo de uma forma mais precisa para uma melhor compreensão da estrutura genética.
REFERÊNCIAS BIBLIOGRÁFICAS
10
ALMEIDA, G. D. et al. QTL mapping in three tropical maize populations reveals a set of constitutive and adaptive genomic regions for drought tolerance. Theoretical and Applied
Genetics, v. 126, n. 3, p. 583-600, Mar 2013. ISSN 0040-5752. Disponível em: < <Go to
ISI>://WOS:000315441800003 >.
ARAUS, J. L.; SERRET, M. D.; EDMEADES, G. O. Phenotyping maize for adaptation to drought.
Frontiers in Physiology, v. 3, 2012. ISSN 1664-042X. Disponível em: < <Go to
ISI>://WOS:000209173000299 >.
AZEVEDO, G. C. et al. Multiple interval QTL mapping and searching for PSTOL1 homologs associated with root morphology, biomass accumulation and phosphorus content in maize seedlings under low-P. BMC Plant Biology, v. 15, Jul 7 2015. ISSN 1471-2229. Disponível em: < <Go to ISI>://WOS:000357561900003 >.
BALIGAR, V. C.; FAGERIA, N. K. Nutrient use efficiency in acid soils: nutrient management and plant use efficiency. In: Moniz, A. C.; Furlani, A. M. C.; Schaffertm, R. E.; Rosolem, C. A. e Canatarella, H. (Ed.). Plant–soil interactions at low pH: sustainable agriculture and forestry roduction. 1997. p. 75–97.
BALIGAR, V. C.; FAGERIA, N. K.; HE, Z. L. Nutrient use efficiency in plants. Communications
in Soil Science and Plant Analysis, v. 32, n. 7-8, p. 921-950, 2001. ISSN 0010-3624. Disponível
em: < <Go to ISI>://WOS:000170101800002 >.
BLUM, A. Improving wheat grain filling under stress by stem reserve mobilisation (Reprinted from Wheat: Prospects for global improvement, 1998). Euphytica, v. 100, n. 1-3, p. 77-83, 1998. ISSN 0014-2336. Disponível em: < <Go to ISI>://WOS:000073208800011 >.
BLUM, A. Drought resistance, water-use efficiency, and yield potential - are they compatible, dissonant, or mutually exclusive? Australian Journal of Agricultural Research, v. 56, n. 11, p. 1159-1168, 2005. ISSN 0004-9409. Disponível em: < <Go to ISI>://WOS:000233570500006 >. BRADY, S. M. et al. Combining expression and comparative evolutionary analysis. The COBRA gene family. Plant Physiology, v. 143, n. 1, p. 172-187, Jan 2007. ISSN 0032-0889. Disponível em: < <Go to ISI>://WOS:000243350600019 >.
BROCK, A. K. et al. The Arabidopsis Mitogen-Activated Protein Kinase Phosphatase PP2C5 Affects Seed Germination, Stomatal Aperture, and Abscisic Acid-Inducible Gene Expression.
Plant Physiology, v. 153, n. 3, p. 1098-1111, Jul 2010. ISSN 0032-0889. Disponível em: < <Go
to ISI>://WOS:000279400200017 >.
11
CHEN, J. Y. et al. QTL mapping of phosphorus efficiency and relative biologic characteristics in maize (Zea mays L.) at two sites. Plant and Soil, v. 313, n. 1-2, p. 251-266, Dec 2008. ISSN 0032-079X. Disponível em: < <Go to ISI>://WOS:000260961600020 >.
COMPANHIA NACIONAL DE ABASTECIMENTO - CONAB. Acompanhamento da Safra
Brasileira: Grãos - Safra 2014/2015 - Décimo segundo levantamento. Disponível em:
<http://www.conab.gov.br/>. Acesso em 20 de setembro de 2015.
CORNIC, G. Drought stress inhibits photosynthesis by decreasing stomatal aperture - not by affecting ATP synthesis. Trends in Plant Science, v. 5, n. 5, p. 187-188, May 2000. ISSN 1360-1385. Disponível em: < <Go to ISI>://WOS:000086954500002 >.
DE SOUSA, S. M. et al. A role for root morphology and related candidate genes in P acquisition efficiency in maize. Functional Plant Biology, v. 39, n. 10-11, p. 925-935, 2012. ISSN 1445-4408. Disponível em: < <Go to ISI>://WOS:000310380800011 >.
FAROOQ, M. et al. Plant drought stress: effects, mechanisms and management. In: LICHTFOUSE, E. et al. (eds.). Sustainable Agriculture: Springer, 2009. 29: 185-212.
FLINT-GARCIA, S. A.; THORNSBERRY, J. M.; BUCKLER, E. S. Structure of linkage disequilibrium in plants. Annual Review of Plant Biology, v. 54, p. 357-374, 2003. ISSN 1040-2519. Disponível em: < <Go to ISI>://WOS:000185094100014 >.
GAHOONIA, T. S.; NIELSEN, N. E. Root traits as tools for creating phosphorus efficient crop varieties. Plant and Soil, v. 260, n. 1-2, p. 47-57, Mar 2004. ISSN 0032-079X. Disponível em: < <Go to ISI>://WOS:000221763000005 >.
GAMUYAO, R. et al. The protein kinase Pstol1 from traditional rice confers tolerance of phosphorus deficiency. Nature, v. 488, n. 7412, p. 535-+, Aug 23 2012. ISSN 0028-0836. Disponível em: < <Go to ISI>://WOS:000307761600042 >.
GE, T. D. et al. Effects of drought stress on phosphorus and potassium uptake dynamics in summer maize (Zea mays) throughout the growth cycle. Acta Physiologiae Plantarum, v. 34, n. 6, p. 2179-2186, Nov 2012. ISSN 0137-5881. Disponível em: < <Go to ISI>://WOS:000310165900012 >.
GOOD, A. G.; SHRAWAT, A. K.; MUENCH, D. G. Can less yield more? Is reducing nutrient input into the environment compatible with maintaining crop production? Trends in Plant
Science, v. 9, n. 12, p. 597-605, Dec 2004. ISSN 1360-1385. Disponível em: < <Go to
ISI>://WOS:000226018700009 >.
12
HAUG, A. Molecular Aspects of Aluminum Toxicity. Crc Critical Reviews in Plant Sciences, v. 1, n. 4, p. 345-373, 1984. ISSN 0735-2689. Disponível em: < <Go to ISI>://WOS:A1984SS33300004 >.
JALEEL, C. A. et al. Responses of antioxidant defense system of Catharanthus roseus (L.) G. Don. to paclobutrazol treatment under salinity. Acta Physiologiae Plantarum, v. 29, n. 3, p. 205-209, Jun 2007. ISSN 0137-5881. Disponível em: < <Go to ISI>://WOS:000249586400004 >. JANSEN, R. C.; STAM, P. High-Resolution of Quantitative Traits into Multiple Loci Via Interval Mapping. Genetics, v. 136, n. 4, p. 1447-1455, Apr 1994. ISSN 0016-6731. Disponível em: < <Go to ISI>://WOS:A1994NB82100021 >.
KAO, C. H.; ZENG, Z. B.; TEASDALE, R. D. Multiple interval mapping for quantitative trait loci. Genetics, v. 152, n. 3, p. 1203-1216, Jul 1999. ISSN 0016-6731. Disponível em: < <Go to ISI>://WOS:000081341900031 >.
KAVAR, T. et al. Identification of genes involved in the response of leaves of Phaseolus vulgaris to drought stress. Molecular Breeding, v. 21, n. 2, p. 159-172, Feb 2008. ISSN 1380-3743. Disponível em: < <Go to ISI>://WOS:000251868400003 >.
KOCHIAN, L. V.; HOEKENGA, O. A.; PINEROS, M. A. How do crop plants tolerate acid soils? - Mechanisms of aluminum tolerance and phosphorous efficiency. Annual Review of Plant
Biology, v. 55, p. 459-493, 2004. ISSN 1040-2519. Disponível em: < <Go to
ISI>://WOS:000222766000018 >.
KUMAR, A.; SINGH, D. P.; SINGH, P. Influence of Water-Stress on Photosynthesis, Transpiration, Water-Use Efficiency and Yield of Brassica-Juncea L. Field Crops Research, v. 37, n. 2, p. 95-101, May 1994. ISSN 0378-4290. Disponível em: < <Go to ISI>://WOS:A1994PC82400002 >.
LI, R. et al. Genetic variation for maize root architecture in response to drought stress at the seedling stage. Breeding Science, v. 65, n. 4, p. 298-307, Sep 2015. ISSN 1344-7610.
LU, Y. L. et al. Comparative LD mapping using single SNPs and haplotypes identifies QTL for plant height and biomass as secondary traits of drought tolerance in maize. Molecular Breeding, v. 30, n. 1, p. 407-418, Jun 2012. ISSN 1380-3743. Disponível em: < <Go to ISI>://WOS:000304646100033 >.
13
MACKAY, I.; POWELL, W. Methods for linkage disequilibrium mapping in crops. Trends in
Plant Science, v. 12, n. 2, p. 57-63, Feb 2007. ISSN 1360-1385. Disponível em: < <Go to
ISI>://WOS:000244826000004 >.
MAGALHAES, P. C.; DURAES, F. O. M. Fisiologia da Produção de milho. Embrapa Milho e Sorgo. Sete Lagoas, 2006. 10 p.
MALOSETTI, M. et al. A multi-trait multi-environment QTL mixed model with an application to drought and nitrogen stress trials in maize (Zea mays L.). Euphytica, v. 161, n. 1-2, p. 241-257, May 2008. ISSN 0014-2336. Disponível em: < <Go to ISI>://WOS:000254877800021 >. MESSMER, R. et al. Drought stress and tropical maize: QTLs for leaf greenness, plant
senescence, and root capacitance. Field Crops Research, v. 124, n. 1, p. 93-103, Oct 9 2011. ISSN 0378-4290. Disponível em: < <Go to ISI>://WOS:000296595800010 >.
MESSMER, R. et al. Drought stress and tropical maize: QTL-by-environment interactions and stability of QTLs across environments for yield components and secondary traits. Theoretical
and Applied Genetics, v. 119, n. 5, p. 913-930, Sep 2009. ISSN 0040-5752. Disponível em: <
<Go to ISI>://WOS:000269153000013 >.
MOLL, R. H.; KAMPRATH, E. J.; JACKSON, W. A. Analysis and Interpretation of Factors Which Contribute to Efficiency of Nitrogen-Utilization. Agronomy Journal, v. 74, n. 3, p. 562-564, 1982. ISSN 0002-1962. Disponível em: < <Go to ISI>://WOS:A1982NW34300036 >. MUSTILLI, A. C. et al. Arabidopsis OST1 protein kinase mediates the regulation of stomatal aperture by abscisic acid and acts upstream of reactive oxygen species production. Plant Cell, v. 14, n. 12, p. 3089-3099, Dec 2002. ISSN 1040-4651. Disponível em: < <Go to ISI>://WOS:000179936800010 >.
PARENTONI, S. N.; SOUZA JÚNIOR, C. L. Phosphorus acquisition and internal utilization efficiency in tropical maize genotypes. Pesquisa Agropecuaria Brasileira, v. 43, n. 7, p. 893-901, Jul 2008. ISSN 0100-204X. Disponível em: < <Go to ISI>://WOS:000258821200014 >. RAMAEKERS, L. et al. Strategies for improving phosphorus acquisition efficiency of crop plants.
Field Crops Research, v. 117, n. 2-3, p. 169-176, Jun 3 2010. ISSN 0378-4290. Disponível em:
< <Go to ISI>://WOS:000278304600001 >.
REMINGTON, D. L. et al. Structure of linkage disequilibrium and phenotypic associations in the maize genome. Proceedings of the National Academy of Sciences of the United States of
America, v. 98, n. 20, p. 11479-11484, Sep 25 2001. ISSN 0027-8424. Disponível em: < <Go to
ISI>://WOS:000171237100090 >.
RIBAUT, J. M.; RAGOT, M. Marker-assisted selection to improve drought adaptation in maize: the backcross approach, perspectives, limitations, and alternatives. Journal of Experimental
Botany, v. 58, n. 2, p. 351-360, Jan 2007. ISSN 0022-0957. Disponível em: < <Go to
14
SCHACHTMAN, D. P.; REID, R. J.; AYLING, S. M. Phosphorus uptake by plants: From soil to cell. Plant Physiology, v. 116, n. 2, p. 447-453, Feb 1998. ISSN 0032-0889. Disponível em: < <Go to ISI>://WOS:000072021600001 >.
SCHNABLE, P. S. et al. The B73 Maize Genome: Complexity, Diversity, and Dynamics. Science, v. 326, n. 5956, p. 1112-1115, Nov 20 2009. ISSN 0036-8075. Disponível em: < <Go to ISI>://WOS:000271951000044 >.
SETTER, T. L.; PARRA, R. Relationship of Carbohydrate and Abscisic Acid Levels to Kernel Set in Maize under Postpollination Water Deficit. Crop Science, v. 50, n. 3, p. 980-988, May-Jun 2010. ISSN 0011-183X. Disponível em: < <Go to ISI>://WOS:000276961900027 >.
SETTER, T. L. et al. Genetic association mapping identifies single nucleotide polymorphisms in genes that affect abscisic acid levels in maize floral tissues during drought. Journal of
Experimental Botany, v. 62, n. 2, p. 701-716, Jan 2011. ISSN 0022-0957. Disponível em: < <Go
to ISI>://WOS:000285625500024 >.
SHARPLEY, A. N.; MCDOWELL, R. W.; KLEINMAN, P. J. A. Phosphorus loss from land to water: integrating agricultural and environmental management. Plant and Soil, v. 237, n. 2, p. 287-307, Dec 2001. ISSN 0032-079X. Disponível em: < <Go to ISI>://WOS:000172862000010 >.
SHEN, J. B. et al. Phosphorus Dynamics: From Soil to Plant. Plant Physiology, v. 156, n. 3, p. 997-1005, Jul 2011. ISSN 0032-0889. Disponível em: < <Go to ISI>://WOS:000292294100003 >.
SHENOY, V. V.; KALAGUDI, G. M. Enhancing plant phosphorus use efficiency for sustainable cropping. Biotechnology Advances, v. 23, n. 7-8, p. 501-513, Nov 2005. ISSN 0734-9750. Disponível em: < <Go to ISI>://WOS:000232631900003 >.
TAIZ, L.; ZEIGER, E. Fisiologia Vegetal. Porto Alegre: Artmed, 2004. 719 p.
TAMBUSSI, E. A. et al. Oxidative damage to thylakoid proteins in water-stressed leaves of wheat (Triticum aestivum). Physiologia Plantarum, v. 108, n. 4, p. 398-404, Apr 2000. ISSN 0031-9317. Disponível em: < <Go to ISI>://WOS:000087013400009 >.
TARAMINO, G. et al. The maize (Zea mays L.) RTCS gene encodes a LOB domain protein that is a key regulator of embryonic seminal and post-embryonic shoot-borne root initiation. Plant
Journal, v. 50, n. 4, p. 649-659, May 2007. ISSN 0960-7412. Disponível em: < <Go to
ISI>://WOS:000246398400009 >.
TRAN, L. S. P. et al. Functional analysis of AHK1/ATHK1 and cytokinin receptor histidine kinases in response to abscisic acid, drought, and salt stress in Arabidopsis. Proceedings of the
National Academy of Sciences of the United States of America, v. 104, n. 51, p. 20623-20628,
15
TUBEROSA, R. et al. Mapping QTLs regulating morpho-physiological traits and yield: Case studies, shortcomings and perspectives in drought-stressed maize. Annals of Botany, v. 89, p. 941-963, Jun 2002. ISSN 0305-7364. Disponível em: < <Go to ISI>://WOS:000176402100015 >. UNITED STATES DEPARTMENT OF AGRICULTURE - USDA. World Agricultural Supply
and Demand Estimates. Office of the Chief Economist. 40. Disponível em:
www.usda.gov/oce/commodity/projections/. Acesso em 20 de setembro de 2015.
VANCE, C. P.; CHIOU, T. J. Phosphorus Focus Editorial. Plant Physiology, v. 156, n. 3, p. 987-988, Jul 2011. ISSN 0032-0889. Disponível em: < <Go to ISI>://WOS:000292294100001 >. VANCE, C. P.; UHDE-STONE, C.; ALLAN, D. L. Phosphorus acquisition and use: critical adaptations by plants for securing a nonrenewable resource. New Phytologist, v. 157, n. 3, p. 423-447, Mar 2003. ISSN 0028-646X. Disponível em: < <Go to ISI>://WOS:000181333500004 >. VERSLUES, P. E. et al. Methods and concepts in quantifying resistance to drought, salt and freezing, abiotic stresses that affect plant water status. Plant Journal, v. 45, n. 4, p. 523-539, Feb 2006. ISSN 0960-7412. Disponível em: < <Go to ISI>://WOS:000234919800005 >.
WEN, T. J. et al. The roothairless1 gene of maize encodes a homolog of sec3, which is involved in polar exocytosis. Plant Physiology, v. 138, n. 3, p. 1637-1643, Jul 2005. ISSN 0032-0889. Disponível em: < <Go to ISI>://WOS:000230414800042 >.
WISSUWA, M.; AE, N. Further characterization of two QTLs that increase phosphorus uptake of rice (Oryza sativa L.) under phosphorus deficiency. Plant and Soil, v. 237, n. 2, p. 275-286, Dec 2001. ISSN 0032-079X. Disponível em: < <Go to ISI>://WOS:000172862000009 >.
WISSUWA, M.; MAZZOLA, M.; PICARD, C. Novel approaches in plant breeding for rhizosphere-related traits. Plant and Soil, v. 321, n. 1-2, p. 409-430, Aug 2009. ISSN 0032-079X. Disponível em: < <Go to ISI>://WOS:000268192400017 >.
WISSUWA, M. et al. Substitution mapping of Pup1: a major QTL increasing phosphorus uptake of rice from a phosphorus-deficient soil. Theoretical and Applied Genetics, v. 105, n. 6-7, p. 890-897, Nov 2002. ISSN 0040-5752. Disponível em: < <Go to ISI>://WOS:000179685700012 >.
YU, J. M. et al. A unified mixed-model method for association mapping that accounts for multiple levels of relatedness. Nature Genetics, v. 38, n. 2, p. 203-208, Feb 2006. ISSN 1061-4036. Disponível em: < <Go to ISI>://WOS:000234953200015 >.
YU, J. M.; BUCKLER, E. S. Genetic association mapping and genome organization of maize.
Current Opinion in Biotechnology, v. 17, n. 2, p. 155-160, Apr 2006. ISSN 0958-1669.
16
ZHU, J. M.; KAEPPLER, S. M.; LYNCH, J. P. Mapping of QTL controlling root hair length in maize (Zea mays L.) under phosphorus deficiency. Plant and Soil, v. 270, n. 1-2, p. 299-310, Mar 2005a. ISSN 0032-079X. Disponível em: < <Go to ISI>://WOS:000230397000028 >.
ZHU, J. M.; KAEPPLER, S. M.; LYNCH, J. P. Mapping of QTLs for lateral root branching and length in maize (Zea mays L.) under differential phosphorus supply. Theoretical and Applied
Genetics, v. 111, n. 4, p. 688-695, Aug 2005b. ISSN 0040-5752. Disponível em: < <Go to
ISI>://WOS:000231313100008 >.
17
CAPÍTULO 1
Multi-environment QTL mixed models adjusted for phenological covariates for drought stress in tropical maize
C. A. G. Ribeiro, M. M. Pastina, L. J. M. Guimarães, L. Tomé, S. N. Parentoni, J. V. Magalhaes, E. G. de Barros, C. T. Guimaraes
C. A. G. Ribeiro
Departamento de Genética e Melhoramento, Universidade Federal de Viçosa, Viçosa, Minas Gerais, 36570-000, Brazil
E. G. de Barros
Programa de Pós-Graduação em Ciências Genômicas e Biotecnologia, Universidade Católica de Brasília, Brasília, Distrito Federal, 70330-710, Brazil
C. A. G. Ribeiro ∙ M. M. Pastina ∙ L. J. M. Guimarães ∙ L. Tomé ∙ S. N. Parentoni ∙ J. V. Magalhaes ∙ C. T. Guimaraes
18
Abstract
Selection of quantitative trait loci (QTL) for grain yield under water stress is still barely applied in breeding programs. This is mainly due to the high genetic complexity of this trait, which involves a large number of genes with high genetic background and environmental influences. In order to understand the genetic basis underlying the drought-related traits and their genotype-environment interaction, we performed QTL mapping using mixed models to analyze two tropical maize populations under two water regimes. Both mapping population were F2:3, derived from the cross
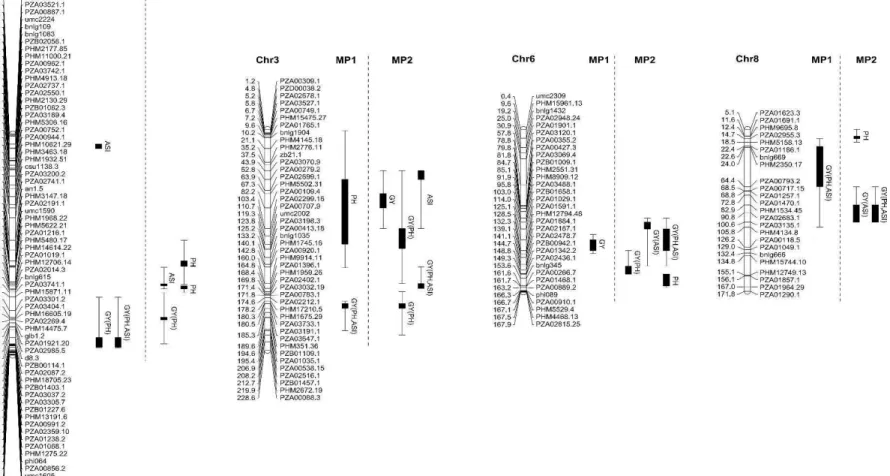
between the inbred lines L2321 x L31212 (MP1) and L1761121 x L521237 (MP2). Plant height and anthesis-silking interval were included as cofactors in the QTL model for grain yield, improving significantly the accuracy of the QTL mapping. Seventeen genomic regions were identified for grain yield with or without cofactors, additionally ten QTLs for plant height and seven for anthesis-silking interval was also detected in both mapping populations. Both parents in each cross contributed with favorable alleles. In the MP2, QTLs for anthesis-silking interval (ASI) on chromosomes 3, 4 and 9, bins 3.04, 4.05 and 9.04, respectively, were co-localized with QTLs for grain yield, except when ASI was used as cofactor, indicating the effect of phenological trait in the grain yield, probably due to common genetic factors in these regions. Additionally, four genomic regions on chromosomes 1, 3, 6 and 8 harbored QTLs for grain yield coincident in both populations, which were also consistently identified in other studies, showing a great potential for use in marker-assisted breeding and to search for candidate genes aiming to improve drought tolerance in maize.
19
Introduction
Maize (Zea mays) is the most produced cereal worldwide, and broadly used for human food and animal feed, as well as for many industrial purposes. Grain yield is widely affected by a range of abiotic stresses, highlighting drought as a major limiting factor (Cairns et al. 2013). Water stress occurs when the loss of water by plant exceeds the capacity of water absorption, causing irreversible damages to the plant, which ranges from mild to total yield losses (Jaleel et al. 2007). As the majority of maize is cultivated under rain fed conditions, its yield is highly affected by the climate changes, demanding drought tolerant genotypes (Ali et al. 2012; Lobell et al. 2014). Furthermore, with the constant increase of the world food demand, the agriculture has to be expanded to marginal areas, with an inadequate water supply, emphasizing the need for genetic improved varieties with the ability to withstand in water deficit conditions.
Drought tolerance is a complex trait, which is highly dependent on the evaluation methods (Blum 2005; Collins et al. 2008). Water deficit results in negative effects along the plant development, and different morpho-physiological mechanisms are involved in plant adaptation and yield stability under stress conditions (Lu et al. 2011). The root development is favored over shoot to increase the root expansion, reaching deeper soil layers under water deficit (Ribaut et al. 2009). Drought stress decreases the photosynthetic rates, compromising the accumulation of assimilates causing yield losses (Shah and Paulsen 2003). In maize, floral initiation, fertilization and grain filling are the most sensitive growth phases for drought stress to reduce grain yield (Grant et al. 1989; Ribaut et al. 1997; Messmer et al. 2009).
In breeding programs, secondary traits, highly correlated with yield have been used for indirect selection, due to the greater heritability under stress conditions. For example, plant height could reflect, at some level, the response to water deficit, being useful for indirect selection (Lu et al. 2012). Anthesis-silking interval (ASI) has been inversely correlated with drought tolerance in maize, with promising results for breeding purposes (Ribaut et al. 2004). The marker-assisted introgression of five quantitative trait loci (QTLs) reducing ASI in a maize elite inbred line sensitive to drought was efficient to improve grain yield under severe water stress, but no difference was detected at low levels of water deficit (Ribaut and Ragot 2007).
20
mapping in bi-parental populations is a useful approach to dissect and to understand the genetic components of complex traits (Hao et al. 2010). Several studies have reported QTLs for drought tolerance in maize (Agrama and Moussa 1996; Almeida et al. 2013; Malosetti et al. 2008; Messmer et al. 2011; Messmer et al. 2009), rice (Dixit et al. 2012; Lanceras et al. 2004; Venuprasad et al. 2012), sorghum (Harris et al. 2007; Sabadin et al. 2012), and wheat (Kadam et al. 2012; Mathews et al. 2008; Quarrie et al. 2005), among other crops. The phenotypic traits used in these studies were based on grain yield, plant height, ASI, root morphology, stay-green, osmotic potential and dry matter. Despite widely investigated, QTLs identified for grain yield in drought conditions are barely applied in marker-assisted breeding programs, mainly due to the high influence of genetic background and environmental interaction (Banziger et al. 2006; Beyene et al. 2015).
The genotype by environment interaction strongly counteracts in the identification of stable genomic regions controlling genetic factors of traits. QTLs detected for these complex traits often explain a small proportion of phenotypic variance, including epistatic interactions (Beyene et al. 2015; Mathews et al. 2008). Mixed models have becoming increasingly used in order to increase accuracy in QTL mapping (Mathews et al. 2008). This approach allows modeling heterogeneous (co)variances (VCOV) for genetic and residual effects, which consequently improves the accuracy and reliability in QTL detection and estimates their effects in multiple environments (Boer et al. 2007; Malosetti et al. 2008; Sabadin et al. 2012). Furthermore, phenological traits have been used as cofactors to control confounding effects in the detection of QTLs for grain yield under drought stress. One strategy is to use it as covariable in the phenotypic model as performed in wheat using ear emergence time (Bennett et al. 2012) and maize with anthesis date (Almeida et al. 2013). In the other hand, QTLs detected for phenological traits could be used in the QTL model as applied in sorghum, in which QTLs for plant height and flowering time were used as cofactors to detect QTLs for grain yield associated with drought tolerance (Sabadin et al. 2012).
21
Material and Methods
Plant material
Two F2:3 tropical maize biparental populations were developed at Embrapa Maize and
Sorghum for genetic mapping. The first mapping population (MP1) consisted of 97 F2:3 families
derived from the cross between the inbred lines L2321 (drought tolerant) and L31212 (drought sensitive). The second mapping population (MP2) consisted of 136 F2:3 families derived from the
cross between the elite inbred lines L1761121 (drought tolerant) and L521237 (drought sensitive).
Field experiments
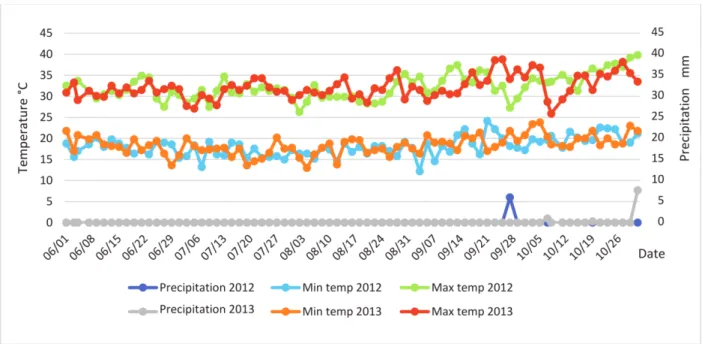
The experiments were conducted at Embrapa Maize and Sorghum experimental station, located in Janaúba, Minas Gerais state, Brazil (15°47’ S, 43°18’ W, 516 m). The MP1 was evaluated in two years 2006 and 2007 under well-watered (WW) and water-stress (WS). Field experiments for the MP2 were conducted in 2012 and 2013 under WS condition only. WW conditions were fully irrigated during the whole crop cycle with a drip irrigation system, and the soil moisture was monitored based on the gravimetric method in three different depths (0-10, 10-30 and 10-30-50cm). The WS condition was achieved through the complete interruption of irrigation at 15 days before flowering (tassel booting), which allowed soil moisture depletion during flowering and post-flowering time. All trials were conducted in a dark-red latosol from June to October during the rain-free period.
The experiments were conducted in a randomized complete block design with three replicates for MP1 in 2006, and in an alpha lattice design with three replicates in 2007. For MP2, the experiment consisted of three sets (trials) with 48, 47 and 47 F2:3 progenies each. Each trial
22
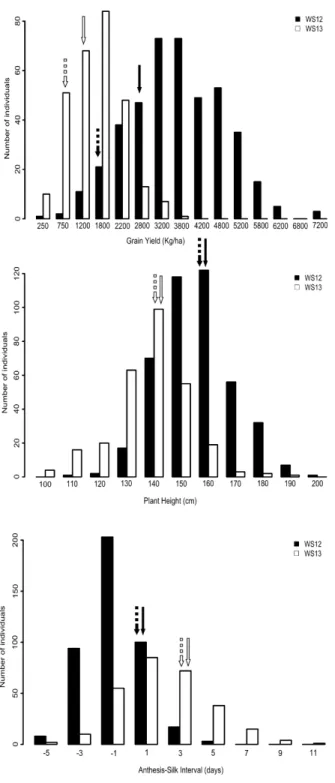
Plant height (PH) was measured as the distance from the ground surface to the top emerging leaf, based on a representative plant in each plot. Anthesis-silking interval (ASI), the difference between female and male flowering, was calculated as the number of days from the date of emerged silks on 50% of the plants in a plot minus the date that 50% of the plants with anther dehiscence in a plot (Bolanos and Edmeades 1996). For grain yield (GY), all grains of each plot were weighted and corrected for 13% of moisture, and converted to Kg ha-1. The number of plants per plot was used as covariate in the statistical models adjustment for GY.
Genotypic data and linkage map
Genomic DNA was isolated from young leaves using the cetyltrimethylammonium bromide (CTAB) method (Saghai-Maroof et al. 1984). A set of 271 markers comprising 51 microsatellites (Simple Sequence Repeats, SSR) and 220 SNPs (Single nucleotide Polymorphism) were genotyped in the MP1 and 311 SNP markers were used for MP2. The SSR amplification reactions consisted of 30 ng of genomic DNA; 10 µM Tris-HCl pH 8.0; HCl 50 µM, 2 µM MgCl2, 125 µM
of each deoxynucleotide (dNTP); and 0.4 µM of each primer and one unit (1U) of Taq DNA polymerase in a final volume of 10 µL. The amplification cycles were an initial denaturation at 95 °C for 2 min, nine cycles using with touchdown of 1 °C in annealing temperature per cycle at 94 °C for 20 s, 68 °C for 20 s and 72 °C for 20 s, followed by 25 cycles at 94 °C for 20 s, 60 °C for 20 s, and 72 °C for 20 s and a final extension at 72 °C for five minutes. The amplified fragment were visualized in 10% polyacrylamide gels (29:1 acrylamide:bisacrylamide) in TBE buffer (0.89 M Tris-HCl, 0.02 M boric acid, 0.02 M EDTA, pH 8.0). After 2 hours electrophoresis at 200 V, the gels were incubated under constant stirring for 15 minutes in a fixing solution (10% ethanol, 0.5% acetic acid), 15 minutes in 0.2% silver nitrate solution and transferred to revealing solution (3% NaOH, 0.5% formaldehyde) until the bands showed. The gel image was captured under white light using Eagle Eye II (Stratagene®). SNP markers were generated using Kompetitive Allele-Specific Polymerase chain reaction (KASP assay) in the LGC Genomics Inc. (Teddington, UK). The sequences, genetic and genomic locations of SSR and SNP markers are available at the Maize Genetics and Genomics Database (http://www.maizegdb.org/data_center/locus).
23
software (Lincoln et al. 1992), with a minimum logarithm of odds (LOD) of 3.0 and a maximum distance between adjacent markers of 40 cM. The Kosambi mapping function (Kosambi 1944) was used to convert the recombination fractions into map distances. The physical and genetic positions of each marker were used to confirm the marker order along the linkage groups.
Phenotypic data analysis
For each mapping population, a multi-environment mixed model analysis was performed for all evaluated traits. Thus, for MP1, the following model was used (random effects are underlined):
ijkl j i jk l j k j
ijkl e r b g
y
) ( ) ( ) (
where yijkl is the phenotype of the �ℎ individual ( = , … , I) in replicate ( = , … , K) of block
( = , … , L) within environment ( = , … , J); � is the overall mean; is the fixed effect of
environments; is the fixed effect of replicates within environment ; is the random effect of blocks within replicate of environment , assuming that the vector
has a multivariate normal distribution with zero mean and variance-covariance (VCOV) matrix ; is the random genetic effect of genotype at environment , assuming that the vector
has a multivariate normal distribution with zero mean and VCOV matrix
, in which denotes the Kronecker product of matrices, and is an identity matrix; and is the random non-genetic effect, assuming that the vector has a multivariate normal distribution with zero mean and VCOV matrix .
For MP2, the following model was used (random effects are underlined):
ijklm j i jkm l jm k j m j
ijklm e t r b G
y ( ) ( ) ( ) ( )
where yijklmis the phenotype of the �ℎ individual ( = , … , I) in replicate ( = , … , K) of block
( = , … , L), in the trial m ( = , … , M) within environment ( = , … , J); � is the overall
mean; is the fixed effect of environments; is the fixed effect of trial within environment ; is the fixed effect of replicates in the trial m , within environment ; is the random effect of blocks within replicate in the trial m of environment , assuming that the vector has a multivariate normal distribution with zero mean and
variance-j
e
) ( j k
r bl( jk)
) ,..., (
b b1(11) bL(JK)
J B ) ( j i g
)
,...,
(
11
g
IJg
g
G
J
I
n In ijkl
)
,...,
(
1111
IJKL
ε
J
R
j
e tm( j)
) ( jm k
r bl( jkm)
) ,...,
(
24
covariance (VCOV) matrix ; is the random genetic effect of genotype at environment . Genotypes can be separated in two groups:
= { = , … , �
� = � + , … , �+
where � is the number of genotypes in the progeny ( = , … , �), is the number of checks
( = , … , � + ), and = �+ . The vector has a multivariate normal
distribution with zero mean and VCOV matrix , in which denotes the Kronecker product of matrices, and is an identity (co)variance matrix; � represents a fixed effect for check within environment , and is the random non-genetic effect, assuming that the vector
has a multivariate normal distribution with zero mean and VCOV matrix . Although the effect of checks is not relevant for QTL mapping, its inclusion in the phenotypic model may help to control for non-genetic variation (Boer et al. 2007).
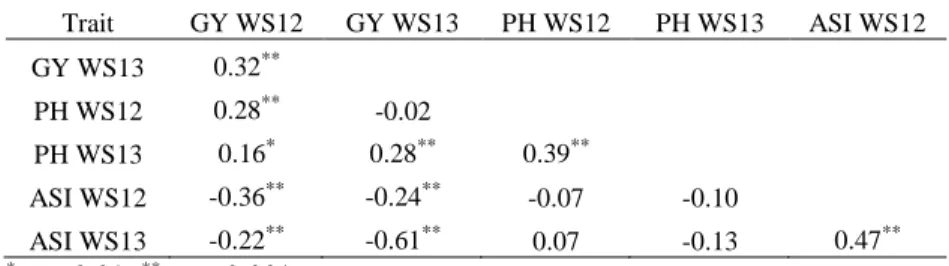
Pearson’s correlation coefficients were calculated to determine relationships between traits. Broad-sense heritabilities (ℎ2) on the individual plant basis were estimated based on single-environment analyses, through the variance components for genetic (��2), block (�2) and residual (��2 effects. Thus, the general formula was:
ℎ2 = ��2
��2 + �� 2+ ��2
Different variance-covariance (VCOV) structures for the matrix were compared via AIC (Akaike Information Criterion) (Akaike 1974) in order to identify the best model to fit phenotypic data in a mixed model framework across environments. Besides the identity matrix, which assumes homogeneity of genetic variances and no genetic correlation across environments, three different VCOV structures were also examined: i) Diagonal: heterogeneous genetic variances and no genetic correlations among environments; ii) Compound Symmetry: heterogeneous genetic variances and common genetic covariance across environments; and iii) Unstructured: heterogeneous genetic variances and specific covariances for each pair of environments. Similarly, different structures were also compared for the VCOV matrix of non-genetic residual effects ( ) to allow for residual heteroscedasticity as well as residual correlations between environments (Boer et al. 2007; Malosetti et al. 2008; Pastina et al. 2012). All models were fitted using Residual
J B Gi( j)
) ( j i
G i( j)
g
)
,...,
(
11
g
IJg
g
n
I
G
J
n I ijkl ) ,..., (11111 IJKLM
ε
R
JJ
G
J
25
Maximum Likelihood (REML) (Patterson and Thompson 1971) through software GenStat 16.1 (Payne et al. 2010).
QTL mixed model analysis
For the QTL mapping procedure, random genetic effects were regressed on genetic predictors representing functions of the conditional probabilities for the QTL genotype (Boer et al. 2007; Haley and Knott 1992; Jiang and Zeng 1997). Genetic predictors were estimated at all marker positions and at an additional grid of points with a maximum step size of 2.0 cM. The genotypic effect was partitioned into environment-specific additive and dominance QTL effects, and environment-specific residual genetic effect according to the equation:
where is the genotype ( = , … , �), is the environment ( = , … , J) and is the genomic position under evaluation, is the genetic predictor of the additive effect for individual i and position q, is the environment-specific additive QTL effect, is the genetic predictor of the dominance effect for individual i and position q, is the environment-specific dominance QTL effect, and represents the environment-specific genetic residual effect, after adjustment for the putative QTL effects. At marker positions, assumed the values +1, 0 and -1 and takes the values 0, 1, 0 for genotypes AA, Aa, and aa, respectively. QTL genotypes are not directly observable, but additive genetic predictor can be calculated from the difference of conditional probabilities of genotypes QQ and qq and their correspondent flanking markers: Pr(QQ|flanking markers) - Pr(qq|flanking markers). The dominance genetic predictor can be calculated based on the conditional probability for QTL genotype Qq and the flanking makers: Pr(Qq|flanking markers) (Jiang and Zeng 1997; Malosetti et al. 2008).
The mixed-model QTL mapping procedure consisted of four steps. In the first step, a phenotypic mixed model was fitted including the selected VCOV structures for and matrices based on the lowest AIC value. In the second step, an interval mapping (IM) approach (Lander and Botstein 1989) was performed to scan for environment-specific QTL effects along the genome. As described above, the molecular marker information was addressed to the mixed-model framework as genetic predictors. In the third step, based on the putative QTLs identified through
) ( * )
(j qj qj i j
i x x g
g
iq
iq
iq x qj iq x qj ) ( * j i g iq x iq x J26
the IM scan, a set of markers were selected to be included as cofactors in a multi-environment composite interval mapping model, CIM (Jansen and Stam 1994; Zeng 1994). Only the closest markers to the QTL peaks were used as cofactors, considering only one marker in a window size of 30 cM (centiMorgan). A genome-wide threshold ( ) of 0.01 was used to select putative QTLs in both IM and CIM models. At the final step, a multi-QTL mapping model including all putative QTLs identified through the CIM scan was fitted, and the statistical significance of QTL main and environment-specific effects was assessed via the Wald test, considering a significance level of 5%. All the QTL mapping analyses were performed in the software Genstat v.16 (Payne et al. 2009), using Residual Maximum Likelihood (REML).
The proportion of the genetic variance explained by all QTLs identified in a specific environment was estimated as: GV� = GV − GV�
GV X , where GV� is the total genetic variance
explained by all QTLs in the model, GV is the genetic variance of the reduced model, i.e. with no QTL effects, and GV is the genetic variance of the full model, including the whole set of QTLs. On the other hand, the genetic variance explained by each QTL was calculated as: GV �� =
(GV − GVGV �) X , where GV ��is the genetic variance explained by the QTL, and GV is the
genetic variance of the reduced model without the QTL effect.
The QTL mapping procedure described above was applied for GY, PH and ASI in both mapping populations. Furthermore, PH and ASI were included as fixed effect covariables in the QTL mixed models fitted for GY. The phenological traits were tested independently as covariables and in combination.
Results
Phenotypic data
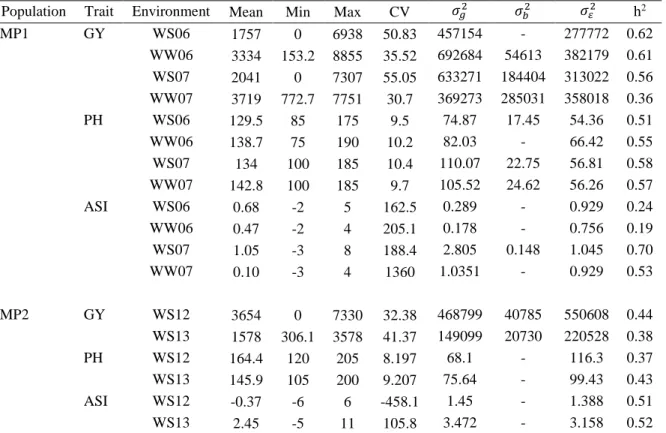
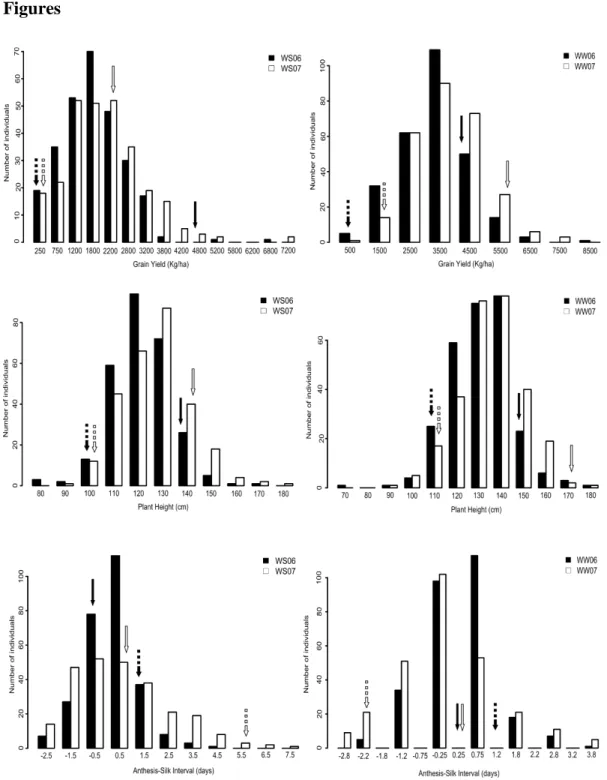
Phenotypic means, coefficient of variation, variance and heritability for GY, PH and ASI for both mapping populations are described in Table 1. The distribution of phenotypic data for each trait in each environment, as well as the phenotypic means of the parents are depicted in the histograms for both mapping populations, MP1 (Figure 1) and MP2 (Figure 2). The parental lines of MP1, L2321 and L31212, contrasted for GY, PH and ASI. The MP2 parents also contrasted for GY but presented a similar performance for PH and ASI under WS. As the MP2 parental lines are
27
elite breeding lines from Embrapa, the selection process culminated in less contrasting secondary traits, although phenotypic variations can be observed in the population. Variations in phenology are expected even if the parents of the mapping population do not show differences in the phenotypic means for the traits (Sabadin et al. 2012). Significant genetic variation in GY, PH and ASI were observed for both F2:3 mapping populations with moderate to high broad sense
heritability estimates.
In general, the mean values for all traits in MP1 were stable in both years, with an approximately 50% reduction in GY under WS compared to WW, ranging from 1,757 Kg.ha-1
(WS06) to 3,719 Kg.ha-1 (WW07). Heritability estimates for GY ranged from 0.36 (WW07) to 0.62 (WS06), whereas they were similar for PH under water-stress in 2006 (0.51) and 2007 (0.58). ASI presented low heritability estimates, 0.24 and 0.19 for WS06 and WW06 respectively, and a strong variation in the means, which ranged from 1.05 in WS07 to 0.1 in WW07 (Table 1). GY for MP1 was significantly correlated (p-value ≤ 0.001) among years and water regimes, varying from 0.29 to 0.54, with higher values for the same year or the water regime (Table S1). A similar correlation pattern was observed for PH, which ranged from 0.35 to 0.50 among environments. The correlations were lower (0.19 to 0.46) for ASI among environments, but significant between environments at 0.01 of probability, except for WW06 and WW07 (0.16). GY and PH were moderately correlated (p-value ≤ 0.001) within the same environments, and ASI was not significantly correlated with PH and GY, except with GY in WS07 (-0.32, p-value ≤ 0.001).
28
Multi-environment QTL analysis for MP1 (L2321 x L31212)
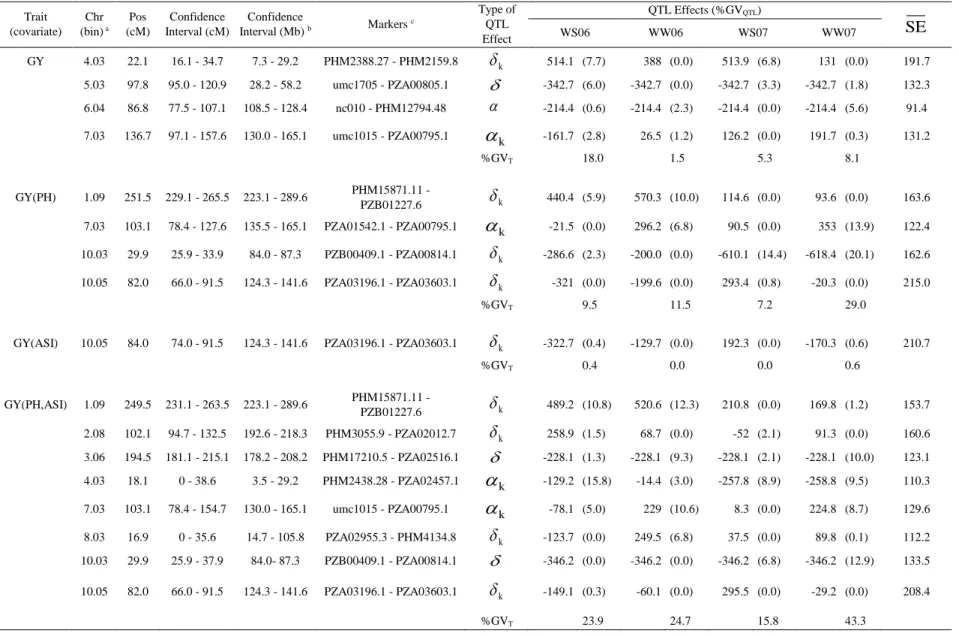
The genetic map constructed with 196 markers (166 SNPs and 30 SSRs) covered 1,816.8 cM of all 10 maize chromosomes with an average interval between adjacent markers of 9.8 cM. QTL analyses were carried out considering all four environments (WS06, WW06, WS07 and WW07) simultaneously for GY using PH and/or ASI as cofactors (Table 2 and Figure 3). An unstructured VCOV matrix associated to the genetic effects ( ) was selected based on AIC (Akaike 1974) for GY and an identity matrix the best structure for the non-genetic residual effects ( ). The inclusion of cofactors did not affect the chosen VCOV matrix. For PH the selected and matrices were an unstructured and a compound symmetry, respectively, and for ASI the selected matrix for was a compound symmetry and for a diagonal. The matrices properties are described in Material and Methods section.
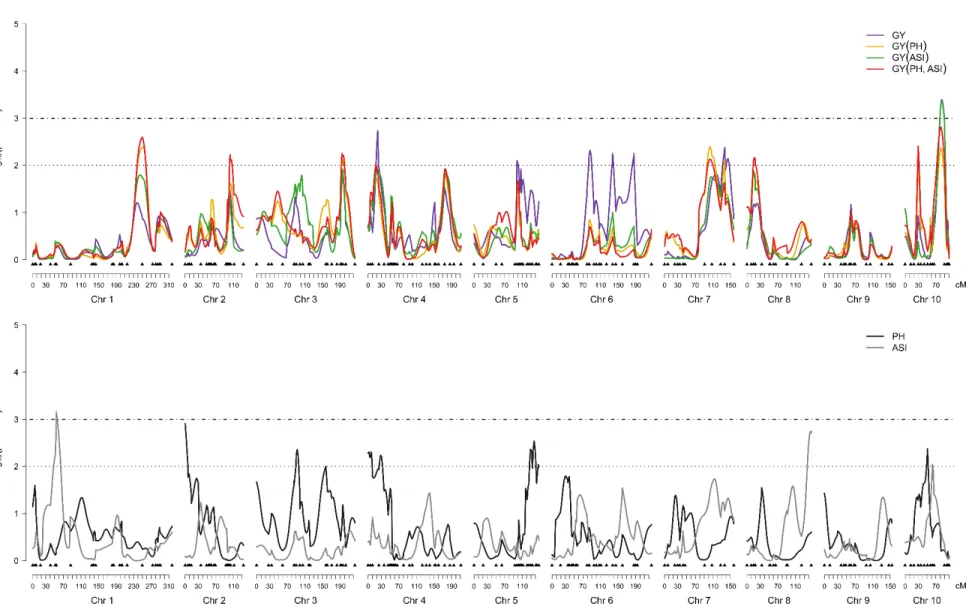
Eleven QTLs were identified for GY with and without the cofactors, whereas five QTLs were mapped for PH and two for ASI (Table 2 and Figure 3). Out of the four QTLs mapped for GY without cofactors (bins 4.03, 5.03, 6.04 and 7.03), the ones located at bins 4.03 and 5.03 mapped close to QTLs for PH, losing their significance when PH was used as cofactors in the mixed model. In the other hand, QTLs for GY mapped at bins 1.09, 7.03 (103 cM) and 10.03 were detected only when PH was included as cofactor, either alone or with ASI, and expressed environmental specific effects. The QTL associated with GY at bin 10.05 was also identified using all combinations of PH and/or ASI as cofactors and new QTLs for GY were mapped using both cofactors (bins 2.08, 3.06 and 8.03, Table 2 and Figure 3). The QTL for GY(ASI) at bin 10.05 was the most significant with -log10 (p-value) of 3.36, whereas the QTL for GY(PH) at bin 10.03
explained the highest percentage of variance in 2007 under both conditions. In general, the QTLs for GY expressed effects predominantly due to dominance deviations, exhibited a pronounced QTL x Environment interactions (QEI) and were derived from both parents. The inclusion of the cofactors allowed the identification of novel QTLs for GY, with a higher influence of the PH as cofactor compared to ASI.
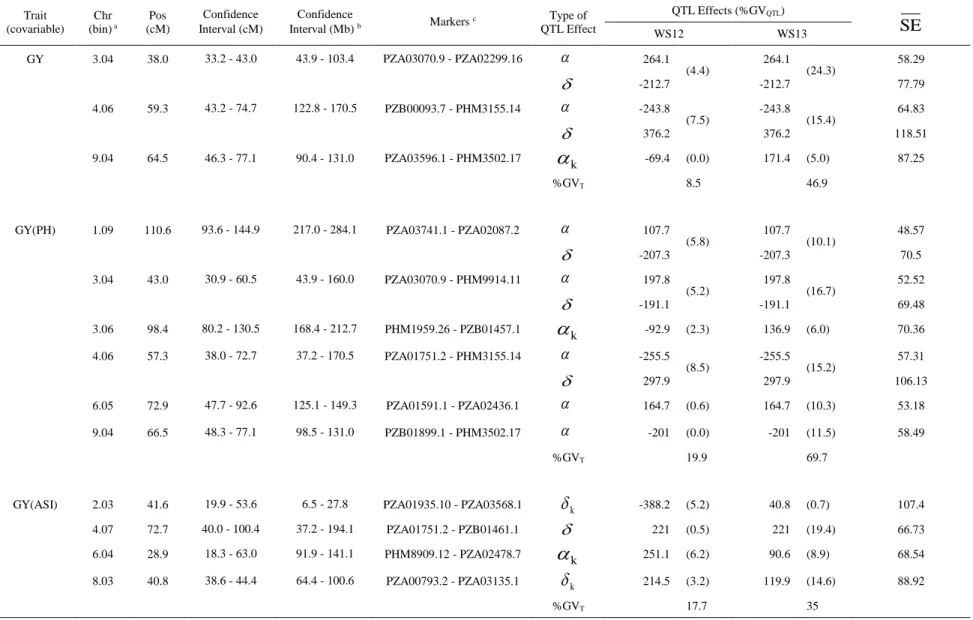
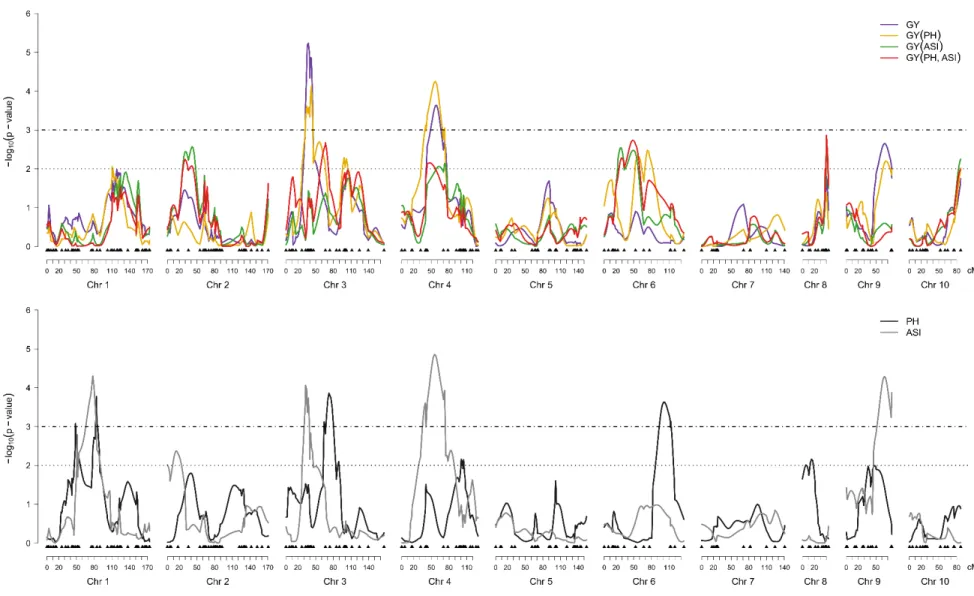
Multi-environment QTL analysis for MP2 (L1761121 x L521237)
The linkage map for the MP2 consisted of 267 SNP markers covering 1,277.2 cM of the maize genome with an average interval between adjacent markers of 5.0 cM. The VCOV matrices
J
G
J
R GJ
J
R
J