Genetic diversity analysis of common beans based on molecular markers
Homar R. Gill-Langarica
1, José S. Muruaga-Martínez
2, M.L. Patricia Vargas-Vázquez
2,
Rigoberto Rosales-Serna
3and Netzahualcoyotl Mayek-Pérez
41
Centro de Investigación en Ciencia Aplicada y Tecnología Avanzada, Unidad Altamira,
Instituto Politécnico Nacional, Altamira, México.
2
Instituto Nacional de Investigaciones Forestales, Agricolas y Pecuarias,
Campo Experimental Valle de México, Chapingo, México.
3
Instituto Nacional de Investigaciones Forestales, Agricolas y Pecuarias,
Campo Experimental Valle del Guadiana, Durango, México.
4
Centro de Biotecnología Genómica, Instituto Politécnico Nacional, Reynosa, México.
Abstract
A core collection of the common bean (Phaseolus vulgaris L.), representing genetic diversity in the entire Mexican holding, is kept at the INIFAP (Instituto Nacional de Investigaciones Forestales, Agricolas y Pecuarias, Mexico) Germplasm Bank. After evaluation, the genetic structure of this collection (200 accessions) was compared with that of landraces from the states of Oaxaca, Chiapas and Veracruz (10 genotypes from each), as well as a further 10 cultivars, by means of four amplified fragment length polymorphisms (AFLP) +3/+3 primer combinations and seven simple sequence repeats (SSR) loci, in order to define genetic diversity, variability and mutual relationships. Data un-derwent cluster (UPGMA) and molecular variance (AMOVA) analyses. AFLP analysis produced 530 bands (88.5% polymorphic) while SSR primers amplified 174 alleles, all polymorphic (8.2 alleles per locus). AFLP indicated that the highest genetic diversity was to be found in ten commercial-seed classes from two major groups of accessions from Central Mexico and Chiapas, which seems to be an important center of diversity in the south. A third group included genotypes from Nueva Granada, Mesoamerica, Jalisco and Durango races. Here, SSR analysis indicated a reduced number of shared haplotypes among accessions, whereas the highest genetic components of AMOVA variation were found within accessions. Genetic diversity observed in the common-bean core collection represents an impor-tant sample of the totalPhaseolus genetic variability at the main Germplasm Bank of INIFAP. Molecular marker strat-egies could contribute to a better understanding of the genetic structure of the core collection as well as to its improvement and validation.
Key words: Phaseolus vulgarisL., amplified fragment length polymorphisms (AFLP), germplasm bank, genetic relationships, simple sequence repeats (SSR).
Received: October 29, 2010; Accepted: August 8, 2011.
Introduction
Mexico is a major center in domestication and genetic diversity of the common bean (Phaseolus vulgarisL.) (Lo-gozzoet al., 2006), which, together with maize (Zea mays L.), constitutes the most important source of proteins in the Mexican diet, and comprises the basic daily meal for most people, countrywide. In Mexico, wild, weedy populations have been primarily considered as genetic sources for germplasm and cultivar development (Chacónet al., 2005). Nevertheless, domestication has caused genetic drift in populations planted in the primary domestication centers
(Gepts, 2004). Although selection based mainly on seed-class has reduced genetic diversity in cultivars developed in several production areas, variety in consumer preference has been of aid in its maintenance (Rosales Sernaet al., 2005). Common-bean cultivars originally arose from the domestication of multiple wild, weedy landrace popula-tions (Geptset al., 1986; Gepts and Bliss, 1986; Gepts and Debouck, 1991; Chacónet al., 2007). Concomitantly, ge-netic diversity is being maintained at the INIFAP Germplasm Bank located near Texcoco.
There are 7,846 accessions at the INIFAP common-bean Germplasm Bank. Previous attempts have been made to select and characterize representative samples. Notwith-standing, difficulties arose in the management of such a large number. Detailed crop evaluation of the numerous acces-sions is essential for creating small, representative and
man-www.sbg.org.br
Send correspondence to Netzahualcoyotl Mayek-Pérez. Centro de Biotecnología Genómica, Instituto Politécnico Nacional, Blvd Del Maestro s/n, Esq. Elías Piña, Col. Narciso Mendoza, 88710 Rey-nosa, México. E-mail: nmayek@ipn.mx.
ageable core collections, which, as thoroughly representative samples, would facilitate crop diversity characterization. Thus, a preliminary common-bean core collection was formed in 2004 to represent the complete diversity contained at the Bank. Manifold analyses and corrections were re-quired to maximize core collection representation and in-crease use in genetic breeding programs. Subsequently, in 2006, a subset consisting of 200 accessions was selected to represent all the common-bean holdings in the Bank. Finally, the core collection was formed by selecting accessions with differences in morphology, phenology, disease resistance and seed traits (culinary quality) (Vargaset al., 2006). Geo-graphical origin, by representing the 30 Mexican states where the beans are planted, was also considered. A higher cultivar number was included from states where they are tra-ditionally planted and domestication could have occurred, such as Jalisco (Payró-de la Cruzet al., 2005).
A complete understanding of the genetic diversity and population structure of the common bean is essential for its conservation and management, but limited germplasm char-acterization is a major challenge for systematic use of com-mon bean diversity in genetic breeding programs. Classical methods for characterizing genetic diversity in plants include the use of morpho-agronomic traits to establish genetic rela-tionships among commercial cultivars, landraces and wild rel-atives (Newbury and Ford-Lloyd, 1997). Several types of DNA markers, developed to study genetic diversity and crop evolution, are now considered to be better for documenting the organization of diversity, when compared to former meth-ods, such as morphologic markers (Charcosset and Gallais, 2002; Gaitán-Solíset al., 2002; Blairet al., 2009; Kwak and Gepts, 2009; Burleet al., 2010). Human-directed selection of common-bean populations has influenced crop evolution, with cultivars originating through domestication of adjacent areas now being conceived as showing higher mutual similar-ity than germplasm from distant regions. Differences have been found among populations from the southern (Mesoa-merica race), central (Jalisco race) and northern (Durango race) regions (Singhet al., 1991; Rosales-Sernaet al., 2005). Molecular characterization is required, not only to corroborate previous findings based on morpho-agronomic characteriza-tion, but also to increase the efficient use of germplasm for crop breeding. Molecular markers would also be beneficial to-wards improving representation in the core collection, by us-ing a reduced number of cultivars.
In this work, we report on the results of estimations of genetic diversity in the INIFAP common-bean core collec-tion, using AFLP and SSR, and their relationships with both landraces and cultivars.
Material and Methods
Germplasm
The INIFAP common bean core collection includes 200 accessions collected from 30 states of Mexico. 10
cultivars released by INIFAP were included, as well as 10 landraces from each state (Oaxaca, Veracruz and Chiapas) as out-groups. Germplasm was classified by geographic or-igin (state) (Table 1) and commercial-seed class (color) (Table 2) (Vargas et al., 2006; Vargas-Vázquez et al., 2008).
DNA extraction
Genomic DNA was isolated from completely ex-panded and young 15-day-old leaves (the first trifoliate leaf) of ten plants grown under greenhouse conditions, and then bulked by accession using the protocol of Dellaportaet
Table 1- Number of accessions identified in the INIFAP Mexican com-mon-bean core collection per state and commercial-seed class.
State Accessions Commercial-seed classes
Identification number
Chiapas 21 6 1-21
Jalisco 22 9 22-43
Aguascalientes 23 10 44-66
Coahuila 7 4 67-73
Veracruz 7 3 74-80
Tamaulipas 7 5 81-87
Puebla 16 9 88-103
Chihuahua 6 4 104-109
Durango 8 7 110-117
Hidalgo 8 6 118-125
Oaxaca 9 5 126-134
Zacatecas 14 9 135-148 Michoacán 7 5 149-155
Guerrero 6 3 156-161
Sinaloa 2 1 162, 163
Guanajuato 4 4 164-167 Baja California 2 2 168, 169 Estado de
México
4 3 170-173
Sonora 4 3 174-177
Nuevo León 1 1 178
Morelos 3 2 179, 180, 181
Yucatán 1 1 182
Nayarit 4 2 183-186
Querétaro 2 2 187, 188
Campeche 1 1 189
Tlaxcala 3 2 190, 191, 192 Colima 3 1 193, 194, 195 Baja California
Sur
1 1 196
Quintana Roo 1 1 197
San Luis Potosí 3 3 198, 199, 200
al. (1983). Since the common bean is a predominantly self-pollinating species, high levels of observable heteroge-neity were not expected.
AFLP analysis
AFLP analysis was according to Vos et al.(1995). Two restriction enzymes (EcoRI andPstI) were employed to digest the DNA, and four AFLP primer combinations to amplify selective fragments. Oligonucleotide primers used for the AFLP pre-amplification step wereEcoRI (EcoRI + A): 5’-AGACTGCGTACCAATTC/A-3’; andMseI (MseI + A): 5’-GACGATGAGTCCTGAGTAA/A-3’. Pre-amplification was followed by a second step of selective amplification with three selective nucleotides. The resul-tant products were separated by electrophoresis on 6% polyacrylamide gels, by using an automatic sequencing system (IR2 model; Li-Cor; Lincoln, NE, USA). Gel
read-ings and binary matrix construction were obtained using Cross Checker V2.9 software (Buntjer, 1999).
SSR analysis
Seven SSRloci(BM143, BM152, BM164, BM183, BM188, BM210 and GATs91) obtained from previously reported genomic sequences (Yuet al., 2000; Blairet al., 2006) were used for analyzing the entire core collection. PCR amplification was according to conditions reported by Yuet al.(2000) for each SSR. The reaction volume was 20mL, this consisting of 75 ng of DNA, 0.16mM of each
primer (sense and antisense), 2 mL of 10X PCR buffer,
1.5-2.5 mM of Mg (depending on the primer), 2 mM of dNTPs and 1 U of Taq DNA polymerase. Amplification products were separated on 6% polyacrylamide gels (1300 V for 2 h). Hyperladder V (Promega®) was used as the molecular weight-marker ladder, and PCR products
vi-Table 2- Number of accessions detected in the INIFAP Mexican common-bean core collection per commercial-seed class.
Commercial-seed classes Origin of accessions Identification number Red mottled (‘cacahuate’) Chiapas (3), Aguascalientes (2), Puebla (1) (1-3), (4, 5), (6) Purple (‘morado’) Chiapas (6), Jalisco (1), Aguascalientes (2), Oaxaca
(2), Zacatecas (3), Morelos (1), San Luís Potosí (1)
(7-12), (13), (14, 15), (16, 17), (18-20), (21), (22)
Black (‘negro’) Chiapas (7), Veracruz (5), Tamaulipas (2), Puebla (2), Estado de México (1), Durango (1), Hidalgo (1), Oaxaca
(3), Yucatán (1), Campeche (1)
(23-29), (30-34), (35, 36), (37, 38), (39), (40), (41), (42-44), (45), (46)
Marbling (‘jaspeado’) Chiapas (2), Jalisco (1), Aguascalientes (3), Coahuila (2), Puebla (1), Estado de México (1), Durango (1), Hidalgo (2), Zacatecas (2), Michoacán (1), San Luís Potosí (1), Oaxaca (1)
(47, 48), (49), (50-52), (53,54), (55), (56), (57), (58, 59), (60, 61), (62), (63), (64)
Yellow (‘amarillo’) Chiapas (2), Coahuila (1), Puebla (4), Durango (1), Sonora (1), Oaxaca (2), Zacatecas (1)
(65, 66), (67), (68-71), (72), (73), (74, 75), (76)
Cream (‘bayo’) Sinaloa (2), Jalisco (12), Guanajuato (1), Aguascalientes (7), Coahuila (2), Veracruz (1), Tamaulipas (2), Puebla (2), Chihuahua (2), Baja California (1), Durango (2), Hidalgo (1), Zacatecas (2), Nayarit (3), Michoacán (3), Tlaxcala (1), Colima (3), Guerrero (3), Baja California Sur (1)
(77, 78), (79-90), (91), (92-98), (99, 100), (101), (102, 103), (104, 105), (106, 107), (108),
(109, 110), (111), (112, 113), (114-116), (117-119), (120), (121-123), (124-126), 127
Brown-striped (‘ojo de cabra’) Jalisco (3), Veracruz (1), Chihuahua (2), Estado de México (2), Durango (1), Hidalgo (2)
(128-130), (131), (132, 133), (134, 135), (136), (137, 138)
Cream mottled (‘pinto’) Jalisco (2), Aguascalientes (1), Coahuila (2), Tamaulipas (1), Puebla (2), Sonora (2), Oaxaca (1), Zacatecas (1), Nuevo León (1), Michoacán (1)
(139, 140), (141), (142, 143), (144), (145, 146), (147, 148), (149), (150), (151), (152)
White (‘blanco’) Jalisco (1), Guanajuato (1), Aguascalientes (1), Tamaulipas (1), Puebla (1), Sonora (1), Quintana Roo (1)
(153), (154), (155), (156), (157), (158), (159)
White mottled (‘vaquita’) Jalisco (1), Guanajuato (1), Aguascalientes (1), Puebla (1), Durango (1), Zacatecas (1)
(160), (161), (162), (163), (164), (165)
Light purple (‘manzano’) Jalisco (1), Guanajuato (1), Baja California (1), Zacatecas (1), Michoacán (1)
(166), (167), (168), (169), (170)
Brown (‘café’) Aguascalientes (4), Puebla (2), Zacatecas (1), Morelos (2), Querétaro (1), Tlaxcala (2), Guerrero (2)
(171-174), (175, 176), (177), (178, 179), (180), (181, 182), (183, 184)
Pink (‘flor de mayo’) Aguascalientes (1), Chihuahua (1), Durango (1), Hidalgo (1), Nayarit (1), Querétaro (1), Guerrero (1)
(185), (186), (187), (188), (189), (190), (191)
sualized with a silver staining kit (Promega, Madison, WI, USA). Gels were documented for allele detection by way of the Kodak Molecular Imaging System v. 4.0 (Eastman Ko-dak, Rochester, USA). Raw allele size calls were then binned to assign a whole integred allele value using the AlleloBin software program (Idury and Cardon, 1997).
Data analysis
AFLP bands were numbered according to molecular weight one or zero being used to denote the presence or ab-sence of each fragment, respectively, whereas the level of polymorphism was expressed as a percentage, based on the number of polymorphic bands obtained from the total num-ber of fragments amplified with a marker (Table 3). SSR bands were also numbered according to molecular weight, and the number of alleles per locus determined with GenAlEx 6.0 software (Peakall and Smouse, 2006).
Both amplified bands by primer combination (AFLP) and frequencies of amplified alleles per locus (SSR) were applied to calculate the genetic diversity index (DI) (Nei, 1978). GenAlEx 6.0 was used to evaluate the average num-ber of alleles (A), effective numnum-ber of alleles (EA), poly-morphicloci(P) and polymorphiclocipercentage (%) in SSR loci, by way of accessions previously classified by commercial-seed class and geographical origin.
The 0/1 matrix of the AFLP markers was used for cal-culating genetic dissimilitude according to Nei (1978). Bootstrap was applied to corroborate the Neighbor-Joining dendrogram (Saitou and Nei, 1987) and to determine its ro-bustness. One thousand bootstrap replicates, obtained from the original data, were classified by commercial-seed class and geographical origin. All the calculations, as well as dendrogram construction, were carried out with a DARwin 5.0 (Perrier and Jacquemoud-Collet, 2006). Genetic dissi-militude, based on simple-matching dissimilarity mea-sures, was calculated with the amplified allele frequencies per SSR locus of all the accessions, prior to constructing a Neighbor-Joining dendrogram per commercial-seed class and geographical origin, followed by bootstrap for corrobo-ration.
Haplotype definition was with SSR data. Genetix 4.0 (Belkhiret al., 1996-2004) was used for converting
geno-type data into the file format used in Arlequin 3.11 (Excof-fier and Schneider, 2005), whence shared haplotypes were estimated. As the common bean is predominantly an autogamous species we considered the studied accessions as homozygous lines, whereby a haploid genome (Papa and Gepts, 2003) was assumed for data analysis. Finally, the similarity matrix was applied for hierarchical analysis of molecular variance (AMOVA) (Excoffieret al., 1992) us-ing Arlequin 3.11. Accessions were classified accordus-ing to geographical origin or commercial seed-class. In both cases, accessions were divided into three hierarchies, viz., groups (commercial-seed class or state of origin), acces-sions within groups and accesacces-sions. Genetic differentiation among hierarchies was defined based on FPTvalues, which
had been tested by 1000 permutations for significance in all analyses.
Results
Sixteen commercial-seed classes were visually iden-tified in the INIFAP preliminary core collection, with a variable number of accessions by state and seed class (Ta-bles 1 and 2). Seed-class diversity was higher in Aguasca-lientes (23 accessions with 10 seed classes), Jalisco (22 accessions with nine classes), Puebla (16 accessions with nine classes) and Zacatecas (14 accessions with nine classes). In those states with a higher number of commer-cial-seed classes, there was a tendency for more accessions. Chiapas was the exception, with a high number of acces-sions (21), but a low number of seed classes (6). The ‘cream’ class, encountered in 19 states, was represented by 51 accessions, ‘marbling’ in 12 states with 18 accessions, ‘black’ in 10 states with 24 accessions, and ‘cream-mottled’ in 10 states with 14 accessions.
AFLP analysis
530 reproducible AFLP bands were obtained by using four oligonucleotide combinations with 469 polymorphic bands (89%) (Table 3). Accessions from the core collec-tions of Jalisco, Aguascalientes and Oaxaca were the most diverse, with cream and brown seed genotypes presenting the highest DIs, and both landraces from the state of Oaxa-ca, and cultivars and accessions from Veracruz, the lowest. The low DIs also noted in gray (0.17), red mottled (0.18) and pink striped (0.18) accessions was probably due to the reduced number of accessions of these seed types (Tables 4 and 5). Significant genetic differentiation (p < 0.01) among accessions within groups and accessions was detected with AMOVA, only when germplasm was classified by geo-graphical origin (Tables 6 and 7).
SSR analysis
The highest number of allele (A) per locus, average number of alleles, and effective number of alleles were all observed in those states with the highest number of acces-sions, such as Aguascalientes, Jalisco and Chiapas. These
Table 3- AFLP primers, and number and percentage of polymorphic bands detected in the INIFAP common-bean core collection.
AFLP Amplified Products Polymor-phism (%)
EcoRI /MseI combination
Monomorphic Polymorphic Total
states, together with Puebla, presented the highest DI val-ues. The lowest values were found in germplasm from Guerrero, Tamaulipas, Veracruz, Coahuila, Hidalgo, Oaxa-ca and Michoacán (Table 4). The highest A, average num-ber of alleles, effective numnum-ber of alleles and DI were observed in cream, black and purple beans and the lowest in the gray, pink-striped and red (Table 5). Similar results were observed for EA, with corroboration of the lowest DI values in pink striped accessions. EA per SSR locus was seven, all of which polymorphic (Tables 4 and 5). Signifi-cant genetic differentiation (p < 0.01) among groups and within accessions was detected by AMOVA, when germplasm was classified by geographical and commercial seed classes. The highest genetic variance was found within populations (> 70%) (Tables 6 and 7).
Genetic diversity and relationships
The application of AMOVA to AFLP and SSR data indicated that most genetic variation occurred within acces-sions rather than among the other two hierarchies, viz., groups and accessions within groups, although a high per-centage of genetic variation did indeed occur among groups, when germplasm was analyzed with AFLPs as to the different origins of accessions. Nonetheless, FPTvalues
indicated genetic differentiation among groups and within
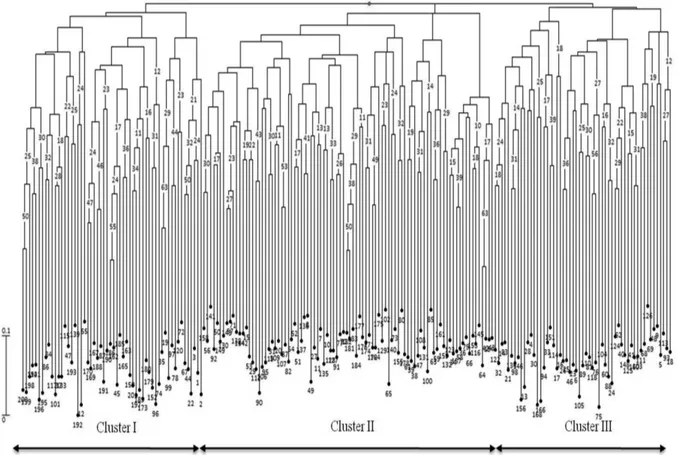
accessions, when germplasm was analyzed with SSR mark-ers, regardless of the geographical origin or commercial-seed class (Tables 6 and 7). Cluster analysis divided germplasm into three groups. For SSRs, the first group in-cluded accessions from southern and central Mexico (Chia-pas, Aguascalientes) commercial varieties, and landraces from Veracruz and Chiapas, whereas for AFLPs, it in-cluded landraces from Chiapas and Veracruz, and cultivars and germplasm from Chiapas and Tamaulipas. The second group was composed, not only of accessions from Jalisco, Aguascalientes, Tamaulipas, Chihuahua, Durango, Oaxaca and Zacatecas (SSRs), but also from southern (Chiapas), central (Aguascalientes, Jalisco) and northern (Chihuahua, Durango, Zacatecas) Mexico. The third group comprised accessions from the north (Zacatecas, Chihuahua, Duran-go) (SSRs), as well as those accessions from the north and landraces from Veracruz, which had been grouped sepa-rately from the other AFLPs (Figures 1 and 2). As regards commercial-seed classes, the first group included three types of seeds, which presented greater diversity in south-ern Mexico, namely red-mottled, purple and yellow (SSRs), as well as red-mottled, brown, black and brown-striped (AFLPs). The second group comprised accessions with cream, light-purple and brown-striped seed types (SSRs), as well as pink, yellow and light-purple (AFLPs). The third group included pink, cream, marbling, and cream mottled with black types (SSRs), as well as purple with marbling (AFLPs) (Figures 3 and 4).
Table 4- Diversity indices of the common-bean core collection, when us-ing SSR and AFLP data based on geographical origin.
States SSRs AFLPs
N* A EA DI DI
Chiapas 18 13.42 9.52 0.78 0.30 Jalisco 22 13.14 9.68 0.78 0.35 Aguascalientes 23 13.00 9.05 0.78 0.33 Coahuila 7 6.43 5.34 0.74 0.32 Veracruz 7 7.71 6.98 0.75 0.23 Tamaulipas 7 6.00 5.23 0.73 0.27 Puebla 15 11.00 8.97 0.79 0.31 Chihuahua 6 6.14 5.59 0.75 0.26 Durango 8 6.57 5.73 0.74 0.28 Hidalgo 7 6.29 5.75 0.77 0.27 Oaxaca 7 5.86 5.02 0.74 0.33 Zacatecas 13 8.86 6.77 0.75 0.30 Guerrero 6 6.57 6.10 0.74 0.26 Michoacán 7 6.14 5.62 0.76 0.32 Landraces Chiapas 10 7.57 6.22 0.78 0.26 Landraces Oaxaca 10 8.14 6.30 0.76 0.20 Landraces Veracruz 10 6.57 5.43 0.77 0.28 Cultivars 10 8.43 6.34 0.71 0.22 Total/Mean 193 8.21 6.65 0.76 0.28
*N = accession number, an = average number of alleles, en = effective number of alleles, DI = diversity index (Nei, 1978).
Table 5- Diversity indices of the common-bean core collection using SSR and AFLP data based on commercial-seed classes.
Discussion
High genetic diversity was detected in the INIFAP common-bean core collection, this diversity increasing, when the various geographical origins or seed types of the germplasm came under analysis. Germplasm diversity and variations in the number of accessions per state made it dif-ficult to establish an ideal balanced common-bean core col-lection. The thoroughness of this collection could be im-proved by using balanced samples from all the Mexican states, according to the number of accessions per state and commercial-seed class. Selection of an additional 200 ac-cessions is also possible, seeing that core collections could include 5 to 20% of the total collection (Gepts, 2006). Simi-lar results for diversity indices were found for both AFLP and SSR markers. The high polymorphism rates detected
with AFLPs could be useful for common-bean germplasm characterization. Polymorphism levels were high com-pared to previous reports on common beans when using RAPDs (Duarteet al., 1999; Beebeet al., 2000), although with AFLPs they were lower than with SSRs. SSR poly-morphism itself was either high compared to other reports (Gómez et al., 2004; Blair et al., 2006; Díaz and Blair, 2006; Rossi et al., 2009; Burle et al., 2010), or similar (Kwak and Gepts, 2009). The polymorphic SSR marker in the present study presented from 6 to 13 alleles, 8.21 per lo-cus on an average. In contrast, Blairet al.(2006) reported an average of 11 alleles per locus in an SSR analysis of a worldwide common-bean collection, whereas Blairet al. (2009) reported over 72 alleles in an SSR analysis, with an average of 18 alleles per locus, in an international collec-tion of common beans from Andean and Mesoamerican
Table 7- Analysis of molecular variance (AMOVA) of the common-bean core collection, grouped by commercial-seed class, with subsequent SSR and AFLP marker analysis.
Source of variation d.f. Sum of squares Variance components Total variance (%)
SSR-FST
Among groups 2 15.2 0.03 0.98 0.19
Among populations within groups
13 50.2 0.01 0.42 0.00
Within populations 184 1045.7 3.03 98.6 0.21
Total 199 1111.1 3.08 100.0
AFLP-jPT
Among groups 2 1129.0 7.2 7.7 0.00
Among populations within groups
13 1158.2 0.3 0.3 0.08
Within populations 184 15786.7 85.8 92.0 0.07
Total 199 18073.9 93.3 100.0
d.f. = degrees of freedom, SS = sum of squares, CV = components of variance. P values were significant (p < 0.01) for AFLPjPTand SSR FST.
Table 6- Analysis of molecular variance (AMOVA) of the common-bean core collection, grouped by geographical origin, and subsequently analyzed with SSR and AFLP markers.
Source of variation d.f. Sum of squares Variance components Total variance (%)
SSR-FST
Among groups 2 28.7 0.17 5.32 0.149
Among populations within groups
15 60.4 0.03 0.87 0.009
Within populations 370 1000.6 2.90 93.8 0.255
Total 387 1089.7 3.23 100.00
AFLP-jPT
Among groups 2 2336.8 31.7 26.5 0.032
Among populations within groups
15 1723.4 2.8 2.3 0.288
Within populations 174 14805.5 85.1 71.1 0.265
Total 192 18865.8 119.6 100.00
Figure 1- Neighbor-Joining dendrogram using SSR data from INIFAP common-bean core collection accessions classified by geographical origin. Values at the nodes indicate bootstrap values from 1000 replications. The scale represents the simple-matching dissimilarity coefficient.
Figure 3- Neighbor-Joining dendrogram using SSR data from INIFAP common-bean core collection accessions classified by commercial-seed class. Values at the nodes indicate bootstrap values from 1000 replications. The scale represents the simple- matching dissimilarity coefficient.
gene pools. The high diversity observed in cream (0.86 and 0.30 with SSR and AFLP data, respectively) and brown (0.81 and 0.30 with SSR and AFLP, respectively) seed ac-cessions could possibly be due to independent domestica-tion events with these commercial seed classes, as these seed-colors occur in numerous wild populations of the common bean in Mexico (Vargas-Vázquezet al., 2008). As these types of commercial classes are very popular with consumers in the central and western regions, bean-breeding has focused on developing cultivars with these grain-traits. In contrast, less diverse seed types resulted from localized domestication events. In both cases, con-sumer preference influenced selection in domestication, as well as grain-size, cooking traits and taste later on. The present results reinforce the theory of multiple domestica-tion centers (Chacónet al., 2005), and constant germplasm mobilization among producing regions from the south to-wards the center and vice versa. For example, an intensive breeding program in Mexico has been under way for more than 30-years, to develop new cream-seeded beans (‘azu-frados’) by using Andean gene-pool germplasm. Major re-sults include Andean x Mesoamerican gene-pool hybrids, the so-called ‘peruano’ beans, as well as cream-seeded ge-notypes from Mexican and Peruvian crosses (Voysest, 2000). Significant genetic differentiation among groups and within accessions was detected, the highest proportion of genetic variance being assigned to within-populations. The present results imply the poor or unclear genetic struc-ture in populations as originating from wild populations of the Andean gene pool, since, on using RAPDs, Cattan-Toupance et al. (1998) showed a much higher within-population variance component in germplasm from Argen-tina (> 67%), than that estimated by Papa and Gepts (2003) in wild and domesticated beans from the Mesoamerican gene pool of Mexico (from 44 to 58%), the more marked geographic structure of genetic diversity thus conditioning genetic differentiation. Germplasm with limited geograph-ical structure and less differentiation among populations and regions can result in a much higher within-population genetic-diversity component. These findings can be attrib-uted to the effects of seed exchange among farmers and ho-mogeneous selection in different environments (Papa and Gepts, 2003).
No shared haplotypes were found among the INIFAP common-bean core collection accessions, which contrasted with previous findings involving Jalisco and Durango races (Chacónet al., 2005; Díaz and Blair, 2006). This absence of shared haplotypes indicated careful genotype selection to construct a collection with high diversity. However, the present data need additional confirmation by means of an increased number of SSRloci, in order to obtain improved statistical support and to clearly assert that any accession is genetically distinct from any other from within the whole collection. Notwithstanding, both unique genotypes and the representativeness of each accession from all the regions
were corroborated. On using any marker strategy, relation-ships found between genetic diversity levels and number of accessions confirmed that in order to improve the thor-oughness of the INIFAP core collection, balanced acces-sion numbers based on classification criteria, such as com-mon-bean commercial-seed class or geographic region of origin, or both, are required. Increased representation could be obtained using the maximum number of alleles from each commercial-seed class or agro-ecological origin. To improve the core collection, the balanced selection of those classes with higher diversity, as well as the effective sam-pling of less diverse types, is required.
The high genetic diversity found within accessions makes it difficult to select representative accessions from each commercial-seed class. Variations observed among accessions within groups also need to be exploited for germplasm selection, and for broadening the genetic base in the common-bean core collection. The fixation indices AFLPPTand SSRFSTcould be used as additional tools for
germplasm selection, although SSR data should be inter-preted with caution, as only a few microsatellites were used for analysis. The high genetic diversity encountered in germplasm collected in central Mexico gives additional support to previous inferences, that domestication events took place thereabouts. The genetic complex found here could be a main source of diversity for the southern and northern regions. Germplasm dispersal from the Central Highlands was mainly directed towards the south, since similarities were observed in germplasm from these two re-gions. Easily observable differences were detected between some commercial-seed types from the north and germ-plasm collected in the Central highlands. Other commer-cial-seed types from the north revealed genetic similarities with germplasm from central and southern Mexico, most likely due to human migration and seed mobilization.
The genetic diversity observed in the common-bean core collection represents an important sample of the total genetic variability contained in the main INIFAP Germ-plasm Bank ofPhaseolus. Although significant genetic di-versity has been included in this collection, further analysis is required, this including defining genetic diversity within accessions and among commercial-seed classes, states and/or regions of origin, genetic races and gene pools. AFLP and SSR markers are important tools for a better un-derstanding of genetic relationships among accessions and germplasm, and for accession selection and construction, as well as validation, of the INIFAP core collection.
Acknowledgments
de Fomento a la Investigación Científica y Tecnológica CONACYT-Gobierno del Estado de Tamaulipas. H.R. Gill-Langarica is grateful to CONACYT-Mexico, Santan-der-Universia and PIFI-IPN for funding his Ph.D. studies at CICATA-Altamira, IPN. We are also grateful to M. Sc. S. Hernández-Delgado for suggestions for genetic analysis. H.R. Gill-Langarica, R. Rosales-Serna and N. Mayek-Perez (NMP) are S.N.I. fellows, and NMP is supported by COFAA and EDI-IPN scholarships.
References
Beebe S, Skroch PW, Tohme J, Duque MC, Pedraza F and Nienhuis J (2000) Structure of genetic diversity among com-mon bean landraces of Middle American origin based on correspondence analysis of RAPD. Crop Sci 40:264-273. Belkhir K, Borsa P, Chikhi L, Raufaste N and Bonhomme F
(1996-2004) GENETIX 4.05, logiciel sous Windows TM pour la génétique des populations. Laboratoire Génome, Populations, Interactions, CNRS UMR 5171, Université de Montpellier II, Montpellier.
Blair MW, Díaz LM, Buendia HF and Duque MC (2009) Genetic diversity, seed size associations and population structure of a core collection of common beans (Phaseolus vulgarisL.). Theor Appl Genet 119:955-973.
Blair MW, Giraldo MC, Buendia HF, Tovar E, Duque MC and Beebe S (2006) Microsatellite marker diversity in common bean (Phaseolus vulgarisL.). Theor Appl Genet 113:100-109.
Buntjer JB (1999) Cross Checker v. 2.91. Department of Plant Breeding, Wageningen University and Research Centre, Wageningen.
Burle ML, Fonseca JR, Kami JA and Gepts P (2010) Micro-satellite diversity and genetic structure among common bean (Phaseolus vulgaris L.) landraces in Brazil, a secondary center of diversity. Theor Appl Genet 121:801-813. Cattan-Toupance TL, Michalakis Y and Neema C (1998) Genetic
structure of wild bean populations in their South-Andean center of origin. Theor Appl Genet 96:844-851.
Chacón SMI, Pickersgill B and Debouck DG (2005) Domestica-tion patterns in common bean (Phaseolus vulgarisL.) and the origin of the Mesoamerican and Andean cultivated races. Theor Appl Genet 110:432-444.
Chacón SMI, Pickersgill B, Debouck DG and Arias JS (2007) Phylogeographic analysis of the chloroplast DNA variation in wild common bean (Phaseolus vulgarisL.) in the Ameri-cas. Plant Syst Evol 266:175-195.
Charcosset A and Gallais A (2002) Application of markers in se-lection. In: de Vienne D (ed) Molecular Markers in Plant Ge-netics and Biotechnology. Science Publishers, Enfield, pp 153-176.
Dellaporta SL, Woods T and Hicks JB (1983) A plant DNA mini preparation. Version II. Plant Mol Biol Rep 1:19-21. Díaz LM and Blair MW (2006) Race structure within the
Meso-american gene pool of common bean (Phaseolus vulgaris L.) as determined by microsatellite markers. Theor Appl Genet 114:143-154.
Duarte JM, Santos JB and Melo LC (1999) Genetic divergence among common bean cultivars from different races based on RAPD markers. Genet Mol Biol 22:419-426.
Excoffier LGL and Schneider S (2005) Arlequin v. 3.0: An inte-grated software package for population genetics data analy-sis. Evol Bioinform Online 1:47-50.
Excoffier L, Smouse PE and Quattro JM (1992) Analysis of mo-lecular variance inferred from metric distances among DNA haplotypes: Applications to human mitochondrial DNA re-striction data. Genetics 131:479-491.
Gaitán-Solís SE, Duque MC, Edwards KJ and Tohme J (2002) Microsatellite repeats in common bean (Phaseolus vulgaris): Isolation, characterization, and cross-species am-plification inPhaseolusssp. Crop Sci 42:2128-2136. Gepts P (2004) Crop domestication as a long-term selection
ex-periment. Plant Breed Rev 24:144.
Gepts P (2006) Plant genetic resources conservation and utiliza-tion: The accomplishments and future of a societal insurance policy. Crop Sci 46:2278-2292.
Gepts P and Bliss FA (1986) Phaseolin variability among wild and cultivated common beans (Phaseolus vulgaris) from Co-lombia. Econ Bot 40:469-478.
Gepts P and Debouck DG (1991) Origin, domestication, and evo-lution of the common bean (Phaseolus vulgarisL.). In: van Schoonhoven A and Voysest O (eds) Common Beans: Re-search for Crop Improvement. CAB Int., Wallingford, UK & CIAT, Cali, pp 7-53.
Gepts P, Osborn TC, Rashka K and Bliss FA (1986) Phaseolin protein variability in wild forms and landraces of the com-mon bean (Phaseolus vulgaris): Evidence for multiple cen-tres of domestication. Econ Bot 40:451-468.
Gómez O, Blair MW, Frankow-Lindberg B and Gullberg U (2004) Molecular and phenotypic diversity of common bean landraces from Nicaragua. Crop Sci 44:1412-1418. Idury RM and Cardon LR (1997) A simple method for automated
allele binning in microsatellite markers. Genome Res 11:1104-1109.
Kwak M and Gepts P (2009) Structure of genetic diversity in the two major gene pools of common bean (Phaseolus vulgaris L., Fabaceae). Theor Appl Genet 118:979-992.
Logozzo G, Donnoli R, Macaluso L, Papa R, Knupffer H and Zeuli PS (2006) Analysis of the contribution of Meso-american and Andean gene pools to European common bean (Phaseolus vulgarisL.) germplasm and strategies to estab-lish a core collection. Genet Resour Crop Evol 54:1763-1779.
Nei M (1978) Estimation of average heterozygosity and genetic distance from a small number of individuals. Genetics 89:583-590.
Newbury HJ and Ford-Lloyd BV (1997) Estimation of genetic di-versity. In: Maxted N, Ford-Lloyd BV and Hawkes JG (eds) Plant Genetic Conservation: The in situApproach. Chap-man and Hall, New York, pp 192-206.
Papa R and Gepts P (2003) Asymmetry of gene flow and differen-tial geographical structure of molecular diversity in wild and domesticated common bean (Phaseolus vulgarisL.) from Mesoamerica. Theor Appl Genet 106:239-250.
Payró-de la Cruz CE, Gepts P, Colunga P and Zizumbo D (2005) Spatial distribution of genetic diversity in wild populations of Phaseolus vulgaris from Guanajuato and Michoacán, México. Genet Resour Crop Evol 52:589-599.
Rosales-Serna R, Hernández-Delgado S, González-Paz M, Acosta-Gallegos JA and Mayek-Pérez N (2005) Genetic re-lationships and diversity revealed by AFLP markers in Mex-ican common bean bred cultivars. Crop Sci 45:1951-1957. Rossi M, Bitocchi E, Bellucci E, Nanni L, Rau D, Attene G and
Papa R (2009) Linkage disequilibrium and population struc-ture in wild and domesticated populations of Phaseolus vulgarisL. Evol Appl 2:504-522.
Saitou N and Nei M (1987) The neighbor-joining method: A new method for reconstructing phylogenetic trees. Mol Biol Evol 4:406-425.
Singh SP, Gepts P and Debouck DG (1991) Races of common bean (Phaseolus vulgarisFabaceae). Econ Bot 45:379-396. Vargas MLP, Muruaga JS, Acosta JA, Navarrete R, Pérez P, Esquivel G, Irizar MBG and Hernández JM (2006) Colec-ción Núcleo dePhaseolus vulgarisL. del INIFAP: Catálogo de Accesiones de la Forma Domesticada. Libro Técnico no. 10, SAGARPA-INIFAP-CIRCE, Campo Experimental Valle de México, Chapingo, 461 pp.
Vargas-Vázquez MLP, Muruaga-Martínez JS, Pérez-Herrera P, Gill-Langarica HR, Esquivel-Esquivel G, Martínez-Damián MA, Rosales-Serna R and Mayek-Pérez N (2008) Caracte-rización morfoagronómica de la colección núcleo de la
for-ma cultivada de frijol común del INIFAP. Agrociencia 42:787-797.
Vos P, Hogers R, Bleeker M, Reijans M, van de Lee T, Hornes M, Frijters A, Pot J, Peleman J, Kuiper M,et al.(1995) AFLP: A new technique for DNA fingerprinting. Nucleic Acids Res 23:4407-4414.
Voysest VO (2000) Mejoramiento Genético del Frijol (Phaseolus vulgaris L.): Legado de Variedades de América Latina 1930-1999. CIAT, Cali, 195 pp.
Yu K, Park J, Poysa V and Gepts P (2000) Integration of simple sequence repeat (SSR) markers into a molecular linkage map of common bean (Phaseolus vulgaris L.). J Hered 91:429-434.
Internet Resources
Perrier X and Jacquemoud-Collet JP (2006) Darwin software, http://darwin.cirad.fr/darwin (September 22, 2009).
Associate Editor: Dario Grattapaglia