Abstract— Emergency department (ED) is a unit in hospital
that provides treatment for acutely ill and injured patients 24 hours daily. As a system, ED reveals detailed and dynamic complexity of its interaction between inter-departmental units and intra-departmental elements. Discrete event simulation (DES) has been recognized with its ability to comprehend micro level problems with detailed complexity. From the macro level perspective, system dynamics (SD) has advantages over DES based on its holistic view capability that is able to capture the dynamic relationships between elements in a system. Both modeling approaches have strengths and weaknesses and therefore integrating both will provide amore realistic view of complex systems. This paper is based on an on-going study that uses computer simulation, a branch of Operation Research techniques in modeling an actual ED of a general hospital in Penang, Malaysia. We describe the potential benefits of integrating SD and DES in exhibiting both detailed and dynamic complexity of the ED. We propose a hybrid simulation framework with intent to better understand system’s behavior and how patient flow in the ED is influenced by capacity availability.
Index Terms— emergency department, discrete-event simulation, hybrid simulation, system dynamics
I. INTRODUCTION
Emergency departments all over the world are struggling to maintain service levels, as measured by patients’ waiting times in confronting the increased volume and constrained resources. As a consequence, administrators are looking and trying to find an effective way to provide a good match between supply and demand in emergency department (ED). However, the uncertainty of emergency demand makes the task of aligning demand with supply more complicated. The difference in demand and supply often builds up bottlenecks.
Paper submitted for review on March 23, 2012. This work was supported in part by the Universiti Sains Malaysia under the Post Graduate Research Scheme 1001/PJJAUH/844017.
Norazura Ahmad is with the School of Quantitative Sciences, CAS Universiti Utara Malaysia, 06010 Sintok, Kedah Malaysia, on study leave at School of Distance Education, Universiti Sains Malaysia, 11800 Pulau Pinang, Malaysia (phone:604-9286959; fax: 609-9246906; e-mail: norazura@ uum.edu.my).
Noraida Abdul Ghani is with the School of Distance Education , Universiti Sains Malaysia, 11800 Penang Malaysia (e-mail: [email protected]).
Anton Abdulbasah Kamil is with the the School of Distance Education , Universiti Sains Malaysia, 11800 Penang Malaysia (e-mail: [email protected]).
Razman Mat Tahar is with the Faculty of Technology Management, Universiti Malaysia Pahang, 26300 Gambang, Pahang Malaysia (e-mail: [email protected]).
In the ED, the key bottleneck is usually the resource or activity in treatment process that requires a patient to spend a longer time in the ED. It is vital to note that bottlenecks in ED sometimes originate from factors external to ED [1] because some of the resources are shared resources with other units in the hospital. Due to the diversity patient flows and interdependency with other units such as wards and labs, the use of analytical models that requires many assumptions and simplifications seems not practical for ED modeling. One effective approach to study the detail and dynamic complexity of ED problems is by developing a computer simulation model that could be used to understand the structure and behavior of the system. With this model, different consequences of alternatives can be explored and delays in process delivery can be avoided.
Since health care domain is typically complex and dynamics, many have argued the need of mixed-modeling approach to solve health care problems [2]-[4]. In health care, administrators are not only interested to track the status of individual entities but are also concerned on the impact of a unit to other units in a health care system. For instance, the ED admission process involves the complexities of relations between many parts in hospital. If a patient needs to be admitted, a bed is requested in the appropriate nursing unit. The availability of a bed is affected not only by the capacity of the relevant unit, but also by the admission of elective patients who compete for the same beds as emergency patients. Besides, much of the capacity required for ED operation is shared by other patients in the hospital and thus certain policies and procedures are necessary to allocate the resources among different group of patients.
ED modeling should demonstrate the detailed operational level as well as the relationships with other supporting units in hospital. This is where the discrete-event simulation (DES) and system dynamics (SD) modeling can fit in. Integration of both approaches will be able to grasp the detailed and dynamic complexity issues simultaneously [3]. The next section is dedicated to the discussion of ED modeling and previous works related to ED.
II. EMERGENCYDEPARTMENT(ED)MODELING
An ED is a medical treatment facility where injured or severely ill people come seeking for immediate treatment, either by their own means or by ambulance without prior appointment. Also known as accident and emergency department, this unit is a critical health unit where the battle between life and death is sometimes inevitable. With patients’ lives at stake, the concern of any ED in the world is to reduce the waiting time or length of stay of patients. The key to reduce the waits time is proper resource planning
Emergency Department Problems: A Call for
Hybrid Simulation
and allocation. However, most EDs run at or above full capacity on a daily basis.
The aging of our population and lack of places for affordable acute medical treatment will result in increasing number of attendances to ED of government hospitals. Many patients experience very lengthy waits before treatment and some may leave without being treated. Besides waiting times, other issues that relate to the ED are resource allocation and overcrowding. To mitigate this issue, a significant amount of research has been conducted in ED and some are briefly reviewed in this paper.
From literature, it is apparent that waiting time has become a frequent topic of investigation and often becomes one of the performance measures in ED modeling. For instance, [5] adopted a queuing theory approach to study the effect of waiting times to ED. However, in order to capture the complex behavior and stochastic nature of ED, many have applied computer simulation to address the waiting times problems [6], [7]. The developed models enabled ED staff to understand and review ED delivery process in order to determine effective strategy to resolve patients waiting time. These studies however focus solely on factors within the ED and neglected other external factors that affect ED performance.
An application of DES modeling to determine the impact of critical resources (beds, doctors and nurses) on key performances (queuing time and length of stay) has been discussed by [8]. Five scenarios were tested by altering the number of critical resources and removed impact of admission to ED process. The results show that 20% reduction of patients’ waiting time is obtained when admission blockage is removed. [9] discussed the application of simulation model in describing the operations in the ED of a special health care at Jyvaskyla, Finland. The study tested the impact of a triage-team method on key performances (waiting times and throughput time). Results from the model showed that the new triage approach was able to improve over 25% of the operations of the ED if implementation and all necessary tasks are properly considered. [10] described a different approach to improve the performance of ED. They proposed a multi-class queuing network model to increase the capacity of an ED to treat patients. They introduced a methodology to model across any patient mix, arrival volume and operational performance. Others have used simulation to estimate future capacity of new ED facilities or expansion of current ED [11].
There have been several excellent studies in ED using SD modeling [12]-[14]. [12] described several applications of system dynamics modeling to problems in the UK’s National Health System (NHS). One of the applications described in detail in the paper uses system dynamics to develop a better understanding of the interactions between the emergency care system and the social care system. [13] on the other hand focused on the micro level of the health care system by modeling patients’ flow at an ED to investigate the sensitivity of waiting time to hospital bed numbers. The developed model was used to explore scenarios which involved changes in bed capacity as well as in ED demand. [14] developed a high-level model of patients’ flows in the entire Nottingham health emergency care system. The model was useful in identifying the potential bottlenecks in the health care system and was
readily adopted by policy makers to test various policy scenarios.
It is interesting to contemplate on the vast applications of simulation in ED modeling. Perhaps one obvious reason is that ED is the front door of hospital for many public and therefore issues like waiting time and length of stay quickly become apparent to public. Since the system experts such as doctors and nursing staff are busy in providing adequate care, they do not have much time to study analytical models with complex numerical equations to determine the possible alternative solutions. Animation features embedded in simulation model have advantages over the analytical techniques and thus motivate the adoption of simulation among health care researchers in ED modeling. However this does not mean that successful ED simulation models are easy to develop [15].
There are a few simulation approaches in healthcare such as discrete-event simulation (DES), system dynamics (SD), Monte Carlo simulation and agent based approach [16]. However this paper only discusses two main streams of simulation, DES and SD that are capable to demonstrate the operational level of ED and high level view of interactions between ED, ambulance, labs and wards. They are many distinctions between both approaches, which are briefly discussed in the next section.
III. DES AND SD:AN OVERVIEW
It is well known that the use of DES modeling is widely established in manufacturing and business environment [17]. DES is concerned with the modeling of systems that can be represented by series of events at discrete time intervals. It is a stochastic modeling approach grounded on queuing theory where movement of entities in queuing system is governed by probability distributions. Entities in the system flow around a network of services or processes and may have characteristics which determine their trail through the network. DES allows the modeler to create entities with necessary human traits such as age, gender, marital status and mode of arrival. These aspects are typically seen in patients who are seeking various treatments in hospital system.
DES permits one to track the status of individual entities in a system and compute performance measures associated with the entities. The tracking is done by focusing on times at which the various events occur. In DES modeling great emphasis is given on the effect of random variation. Such stochastic effects are not considered in analytical models and even less important in SD models. Another advantage of DES is the animations and graphics visualization embedded in software packages. The animation section has enhanced its visual interactivity. This makes DES as an ideal tool to communicate with healthcare administrators. The animations provide justification for factual figures and help in better understanding of the system. All of these appealing facts may contribute to the increasing practice of DES in healthcare modeling.
to study problems that are not looking into what happens on individual patient or staff in hospital.
SD modeling begins with the identification of causal factors that affect the performance of a system. Once identified, the causal factors are drawn in diagrams to reveal the relationship between each factor. The diagrams are known as Causal Loop diagrams and it is then translated to Stock-Flow diagrams. A causal diagram consists of variables that are connected by arrows denoting the causal relationship between the variables. Feedback and unanticipated effects of key elements in the system is basis to understand the dynamic complexity of the system [16]. The graphical description of the system based on Stock-Flow diagrams can be translated into a mathematical description. Only Stock-Flow diagrams are formulated to simulation model. Further information on the diagrams is discussed in detail by Sterman [18].
SD approach as introduced by J.W. Forrester in the late of 1950s, gives real insights of how the system behaves in the short and longer period [19]. Moreover, SD offers qualitative and quantitative aspect to enhance understanding of system behavior [20]. Besides, unlike other traditional analysis that studies a problem by separating and solving it into smaller parts, SD methodology involves a broader view to create a better understanding of the big picture by looking at possible interaction among subsystems. The holistic view offered by SD will portray the complexity and dynamic in emergency service when surge in demand happens and will also show the impact on other units in hospital if changes are made in ED.
IV. THEPROPOSEDMODEL
A. System model description
The ED understudy is open 24 hours every day a week and receives an average of 1563 patients weekly. As positioned in a general hospital the ED is equipped with many clinical facilities and resources, which makes it a busy health department serving patients in the northern part of the country. As an integrated system, ED also depends on the efficiency displayed by each of the subunit that is involved in ED operations. Therefore the interrelation between ED and other subunits is crucial and must be understood in order to maintain shortest waiting time and length of stay.
The process flow begins with patient arrival. Patients arrive either by ambulance or as walk in cases. Regardless of mode of arrival, the arriving patient stops at a registration counter for registration. At the same time a medical assistant will triage the patient. However, critical patients will be sent directly to the critical area and bedside registration will be performed at a later time by the registrar.
Once triaged, the patient moves to the waiting area and wait to be called for treatment. If there is availability of a doctor, the patient moves to thetreatment area and sees the doctor. Delay of doctor to patient contact depends on severity of illnesses. Doctors will decide if the patient needs further tests such as clinical lab tests or X-rays. Results obtained will be reviewed by doctors and decision is made upon the results. Some patients will be observed temporarily in ED’s observation ward before release for discharge.
Discharged patients can either be released to go home or sent to hospital wards for further treatment.
B. The Framework
ED is an area that is difficult to show a well-defined boundary around the modeled system [16]. Therefore it requires a whole system approach. However, as many decisions in ED are made based on individual attributes, ED administrators also require an approach that is able to demonstrate patients’ status and estimate performance measures associated with available resources. To be able to do so, the integration of DES and SD modeling can be applied. Interrelations between ED and other units in the hospital are evaluated using SD, while DES is used to capture the operational level inside the ED. Output from DES model will be passed down to SD model to study the feedback effects of elements in the system.
In order to capture the detailed and dynamic complexity of ED, the methodological process for this research consists of a two-stage framework (Fig. 1).
Fig 1. The two-stage framework
Stage 1 is the initial stage of the study that requires sufficient comprehension on the problems understudy. Problems in the ED were identified by communicating with the system head. Then, several observations were made to understand patient flows in the ED. Interviews with administrators and staffs regarding process flows of the department were also carried out. Next, after obtaining a clear view of the system understudy, a set of objectives was established to alleviate problems in the ED. At this stage, the objectives that can be achieved using a DES model, SD model or by both were identified. Comparisons were made between DES and SD from modeling perspective and system perspective before deciding on the use of a single technique or hybrid approach.
The implementation of Stage 2 depends on the outcome from Stage 1. Based on objectives in Stage 1, variables were identified and divided into DES and SD model. Next, both models were developed based on DES modeling steps and SD modeling steps. At this phase format interactions between both models were identified. The models were run in parallel and concurrently with information exchanged between both models while running. Once the models are completed, several tests including qualitative validation were performed before model implementation. Validation were carried out with participation from ED administrators to increase the confidence in the developed model among the system owners.
software package were used to create both DES and SD models.
C. The DES model
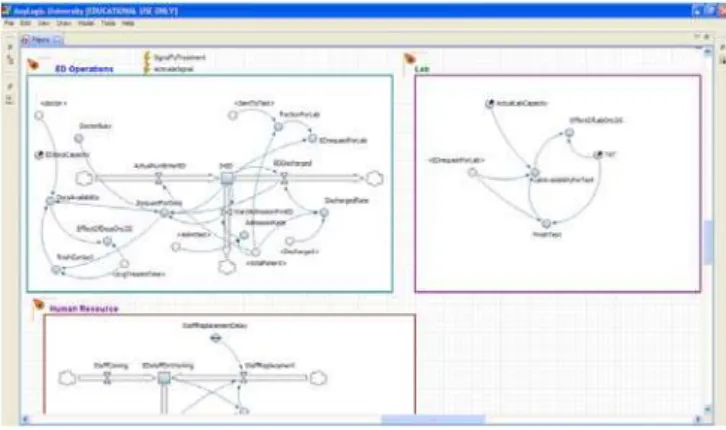
Fig.2 shows a graphical summary of the ED model.
Fig.2. A summary of the ED model
Based on Fig. 2 the system state at a given time t can be viewed as a tuple
( p, pg, py, pr, g, y, r)t where
p = the number of patients at registration counter
pg = the number of patients in the Green Zone queue
py = the number of patients in the Yellow Zone queue
pr = the number of patients in the Red Zone queue
g = the number of patients in the Green Zone
y = the number of patients in the Yellow Zone
r = the number of patients in the Red Zone
At a minimum, the relevant types of events to prescribe changes of state in the summary model are
1. arrival of patient at the registration counter (or their queue) at time t ( AP, t, patient),
2. end of registration process for patient at time t ( ER,
t, patient)
3. patientg enter Green Zone at time t ( EG, t, patientg) 4. patienty enter Yellow Zone at time t ( EY, t, patienty
)
5. patientr enter Red Zone at time t ( ER, t, patientr ) 6. triaged Green patient depart the system at time t
(DG, t, patientg)
7. triaged Yellow patient depart the system at time t
(DY, t, patienty)
8. triaged Red patient depart the system at time t (DR,
t, patientr)
Fig. 3 shows a screen shot of the ED model logic.
Fig. 3. A part of DES model logic
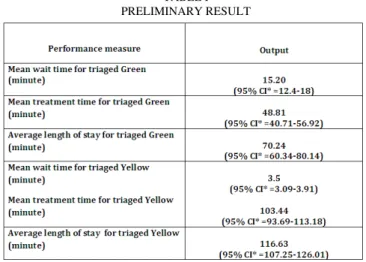
The model is run 12 times for seven day replication length. Historical figures disclose that on weekdays between 5 to 6 am, there were less than five patients in the system. Therefore, instead of using a warm-up period, the model is started in an empty state. The simulation clock is started at weekdays at 5 am. Result from the 12 replications is compared to actual 12 weeks data that record the number of arrivals and number of patient in each triage zone. Preliminary results from the DES model reveal that an average of 1613 patients visits the ED per week. Of the average total patients, 89.77% were triaged as Green, 9.3% were triaged as Yellow and less than 1% were triaged as Red.
On resource utilization, medical assistants score the highest utilization with an average of 70%. This result parallels the administration’s claim that medical assistants are usually the busiest resources because they assist doctors in treatment processes and also serve for ambulance services. For room utilization, waiting area has highest value, which is 70%. As for Green triaged patients, results also reveal that they wait on average approximately 15 minutes to see the doctors and spend around an hour in the system. On the other hand, for Yellow triaged patients, the mean wait time is 3.5 minutes and the average length of stay is 103.44 minutes (refer TABLE I).
TABLE I PRELIMINARY RESULT
D. The SD model
affect ED services are human resources, lab tests/X-ray, ambulance and wards. The principle objective of the SD model is to determine the impact of each factor to ED operations. We would like to investigate whether sharing resources between the treatment process and ambulance service affect ED performance. We also want to identify if turnaround times between ED and labs increase the length of stay in the system.
For each of the sector, causal loop diagrams that act as the dynamic hypothesis for SD model construction were developed and converted into formal computer model. Fig. 4 shows a screen shot of the SD model logic. Some of the inputs in this model were obtained from DES model. For instance, information on the number of patient visits in the ED was passed down from the DES model to the SD model. SD model uses the number of patient visits in the ED as input for inflow to compute stock of number of people in the ED.
Fig. 4. A part of SD model logic
At the current stage, the Parsimonious principle [21] is used in modeling the ED. Instead of modeling the whole system completely, we begin with one sector followed by gradual extensions to another sectors. The logic is that if we are able to validate the first sector, then the model can be easily extended to include other sectors with details of the model added. However, a drawback of this principle is that it is time-consuming. At this time, the sectors have been constructed. However, only two sectors have been validated with the ED administrators. Thus much more work is needed before achieving a reliable hybrid simulation model.
V. CONCLUSION
This paper describes an on-going work of a hybrid simulation model for an ED. The SD part is on validating process and thus only result from DES model is presented. Results from the DES model only portray the operational activities in the ED. The results will be passed down to SD model to capture the interrelations between ED and other supporting units. Once the SD and DES models are completely integrated, we hope to see a bigger picture of ED system with detailed operational outputs. The hybrid model will also permit us to inspect the impact of sharing resources between ED and other units in the hospital.
REFERENCES
[1] E. M. W. Kolb, T. Lee and J. Peck, “Effect of Coupling between Emergency Department and Inpatient Unit on the Overcrowding in Emergency Department,” in Proceedings of the 2007 Winter Simulation Conference, USA, 1586-1593.
[2] T. Eldabi, R. J. Paul and T. Young, “Simulation modelling in healthcare: reviewing legacies and investigating futures. Journal of
the Operational Research Society, vol 58, no. 2, pp. 262-270, 2007.
[3] K. Chahal and T. Eldabi, “Applicability of hybrid simulation to different modes of governance in UK healthcare,” in Proceedings of
the 2008 Winter Simulation Conference, pp.1469-1477.
[4] S. C. Brailsford, S. M. Desai and J. Viana, “Towards the holy grail: Combining system dynamics and discrete-event simulation in Healthcare,” in Proceedings of the 2010 Winter Simulation
Conference, pp.2293-2303.
[5] J. T.Blake, M. W. Carter and S. Richardson, “An analysis of emergency room wait time issues via computer simulation,” INFOR vol. 34, no. 4, pp. 263-273, 1996..
[6] S. Mahapatra, C.P. Koelling, L. Patvivatsiri, B. Fraticelli, D. Eitel and L. Grove, “Pairing Emergency Severity Index5-level Triage Data with Computer Aided System Design to Improve Emergency Department Access and Throughput, in Proceedings of the 2003 Conference on
Winter Simulation, 1918–1925.
[7] S. Takakuwa and H. Shiozaki, “Functional Analysis for operating emergency department of a general hospital,” in Proceedings of the
2004 Winter Simulation Conference, USA, pp. 2003-2011.
[8] A. Komashie and A. Mousavi, “Modeling emergency departments using discrete event simulation techniques,” in Proceedings of the
2005 Winter Simulation Conference, pp. 2681–2685.
[9] T. Ruohonen, P. Neittaanmaki, and J. Teittinen, “Simulation model for improving the operation of the emergency department of special health care,” in Proceeding of the 2006 Winter Simulation
Conference, 453-458.
[10]J. K. Cochran and K. T. Roche, “A multi class queuing network analysis methodology for improving hospital emergency department performance,” Computers and operation research, vol. 36, pp. 1497-1512, 2009.
[11] F. F. Baesler, H. E. Jahnsen and M. DaCosta, “The use of simulation and design of experiments for estimating maximum
capacity in an emergency room,” in Proceedings of the 2003 Winter Simulation Conference, USA.
[12] G. Royston, A. Dost, J. Townshend and H. Turner, “Using system dynamics to help develop and implement policies and programmes in health care in England,” System Dynamics Review, vol. 15, pp.
293-313 , 1999.
[13] D. C. Lane, C. Monefeldt and J. V. Rosenhead, “ Looking in the wrong place for healthcare improvements: A system dynamics study of an accident and emergency department,” Journal of the
Operational Research Society, vol. 51, no. 5, pp. 518-531, 2000.
[14] S. Brailsford, V. A. Lattimer, P. Tarnaras and J. C. Turnbull, “Emergency and on-demand health care: Modelling a large complex system,” Journal of the Operational Research Society, vol. 55, no. 1, pp. 34-42, 2004.
[15] S. Brailsford, L. Churilov, and S.K. Liew, “ Treating Ailing Emergency Departments with Simulation: An Integrated Perspective,”. Available: http://www.scs.org/scsarchive/getDoc.
cfm?id=2025.
[16] S. C. Brailsford, “Tutorial: Advances and challenges in healthcare simulation modeling, “ in Proceedings of the 2007 Winter Simulation
Conference, USA, pp. 1436-1448.
[17] J. Kuljis, R. J. Paul and L. K. Stergioulas, “Can health care benefit from modeling and simulation methods in the same way as business and manufacturing has?” in Procedings of the 2007 Winter Simulation
Conference, pp. 1449-1453.
[18] J. Sterman, Business dynamics: System thinking and modeling for
a complex world. Boston, USA: The McGraw Hill, 2000.
[19] A. Ford, Modeling the Environment: An Introduction to System
Dynamics Models of Environmental Systems. Washington DC:
Island Press, 1999.
[20] V. Lattimer, S. Brailsford, J. Turnbull, P. Tarnaras, H. Smith, S. George, K. Gerard, and S. Maslin-Prothero, “Reviewing emergency care systems I: insights from system dynamics modeling,” Emergency
Medical Journal, vol. 21, pp. 685-691, 2004.