Self-regulating Exploration for Orthologous
in Homologous Hematologic Gene Sequence
Data Using UPGMA Method
Bipin Nair B J #1, Sujith M *2, Alphonsa M V #3
1, 2, 3
Department of Computer Science 1, 2, 3
Amrita School of Arts and Sciences, Mysuru Campus 1, 2, 3
Amrita Vishwa Vidyapeetham, Amrita University, India 1 [email protected] 2 [email protected] 3 [email protected]
Abstract— There are several distinct tools to identify orthologous gene sequence from homologous gene sequence. Identification of orthologous gene is a major issue, and it is found that orthologous genes are responsible for any genetic disorders. In this paper we are focusing on hematologic disorders and found that orthologous genes are primary actor of haematological disorders. Here we present a novel approach to explore orthologous genes in homologous hematologic gene sequence data and discover the relationship between hematologic genetic disorders through phylogenetic tree reconstruction using UPGMA (Unweighted Pair Group Method with Arithmetic Mean) method.
Keywords - Paralogous gene, Orthologous gene, Phylogenetic tree, UPGMA method
I. INTRODUCTION
Genes are elements of heredity that is transferred from parents to offspring. Homologous genes are genes that share common ancestor; these homologous genes are classified into two orthology and paralogy [1]. Orthologs are homologous gene which is emerged during speciation event. Paralogs genes are homologous genes which are emerged during gene duplication. Orthologs is used to understand gene function computationally while paralogs are mostly used to study function innovation. There are different methods used to study function innovation. There are different methods used to infer orthology and paralogy. Identification of orthologs inference methods can be classified into two main types’ graph-based methods and tree based methods. Tree based phylogenetic approach aims to differentiate speciation from gene duplication by comparing gene trees, and our proposed system is based on tree based method [2].
Blood is critical factor for life. It is one which carries oxygen and nutrients to each part of the body. Blood also fights infections and heals injuries in our body. Therefore, disorders of the blood can have consequence on one health. This is also known as hematologic disorder [3]. Blood is made up of different kinds of cells and proteins. Blood disorder can affect one among four components that is Red blood cells, White blood cells, Platelets and Plasma [4]. Many blood disorders are inherited. Since we are focusing on orthologous genes, we could find that orthologous genes are the main cause for hematologic genetic disorders [5]. These disorder genes are distributed unevenly among human chromosomes and are highly represented among human-rodent orthologous sets. Here we present a novel method to find the association between those disorders through phylogenetic tree reconstruction. This phylogenetic tree reconstruction is used for the understanding of evolutionary record of species and species traits. Tree reconstruction faces many challenges due to gene replications and harms.
Various works have done in the orthologous genes [6], but till date no one has attempted to find the evolutionary relationship of hematologic genetic disorders. We hope that our research work helps in getting better understanding about it. We propose a method to efficiently calculate the phylogenetic tree and give a better visualization and classification of hematologic blood proteins.
II. OVERVIEW
III.PROBLEMSTATEMENT
Disorders that affect blood are called as hematologic disorders. There are certain disorders affecting genetically which transfers from one generation to next. Blood protein sequence changes lead one disorder to another disorder. There are works under haematological disorders, but till date no work was attempted to find the evolutionary relationship between different hematologic disorder and find how one blood protein sequence differ from other.
IV. PROPOSEDWORK
The proposed work is focused on finding the evolutionary relationship between different haematological genetic disorders through phylogenetic tree construction. Tree construction is based on UPGMA method.
The proposed work performs
(1) Gathering of different haematological blood protein sequences. (2) Finding the orthologous gene from the haematological blood protein. (3) Classify each disorder
(4) Perform UPGMA method (5) Construct phylogenetic tree
(6) Visualization of the Phylogenetic tree
V. UPGMAMATRIXCALCULATION
Each element in UPGMA is called as TAXA. In our work Hematologic blood protein is taxa. UPGMA Pseudo Code,
Step 1: Identify the minimum distance between any two taxa Step 2: Combine these two taxa as a single pair
Step 3: Re-calculate the average distance between this pair and all other taxa to form a new matrix Step 4: Find the closest pair in the new matrix
Step 5: Continue the methods, until the last two clusters are joined
VI.PHYLOGENETICTREECONSTRUCTION
A phylogenetic tree is a graphical depiction of the evolutionary relationship among entities that share a common ancestor. So here the construction is based on the sequence distance between each blood disorders. After the final step of UPGMA algorithm we will get sequence distance between each blood disorders. So based on the distance we can analyse the sequence distance between those blood disorders.
VII.DATASET
Initially the dataset is Hematologic blood protein sequence. So through UPGMA method we will get the sequence distance among the blood proteins. Through that we can construct the phylogenetic tree. The protein sequence will change according to the disorder. Below Fig 1 shows some sample dataset for hematologic blood protein sequence.
VIII. EXPERIMENTALRESULT
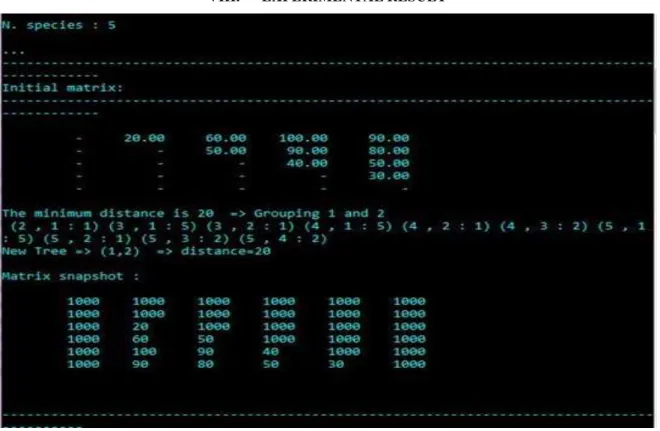
Fig 2. Initial matrix
Here we have initial matrix with sequence distance between various hematologic blood proteins. By applying UPGMA algorithm, the minimum distance is 20 then combines those two blood proteins and re-calculate the average distance between those two pairs and all other taxa to form a new matrix.
Fig 3. UPGMA Step 1
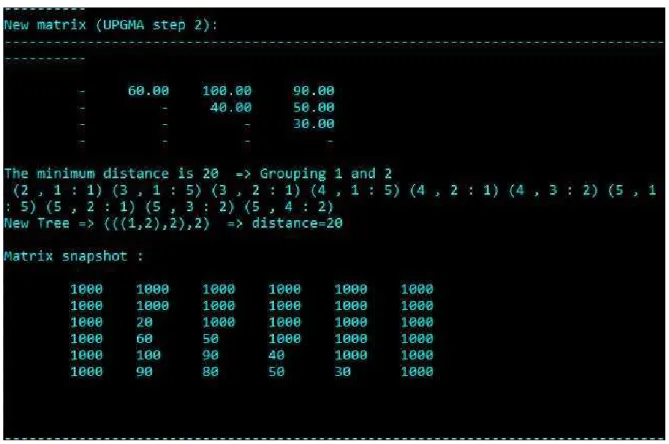
Fig 4. UPGMA Step 2
Identify the closest pair in the new matrix. Combine those pairs as a single pair and re- calculate the matrix.
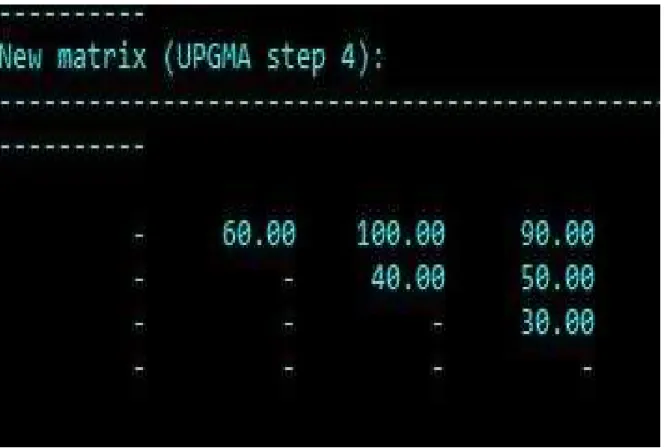
Fig 5. UPGMA Step 3
Fig 6. Final matrix
This is the final matrix; this indicates the sequence distance between each blood proteins. Based on this final result the phylogenetic tree will be generated.
Here we are showing the evolutionary relationship between various hematologic genetic disorders. Initially we have the sequence similarity distance values between hematologic genetic disorders like Myeloid, Haemophilia, Lymphoma, Anaemia and Leukaemia. Moving towards upper through the tree the sequence distance is increasing. Here Myeloid has the minimum distance 1.39 units. So this tree depicting the evolutionary relationship between these disorders.
IX.CONCLUSION
Phylogenetic tree depicts the evolutionary relationship among entities. Here through UPGMA Algorithm we are constructing the matrix to show the sequence similarity distance among hematologic blood protein sequence. Based on the sequence distance value it automatically generates the phylogenetic tree. Through that phylogenetic tree we can analyse the evolutionary relationship among the Hematologic genetic disorder such as Myeloid, Haemophilia, Lymphoma, Anaemia and Leukaemia.
REFERENCES
[1] Storm, C. E., & Sonnhammer, E. L. (2002). Automated Ortholog inference from phylogenetic trees and Calculation of orthology reliability. Bioinformatics, 18(1), 92-99.
[2] Chiu, J. C., Lee, E. K., Egan, M. G., Sarkar, I. N.,Coruzzi,G.M.,& DeSalle, R. (2006). OrthologID: automation of genome-scale ortholog identification within a parsimony framework. Bioinformatics, 22(6), 699-707.
[3] Alexeyenko, A., Tamas, I., Liu, G., & Sonnhammer, E.L. (2006). Automatic clustering of orthologs and Inparalo shared by multiple proteomes. Bioinformatics, 22(14), e9-e15.
[4] DeLuca, T. F., Wu, I. H., Pu, J., Monaghan, T., Peshkin, L., Singh, S., & Wall, D. P. (2006). Roundup: a multi-genome repository of orthologs and evolutionary distances. Bioinformatics, 22(16), 2044-2046.
[5] Moreno-Hagelsieb, G., & Latimer, K. (2008). Choosing BLAST options for better detection of orthologs as reciprocal best hits. Bioinformatics, 24(3), 319-324.
[6] Arvestad, L., Berglund, A. C., Lagergren, J., & Sennblad, B. (2003). Bayesian gene/species tree reconciliation and orthology analysis using MCMC. Bioinformatics, 19(suppl 1), i7-i15.
[7] Yosef, N., Sharan, R., & Noble, W. S. (2008). Improved network-based identification of protein orthologs. Bioinformatics, 24(16), i200-i206.
[8] Forslund, K., & Sonnhammer, E. L. (2009). Benchmarking homology detection procedures with low complexity filters. Bioinformatics, 25(19), 2500 2505.
[9] Mahmood, K., Konagurthu, A. S., Song, J., Buckle, A. M., Webb, G. I., & Whisstock, J. C. (2010). EGM: encapsulated gene-by-gene matching to identify gene orthologs and homologous segments in genomes.Bioinformatics, 26(17), 2076-2084.
[10] Dessimoz, C., Gabaldón, T., Roos, D. S., Sonnhammer, E. L., & Herrero, J. (2012). Toward community standards in the quest for orthologs.Bioinformatics, 28(6), 900-904.
[11] Kim, K., Kim, W., & Kim, S. (2011). ReMark: an automatic program for clustering orthologs flexibly combining a Recursive and a Markov clustering algorithms. Bioinformatics, 27(12), 1731-1733.
[12] Curtis, D. S., Phillips, A. R., Callister, S. J., Conlan, S., & McCue, L. A. (2013). SPOCS: software for predicting and visualizing orthology/paralogy relationships among genomes. Bioinformatics, btt454.
[13] Li, Y. I., & Copley, R. R. (2013). Scaffolding low quality genomes using orthologous protein sequences. Bioinformatics, 29(2), 160-165.
[14] Wong, K. C., & Zhang, Z. (2014). SNPdryad: predicting deleterious non-synonymous human SNPs using only orthologous protein sequences. Bioinformatics, btt769.
[15] Jiang, R., Yang, H., Sun, F., & Chen, T. (2006). Searching for interpretable rules for disease mutations: a simulated annealing bump hunting strategy. BMC bioinformatics, 7(1), 1.
[16] Dufayard, J. F., Duret, L., Penel, S., Gouy, M., Rechenmann, F., & Perrière, G. (2005). Tree pattern matching in phylogenetic trees: automatic search for orthologs or paralogs in homologous gene sequence databases. Bioinformatics, 21(11), 2596-2603.
[17] Peterson, M. E., Chen, F., Saven, J. G., Roos, D. S., Babbitt, P. C., & Sali, A. (2009). Evolutionary constraints on structural similarity in orthologs and paralogs. Protein Science, 18(6), 1306-1315.
[18] Chen, R., & Jeong, S. S. (2000). Functional prediction: identification of protein orthologs and paralogs. Protein Science, 9(12), 2344-2353.
[19] Cannon, S. B., & Young, N. D. (2003). OrthoParaMap: distinguishing orthologs from paralogs by integrating comparative genome data and gene phylogenies. BMC bioinformatics, 4(1), 35.
[20] Chiu, J. C., Lee, E. K., Egan, M. G., Sarkar, I. N., Coruzzi, G. M., & DeSalle, R. (2006). OrthologID: automation of genome-scale ortholog identification within a parsimony framework. Bioinformatics, 22(6), 699-707.
AUTHOR PROFILE
Bipin Nair B J has completed his MCA from Amrita Vishwa Vidyapeetham, Amrita University, B.Sc. Industrial Chemistry and PG diploma in Medical Biochemistry from Kerala University. Now he is working as Lecturer, Department of Computer Science, Amrita Vishwa Vidyapeetham, Amrita University, Mysuru Campus.
Sujith M is currently pursuing MCA from Amrita Vishwa Vidyapeetham, Amrita University, Mysuru Campus and he has completed his BCA from Amrita Vishwa Vidyapeetham, Amrita University, Mysuru Campus.