Patel Umang J et al. IRJP 2012, 3 (9)
Page 203
INTERNATIONAL RESEARCH JOURNAL OF PHARMACY
www.irjponline.com ISSN 2230 – 8407
Research Article
SPECTROPHOTOMETRIC METHOD FOR SIMULTANEOUS ESTIMATION OF EPERISONE HYDROCHLORIDE AND DICLOFENAC SODIUM IN SYNTHETIC MIXTURE
Patel Paresh U, Patel Sejal K, Patel Umang J*
Department of Quality Assurance, S. K. Patel College of Pharmaceutical Education and Research, Ganpat University, Ganpat Vidyanagar – 384012, Mehsana, Gujarat, India
Article Received on: 18/07/12 Revised on: 09/08/12 Approved for publication: 12/09/12
*Email: [email protected]
ABSTRACT
The present manuscript describes simple, sensitive, rapid, accurate, precise and economical spectrophotometric method for the simultaneous determination of diclofenac sodium and Eperisone hydrochloride in bulk and synthetic mixture. The method is based on the simultaneous equations for analysis of both the drugs using methanol as solvent. Diclofenac sodium has absorbance maxima at 281 nm and Eperisone hydrochloride has absorbance maxima at 255 nm in methanol. The linearity was obtained in the concentration range of 2-20 μg/ml and 2-20 μg/ml for diclofenac sodium and Eperisone hydrochloride, respectively. The concentrations of the drugs were determined by using simultaneous equations at both the wavelengths. The mean recovery was 100.03 ± 0.16 and 99.81 ± 0.82 for diclofenac sodium and Eperisone hydrochloride, respectively. The method was successfully applied to laboratory prepared synthetic mixture because no interference from the mixture excipients was found. The suitability of this method for the quantitative determination of diclofenac sodium and Eperisone hydrochloride was proved by validation. The proposed method was found to be simple and sensitive for the routine quality control application of diclofenac sodium and Eperisone hydrochloride in combination. The results of analysis have been validated statistically and by recovery studies.
KEY WORDS: Diclofenac sodium, Eperisone hydrochloride, Recovery, Simultaneous equations method, Validation.
INTRODUCTION
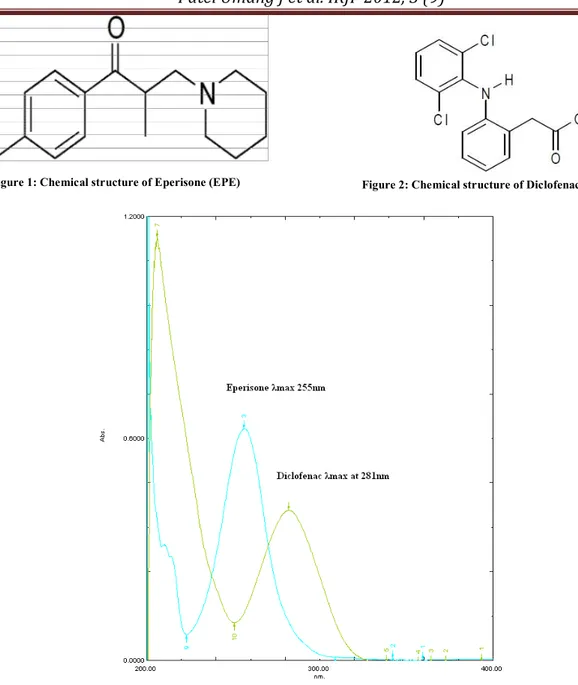
Eperisone (EPE) is chemically 4-ethyl-2-methyle-3-piperidinopropiopenone (Figure 1) is a well known antispasmodic drug1. It is official in Japanese Pharmacopoeia (JP). JP2 describe potentiometric method for its estimation. Literature survey reveals Electron spray Ionization Mass Spectroscopy for determination of Eperisone in human plasma.3 The use of HPLC/MS, GC/MS, NMR, UV and IR to Identify Degredation product of eperisone hydrochloride in the the tablets.4, Diclofenac sodium (DIC) is chemically 2-[2,6dichlorophenylamino] benzene acetic acid sodium salt5 (Figure 2). Diclofenac sodium (DIC) is official in IPand BP. IP6 and BP7 describes liquid chromatography method for its estimation. Literature survey reveals HPTLC8 and UV13,14 methods for determination of DIC in single dosage form. Literature survey also reveals HPLC9,11,12, UV spectrophotometry14 and HPTLC15 method for the determination of DIC with other drugs in combination. The combination of these two drugs is not official in any pharmacopoeia; hence no official method is available for the simultaneous estimation of EPE and DIC in their combined dosage forms. Literature survey does not reveal any simple spectrophotometric method for simultaneous estimation of EPE and DIC in synthetic mixture or dosage forms. The present communication describes simple, sensitive, rapid, accurate, precise and cost effective spectrophotometric method based on simultaneous equations for simultaneous estimation of both drugs in their combined synthetic mixture.
MATERIALS AND METHODS Apparatus
A shimadzu model 1700 (Japan) double beam UV/Visible spectrophotometer with spectral width of 2 nm, wavelength accuracy of 0.5 nm and a pair of 10 mm matched quartz cell was used to measure absorbance of all the solutions. Spectra were automatically obtained by UV-Probe 2.0 system software. A Sartorius CP224S analytical balance (Gottingen, Germany), an ultrasonic bath (Frontline FS 4, Mumbai, India) was used in the study.
Reagents and Materials
DIC bulk powder was kindly gifted by Acme Pharmaceuticals Ltd., Ahmedabad, Gujarat, India. EPE bulk powder was kindly gifted by Sun Pharmaceuticals Ltd., Vadodra, Gujarat, Methanol (AR Grade, S. D. Fine Chemicals Ltd., Mumbai, India) and Whatman filter paper no. 41 (Millipore, USA) were used in the study.
Preparation of standard stock solutions
An accurately weighed quantity of standard EPE (10 mg) and DIC (10 mg) powder were weighed and transferred to 100 ml separate volumetric flasks and dissolved in methanol. The flasks were shaken and volumes were made up to mark with methanol to give a solution containing 100 μg/ml each of EPE and DIC.
Methodology
The working standard solutions of EPE and DIC were prepared separately in methanol having concentration of 10
μg/ml. They were scanned in the wavelength range of 200-400 nm against methanol as blank. Maximum absorbance was obtained at 255 nm and 281 nm for EPE and DIC, respectively. These two wavelengths can be employed for the determination of EPE and DIC without any interference from the other components in their synthetic formulations.
Validation of the proposed method
The proposed method was validated according to the International Conference on Harmonization (ICH) guidelines16
Linearity (Calibration curve)
Patel Umang J et al. IRJP 2012, 3 (9)
Page 204
Method precision (repeatability)
The precision of the instrument was checked by repeated scanning and measurement of absorbance of solutions (n = 6)
for EPE and DIC (10 µg/ml for both drugs) without changing the parameter of the proposed Spectrophotometry method.
Intermediate precision (reproducibility)
The intraday and interday precision of the proposed method was determined by analyzing the corresponding responses 3 times on the same day and on 3 different days over a period of 1 week for 3 different concentrations of standard solutions of EPE and DIC (8, 10, 12 µg/ml for EPE and 8, 10, 12
µg/ml for DIC). The result was reported in terms of relative standard deviation (% RSD).
Accuracy (recovery study)
The accuracy of the method was determined by calculating recovery of EPE and DIC by the standard addition method. Known amounts of standard solutions of EPE and DIC were added at 50, 100 and 150 % level to prequantified sample solutions of EPE and DIC (5µg/ml EPE and 5 µg/ml DIC). The amounts of EPE and DIC were estimated by applying obtained values to the respective regression line equations. The experiment was repeated for five times.
Limit of detection and Limit of quantification
The limit of detection (LOD) and the limit of quantification (LOQ) of the drug were derived by calculating the signal-to-noise ratio (S/N, i.e., 3.3 for LOD and 10 for LOQ) using the following equations designated by International Conference on Harmonization (ICH) guidelines 18
LOD = 3.3 ×σ/S LOQ = 10 ×σ/S
Where, σ = the standard deviation of the response and S = slope of the calibration curve
Analysis of EPE and DIC from synthetic mixture
Eperisone (50 mg) and diclofenac (50 mg) standard drug powder were accurately weighed and then mixed with commonly used formulation excipients like starch, lactose, magnesium stearate and talc. The synthetic mixture was then transferred to 100 ml volumetric flask containing 50 ml methanol and sonicated for 25 min. The solution was filtered through Whatman filter paper No. 41 and the volume was adjusted up to the mark with methanol. This solution (0.1 ml) was taken in to a 10 ml volumetric flask and the volume was adjusted up to mark with methanol to get a final concentration of EPE (10 µg/ml) and DIC (10 µg/ml). The responses of the sample solution were measured at 255 nm and 281nm for quantitation of EPE and DIC, respectively.
The amounts of the EPE and DIC present in the sample solution were calculated by solving respective simultaneous equations for EPE and DIC as follows.
Cx = (A2 aY1 – A1 aY2) / (aY1 aX2 - aY2 aX1) Cy = (A1 aX2 - A2 aX1) / (aY1 aX2 - aY2 aX1) Where,
A1 and A2 are absorbances of mixture at 255 nm and 281 nm;
aX1 and aY1 are absorptivities of EPE and DIC respectively at
255 nm;
aX2 and aY2 are absorptivities of EPE and DIC respectively at
281 nm.
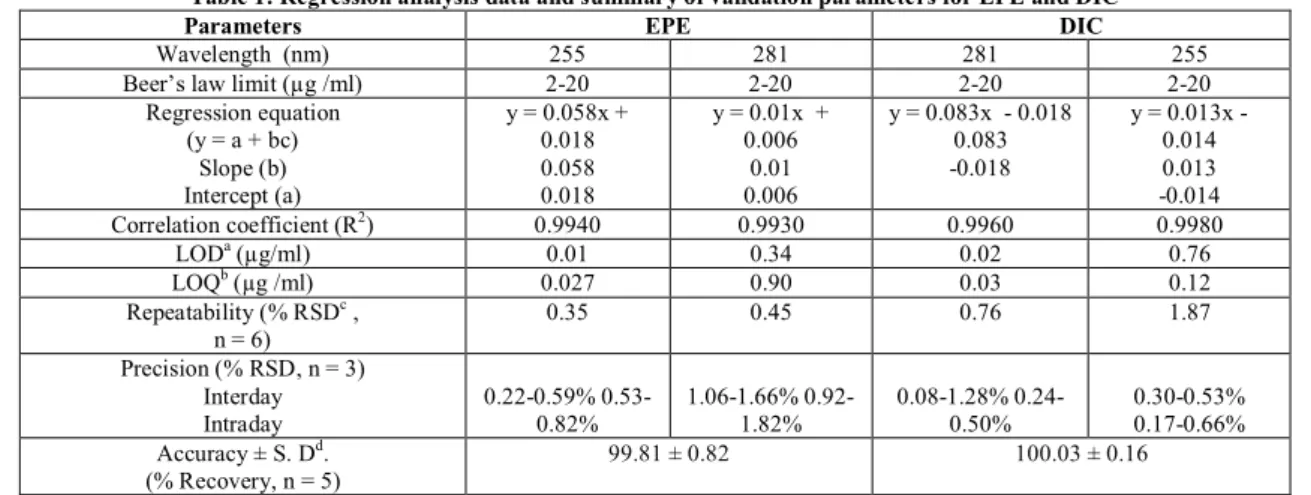
Table 1: Regression analysis data and summary of validation parameters for EPE and DIC
Parameters EPE DIC
Wavelength (nm) 255 281 281 255
Beer’s law limit (µg /ml) 2-20 2-20 2-20 2-20
Regression equation (y = a + bc)
Slope (b) Intercept (a)
y = 0.058x + 0.018 0.058 0.018
y = 0.01x + 0.006
0.01 0.006
y = 0.083x - 0.018 0.083 -0.018
y = 0.013x - 0.014 0.013 -0.014
Correlation coefficient (R2) 0.9940 0.9930 0.9960 0.9980
LODa (µg/ml) 0.01 0.34 0.02 0.76
LOQb (µg /ml) 0.027 0.90 0.03 0.12
Repeatability (% RSDc ,
n = 6)
0.35 0.45 0.76 1.87
Precision (% RSD, n = 3) Interday Intraday
0.22-0.59% 0.53-0.82%
1.06-1.66% 0.92-1.82%
0.08-1.28% 0.24-0.50%
0.30-0.53% 0.17-0.66% Accuracy ± S. Dd.
(% Recovery, n = 5)
99.81 ± 0.82 100.03 ± 0.16
aRSD = Relative standard deviation. bLOD = Limit of detection. cLOQ = Limit of quantification dS. D. is standard deviation
Table 2: Recovery Data of EPE and DIC
Drug Amount taken (µg/ml) Amount added (%) % Recovery ± S. D. (n = 5)
EPE
5 5 5
50 100 150
99.33 ±0.03 100.1 ±0.76 100.0 ±0.03
DIC
5 5 5
50 100 150
101.2 ±0.03 99.00 ±0.42 99.20 ±0.03 S. D. = Standard deviation. n = Number of determinations.
Table 3: Analysis of EPE and DIC in synthetic mixture Synthetic
mixture
Label claim (mg) Amount found (mg) % Label claim ± S. D. (n = 6)
EPE DIC EPE DIC EPE DIC
I 50 50 49.90 50.45 99.80 ±0.78 100.9 ±0.98
Patel Umang J et al. IRJP 2012, 3 (9)
Page 205
Figure 1: Chemical structure of Eperisone (EPE) Figure 2: Chemical structure of Diclofenac Sodium (DIC)
Figure 3: Overlain absorption spectra of EPE (255 nm) and DIC (281 nm) in methanol
RESULTS
The standard solutions of EPE and DIC were scanned separately in the UV range and zero-order spectra for EPE and DIC were recorded. Maximum absorbance was obtained at 255 nm and 281 nm for EPE and DIC, respectively. These two wavelengths can be employed for the determination of EPE and DIC without any interference from the other drug in their combined synthetic mixture. Overlain zero-order absorption spectrum of EPE and DIC in methanol is shown in
(Figure 3). Linear correlation was obtained between absorbances and concentrations of EPE and DIC in the concentration ranges of 2-20 µg/ml and 2-20 µg/ml, respectively. The linearity of the calibration curve was validated by the high values of correlation coefficient of regression. The RSD values of EPE were found to be 0.58 and 0.95 % at 255 and 281 nm, respectively. The RSD value of DIC was found to be 0.59 and 1.41 % at 255 and 281 nm, respectively. Relative standard deviation was less than 2 %, which indicates that proposed method is repeatable. The low RSD values of interday (0.22-0.59% and 1.06-1.66% for EPE at 255 and 281 nm, respectively and 0.08-1.28% and 0.05-0.45% for DIC at 255 and 281 nm, respectively) and intraday (0.53-0.82% and 0.92-1.82% for EPE at 255 and 281 nm, respectively and 0.17-0.66% and 0.24-0.50% for DIC at
255and 281 nm, respectively) variation for EPE and DIC, reveal that the proposed method is precise. LOD and LOQ values for EPE were found to be 0.010 and 0.34 µg/ml and 0.027 and 0.90 µg/ml at 255 and 281nm, respectively. LOD and LOQ values for DIC were found to be 0.02 and 0.76
µg/ml and 0.03 and 0.12 µg/ml at 255 and 281 nm, respectively. These data show that method is sensitive for the determination of EPE and DIC. The regression analysis data and summary of validation parameters for the proposed method is summarized in Table 1.
Patel Umang J et al. IRJP 2012, 3 (9)
Page 206
DISCUSSION
The proposed spectrophotometric method was found to be simple, sensitive, accurate and precise for determination of EPE and DIC in Synthetic mixture. The method utilizes easily available and cheap solvent for analysis of EPE and DIC hence the method was also economic for estimation of EPE and DIC from Synthetic mixture. The common excipients and other additives are usually present in the Synthetic mixture do not interfere in the analysis of EPE and DIC in method, hence it can be conveniently adopted for routine quality control analysis of the drugs in combined pharmaceutical formulation.
ACKNOWLEDGEMENT
The authors are thankful to Sun Pharmaceutical Ltd, Vadodra, India and Acme Pharmaceutical Ltd. Ahmedabad, India for providing gift sample of EPE and DIC, respectively for carry out the research work. The authors are highly thankful to Shree S. K. Patel College of Pharmaceutical Education and Research, Ganpat University, Ganpat Vidyanagar – 384012, Mehsana, Gujarat, India for providing all the facilities to carry out the research work.
REFERENCES
1. Maryadele. J. O’ Neil. The Merck Index: An Encyclopedia of chemicals, drugs and biologicals, 13th ed. New Jersey: Published by Merck Research Laboratories, Division of Merck and Co., Inc. Whitehouse station 2006. p. 610.
2. Japanese Pharmacopoeia. Society of Japanese Pharmacopeia. 15th ed. Shibuya Tokyo Japan 2006.p. 618.
3. Zhang S, Ding L, Wei X, Sheng J ,Zhang Y. Rapid and Sensitve Liquid Chromatography-Electrospray Ionization-Mass Spectrometry method for the determination of Eperisone in Human Plasma. J of Chromatographic Sci 2004; 42: 254-258.
4. Ding L, Wang X, Yang Z, and Chen Y. The use of HPLC/MS, GC/MS, NMR, UV and IR to Identify Degredation product of
Eperisone hydrochloride in the tablets. J of pharm and Bio Anal 2008; 46: 282-287.
5. Maryadele. J. O’ Neil. The Merck Index: An Encyclopedia of chemicals, drugs and biologicals, 13th ed. New Jersey: Published by Merck Research Laboratories. Division of Merck and Co., Inc. Whitehouse station: 2006; p. 542.
6. Indian Pharmacopoeia. Vol. II. The Controller of Publication. 6th ed. Govt. of India. New Delhi 2010.p. 1199.
7. British Pharmacopoeia. Vol. I. Stationary office. London Medicines and Healthcare product regulatory agency 2010.p. 672.
8. Thongchai W, Liawruangrath B, Thongpoon C, Tmachan. High Perfomance Thin layer chromatographic method for determination of diclofenac sodium in pharmaceutical formulation. Chiang Mai J Sci 2006; 33: 123-128.
9. Heda A, Gadade D, Kathiriya J, Puranik P. Development and validation of HPLC method for determination of diclofenac sodium and Rabeprazole sodium. E Jor of Chemistry 2010; 7: 386-390.
10. Khaskheli A, Abro K, Sherazi S, Afridi H, Mahesar S, Saeed M. Simpler and faster Spectrophotometric determination of Diclofenac sodium in Tablet, Serum and Urine samples. Pak J Anal Environ Chem 2009;10:53-58
11. Gowramma B, Rajan S, Muralidharan S, Meyyanathan SN, Suresh B. Validated HPLC method for simultaneous estimation of paracetamol and diclofenac in pharmaceutical formulation.Int J of ChemTech Research 2010; 2:676-680.
12. Mulgund SV, PhoujdarMS, LondheSV, MalladePS, KulkarniTS,
DeshpandeAS et al, Stability indicating HPLC method for simultaneous determination of mephenesin and diclofenac diethyl amine. Ind J Phar Sci 2009;71:35-40.
13. Shinde VM, Desai BS. Simultaneous estimation of paracetamol and diclofenac and chlorzoxazone by HPLC from tablet. Ind J Pharm Sci 2008; 57:35-37
14. Revathi G, Rama Rao N, Venkata SP. Simultaneous UV-spectrophotometric determination and validation of diclofenac sodium and rabeprazole sodium using hydrotropic agents in its tablet dosage form. Int J Drug Dev Res 2012; 4: 316-324
15. Dhaneshwar SR, Bhusari VK. Validated HPTLC method for simultaneous quantitation of diclofenac sodium and misoprostol in bulk drug and formulation. Asian J Pharm Biol Res 2011; 1:15-21.
16. The International Conference on Harmonization. Q2 (R1). Validation of Analytical Procedure. Text and Methodology. 2005.
Source of support: Nil, Conflict of interest: None Declared