www.atmos-chem-phys.net/15/6637/2015/ doi:10.5194/acp-15-6637-2015
© Author(s) 2015. CC Attribution 3.0 License.
Estimating NH
3
emissions from agricultural fertilizer application in
China using the bi-directional CMAQ model coupled to an
agro-ecosystem model
X. Fu1,2, S. X. Wang1,2, L. M. Ran3, J. E. Pleim4, E. Cooter4, J. O. Bash4, V. Benson5, and J. M. Hao1,6
1State Key Joint Laboratory of Environmental Simulation and Pollution Control, School of Environment,
Tsinghua University, Beijing 100084, China
2State Environmental Protection Key Laboratory of Sources and Control of Air Pollution Complex, Beijing 100084, China 3University of North Carolina, Institute for the Environment, Chapel Hill, North Carolina, USA
4US Environmental Protection Agency, Research Triangle Park, North Carolina, USA 5Benson Consulting, Columbia, Missouri, USA
6Collaborative Innovation Center for Regional Environmental Quality, Tsinghua University, Beijing 100084, China
Correspondence to:S. X. Wang ([email protected])
Received: 2 December 2014 – Published in Atmos. Chem. Phys. Discuss.: 8 January 2015 Revised: 21 April 2015 – Accepted: 28 May 2015 – Published: 16 June 2015
Abstract.Atmospheric ammonia (NH3)plays an important
role in atmospheric aerosol chemistry. China is one of the largest NH3 emitting countries with the majority of NH3
emissions coming from agricultural practices, such as fertil-izer application and livestock production. The current NH3
emission estimates in China are mainly based on pre-defined emission factors that lack temporal or spatial details, which are needed to accurately predict NH3emissions. This study
provides the first online estimate of NH3 emissions from
agricultural fertilizer application in China, using an agricul-tural fertilizer modeling system which couples a regional air quality model (the Community Multi-scale Air Quality model, or CMAQ) and an agro-ecosystem model (the Envi-ronmental Policy Integrated Climate model, or EPIC). This method improves the spatial and temporal resolution of NH3
emissions from this sector.
We combined the cropland area data of 14 crops from 2710 counties with the Moderate Resolution Imaging Spectrora-diometer (MODIS) land use data to determine the crop distri-bution. The fertilizer application rates and methods for differ-ent crops were collected at provincial or agricultural region levels. The EPIC outputs of daily fertilizer application and soil characteristics were input into the CMAQ model and the hourly NH3 emissions were calculated online with CMAQ
running. The estimated agricultural fertilizer NH3emissions
in this study were approximately 3 Tg in 2011. The regions with the highest modeled emission rates are located in the North China Plain. Seasonally, peak ammonia emissions oc-cur from April to July. Compared with previous researches, this study considers an increased number of influencing fac-tors, such as meteorological fields, soil and fertilizer appli-cation, and provides improved NH3 emissions with higher
spatial and temporal resolution.
1 Introduction
Ammonia (NH3)is the most important and abundant
alka-line constituent in the atmosphere, with a wide range of im-pacts. It plays a key role in atmospheric chemistry and am-bient particle formation. NH3 partitions to sulfate (SO24−),
and nitrate (NO−
3)aerosol, adding to the concentration of
secondary inorganic aerosol (SIA), including sulfate, nitrate, and ammonium. Field measurements indicate that SIA is a major contributing factor during haze days in China (He et al., 2014; Wang et al., 2012; K. Huang et al., 2012). Ye et al. (2011) observed a strong correlation between peak levels of fine particles and large increases in NH3
health (Cheng et al., 2013; Ding et al., 2013; Pope III et al., 2011). In addition, the deposition of ammonium parti-cles (NH+
4)and gaseous ammonia can cause soil
acidifica-tion, water eutrophicaacidifica-tion, loss of biodiversity, and pertur-bation of ecosystems (Lepori and Keck, 2012; Stevens et al., 2004; Zhu et al., 2013). As one of the largest agricul-tural and meat producers in the world (FAO, 2013), China is a significant source of NH3 emissions. Previous studies
have indicated that China’s ammonia emissions contribute 23 % of the global NH3 budget (EDGARv4.1 2015; http:
//edgar.jrc.ec.europa.eu/datasets_list.php?v=41) and present a continuously increasing trend (Dong et al., 2010).
Nitrogen fertilizer use is one of the largest sources of NH3emissions in China, accounting for 35–55 % of the
na-tional total (X. Huang et al., 2012; Zhao et al., 2013). There are many studies focusing on NH3emissions from
agricul-tural fertilizer in China, but they are mostly based on tra-ditional “emission factors” (EFs) methods. Some of them (Klimont, 2001; Streets et al., 2003; Dong et al., 2010; Zhao et al., 2013) use nationally averaged EFs for the whole of China. However, ammonia volatilization from nitrogen fer-tilizer application depends strongly on localized environmen-tal parameters, such as ambient temperature and soil acidity (Roelle and Aneja, 2002; Corstanje et al., 2008). In addition, fertilizer application dates and application amounts vary by geographical regions and crop types. Therefore, these esti-mates are subject to high uncertainties, especially in their temporal and spatial distributions. Zhang et al. (2011) and X. Huang et al. (2012) use some relative correction factors to introduce the impacts of temperature, soil properties, and fer-tilization method, which somewhat reduce temporal and spa-tial uncertainties. In recent years, some scientists from out-side China have begun to focus on estimating NH3emissions
based on a bi-directional surface flux model (Cooter et al., 2010; Wichink Kruit et al., 2012). For example, a group at the U.S. Environmental Protection Agency (US EPA) (Cooter et al., 2012; Bash et al., 2013; Pleim et al., 2013) has modified the Community Multi-scale Air Quality (CMAQ) model to include a bi-directional NH3exchange module. It is coupled
to the Fertilizer Emission Scenario Tool for CMAQ (FEST-C) system (Ran et al., 2010; CMAS, 2014), which contains the Environmental Policy Integrated Climate (EPIC) model (Williams et al., 1984). This system includes the influences of meteorology, air–surface exchange, and human agricul-tural activity. It has been used to simulate the bi-directional exchange of NH3 in the United States. Compared with a
traditional emission inventory, the model performances for NO−
3 concentration and N deposition in the USA are
im-proved (Bash et al., 2013). However, until now this method has not yet been used to estimate the agricultural fertilizer NH3emission in China.
For the first time in this study, we estimate China’s NH3
emission from agricultural fertilizer use in 2011, based on the CMAQ model with a bi-directional NH3 exchange module
coupled to the FEST-C system with the EPIC agro-ecosystem
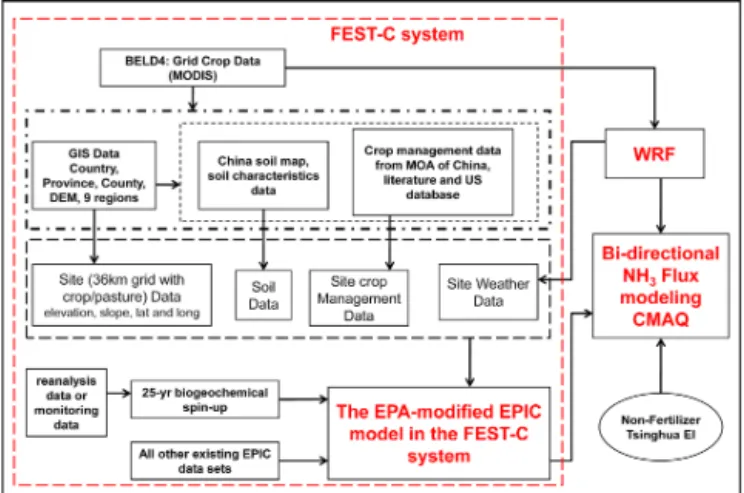
Figure 1.The modeling system of agricultural fertilizer NH3 emis-sion for China.
model. The structure of this modeling system and input data processing are described in detail in the next section. The results of the fertilizer use and NH3 emissions simulation,
along with a comparison to other studies, are discussed in Sect. 3. The results of CMAQ modeling are also discussed and compared with field measurements. Finally, the uncer-tainties of this method are discussed in detail at the end of the section.
2 Methodology and inputs
2.1 General description of the modeling system
Figure 1 shows the structure of the modeling system, which contains three main components: (1) the FEST-C system containing the EPIC model, (2) the mesoscale meteorology Weather Research and Forecasting (WRF) model, and (3) the CMAQ air quality model with bi-directional ammonia fluxes. A detailed description of the bi-directional module can be found in Bash et al. (2013). Soil NH+
4 content and
agri-cultural activity data were simulated by the EPIC model in the FEST-C system. In order to run the EPIC model for this study, we collected and processed local Chinese agricultural information, such as crop distribution, soil characteristics, climate patterns, and fertilizer use characteristics. The de-tails regarding these data sources and processing methods are described in Sect. 2.2. In addition to agricultural activity and soil information, this system also considers the influence of WRF-simulated weather on NH3emissions. The tools in
the FEST-C system can be used to process the EPIC input data and also extract the EPIC daily output data required for CMAQ (CMAS, 2014).
resolu-Figure 2.The modeling domain. The black points represent the lo-cations of the nitrate observations.
tion of 36 km×36 km. EPIC data and micrometeorological parameters are estimated for each modeled CMAQ grid cell.
2.2 EPIC modeling in the FEST-C system
The EPIC model is a semi-empirical agro-ecosystem model which is designed to simulate agricultural fields that are char-acterized by soil, landscape, weather, and crop management (Williams et al., 1984). A wide range of vegetative systems, tillage systems, and other crop management practices can be simulated in this model (Gassman et al., 2005). Additionally, soil nitrogen (N), carbon (C), and phosphorus (P) biogeo-chemical process models are incorporated into EPIC. There-fore, it is well suited for simulation of fertilizer management and soil nitrogen content in agricultural systems. The input information required by EPIC includes crop site information, soil characteristics, weather, and crop management, which are described in detail in the next section. All data are pro-cessed to a 36 km×36 km grid for integration with the air quality model, CMAQ.
2.2.1 Crops
Fourteen crop types are modeled in this study: early rice, middle rice, late rice, winter wheat, spring wheat, corn, sorghum, barley, soybean, potato, peanuts, canola, cotton and other crops. The “other crops” category represents all re-maining crops. Data on the cropland area1 for each crop
grown in the 2710 counties studied was collected and pro-cessed based on province-level or city-level statistical year-books. The Moderate Resolution Imaging Spectroradiometer (MODIS; https://lpdaac.usgs.gov/products/modis_products_ table/mcd12q1) was used to provide finer-level land use
in-1Please contact the corresponding author for the data set.
formation. The MODIS land use product provides annual 500 m pixel-scale information for 20 land use categories. MODIS classes 12 (cropland) and 14 (cropland/natural veg-etation mosaic) are of particular interest in this study. In ad-dition, irrigation is an important factor for crop growth and soil characteristics. Here, we used the global irrigated area map (GIAM) at 1 km resolution (Thenkabail et al., 2008) to divide each crop into irrigated and non-irrigated classes. The BELD4 tool in FEST-C system was used to process these data into 36 km×36 km grid cell (CMAS, 2014).
2.2.2 Soil information
The dominant soil type in each grid was taken from the Har-monized World Soil Database (HWSD; http://webarchive. iiasa.ac.at/Research/LUC/External-World-soil-database/ HTML/), which gives soil distribution with 30 arc-second resolution (about 1 km×1 km maximally) in China. We matched the soil in each grid with a specific soil profile in a US database (Cooter et al., 2012) based on soil type, ecolog-ical region, and latitude. Soil characteristics of the matched soil were extracted as soil input for the corresponding grid, including layer depth, soil texture, soil carbon content, carbonate content, bulk density, cation exchange capacity, pH, etc. The assumption taken is that the characteristics of same soil types in similar eco-regions and latitudes between China and the US are similar. These soil characteristics were used as initial input data for EPIC because they were for general soil, not specially for agriculture soil. A spin-up run allowed the soil characteristics to adjust to agriculture management. For example, the EPIC model applied lime to maintain the soil pH at levels that reduce crop stress due to low pH. Besides, the soil characteristics are also updated with CMAQ running.
2.2.3 Weather
The weather parameters required by EPIC for this simu-lation included maximum and minimum temperature, ra-diation, precipitation, relative humidity, and 10 m wind speed. For the spin-up run, these variables were extracted from the NASA Modern Era Reanalysis for Research and Applications (MERRA; http://disc.sci.gsfc.nasa.gov/mdisc/ overview/index.shtml) data, which provides weather infor-mation from 1979 to the present with 0.5◦×0.667◦grid
2.2.4 Crop management
In the EPIC model, the timing of crop management can be prescribed or scheduled based on a heat-unit (HU) method, as described in Cooter et al. (2012). In this study, a combination of prescribed and HU scheduled timing was used. The HU scheduled timing allowed for adaptation to inter-annual and interregional temperature variability and more realistically represents a farmer’s dynamic decision-making. At the same time, the timing was also limited to a fixed range based on available information from the Chinese planting information network (http://www.zzys.moa.gov.cn/) and unpublished re-search about crop management from the Chinese Academy of Agriculture Sciences.2This allowed the timing to be ad-justed to Chinese agriculture.
Nitrogen fertilizer application information is necessary to accurately estimate NH3emissions in this study. The
applica-tion rates for specific fertilizer type, crop, and province were extracted from Chinese statistical material (National Bureau of Statistics of China or NBSC, 2012b). The fertilizer types included urea, ammonium bicarbonate (ABC), diammonium phosphate (DAP), N–P–K compound fertilizer (NPK), and others (e.g., ammonium nitrate and ammonium sulfate). Ta-ble 1 shows the national average application rates for some major crops. We can see that the nitrogen fertilizer applica-tion rates for different crops are varied. The largest nitrogen amount is required for cotton and wheat, which are 228.11 and 196.22 kg N ha−1, respectively. However, nitrogen-fixing
crops (e.g., soybean and peanuts) require much less nitrogen input. Among all the fertilizer types, urea and ammonium bi-carbonate are dominant.
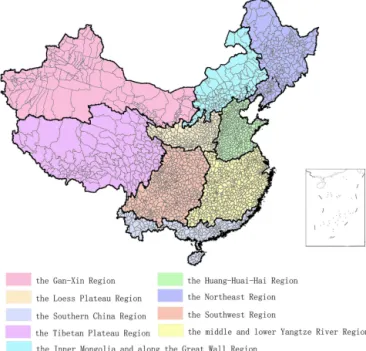
Besides application rates, the ratio of basal and topdress-ing fertilizer is also important for ammonia volatilization. Basal fertilizer is used before crops are planted and topdress-ing fertilizer is used durtopdress-ing crop growth. Figure 3 presents the Chinese agriculture regions used to characterize these man-agement practices. Each region is a geographic area where crop management practices are assumed to be similar. Based on the results of previous field investigations (Wang et al., 2008; Zhang, 2008), the ratios of basal and topdressing fer-tilizer for different crops in each agriculture region are iden-tified. Table 2 shows the fertilizer ratios used on three major crops in China and a clear geographical divergence can be observed. For example, the ratio of fertilizer used on wheat in the middle and lower Yangtze River region is 1.39, but only 0.33 in the southwest region. In general, the ratio of fer-tilizer used on corn is the highest of the three major crops. A greater amount of fertilizer is applied to corn just prior to or at planting than is applied to the crop later in the grow-ing season. The information in Tables 1 and 2 was combined for this study to determine the amount of fertilizer applied to each crop in each grid cell during basal and topdressing activities.
2Please contact [email protected] for the data
Figure 3.The nine agriculture regions in China. The thin black line represents the county boundary and the small insert represents the South China Sea and its islands.
2.3 The bi-directional CMAQ model system
Direct flux measurements have shown that the air–surface flux of NH3is bi-directional, and vegetation and soil can be
either a sink or a source of atmospheric NH3(Fowler et al.,
2009; Sutton et al., 1995). The direction and magnitude of the flux depend on the concentration gradient between canopy or soil and the atmosphere. Bash et al. (2013) has implemented a bi-directional ammonia flux module in CMAQv5.0.1 to represent this process. This module is based on the two-layer (soil and vegetation canopy) resistance model described by Pleim et al. (2013), which is similar to the model presented by Nemitz et al. (2001). The NH3air–surface flux (Ft)is cal-culated by the following formula
Ft= 1 Ra+0.5Rinc
(Cc−Ca) , (1)
where the aerodynamic resistance (Ra) and the in-canopy aerodynamic resistance (Rinc)are calculated following Pleim
et al. (2013).Cais the atmospheric NH3concentration.Ccis
a function ofCa, the soil compensation point (Cg)and the
stomatal compensation point (Cst).
Cc= (2)
Ca
Ra+0.5Rinc+
Cst
Rb+Rst+
Cg 0.5Rinc+Rbg+Rsoil
(Ra+0.5Rinc)−1+(Rb+Rst)−1+(Rb+Rw)−1+ 0.5Rinc+Rbg+Rsoil
−1,
where the quasi-laminar boundary-layer resistance of leaf surface (Rb), the stomatal resistance (Rst) and the
Table 1.The 2011 national-average fertilizer application rate for major crops in China (kg N ha−1).
Total Urea ABCa DAPb NPKc Others Early rice 183.48 125.03 20.03 4.00 21.87 12.55 Middle rice 185.62 117.38 33.15 4.04 18.69 12.36 Late rice 181.14 124.20 19.13 4.02 21.63 12.17
Wheat 196.22 123.90 19.05 16.14 29.98 7.16
Corn 186.75 123.45 19.05 12.63 18.85 12.77
Soybean 45.92 19.50 1.65 10.48 11.51 2.77
Peanuts 95.14 36.30 11.70 3.43 29.03 14.68
Canola 128.14 75.90 30.90 2.35 11.02 7.97
Cotton 228.11 152.40 9.45 24.34 27.45 14.46
aammonium bicarbonate (ABC);bdiammonium phosphate (DAP);cN–P–K compound
fertilizer (NPK)
Table 2.Ratio of basal and topdressing fertilizer for major crops in each agriculture region.
Region Wheat Corn Rice
basal topdressing basal topdressing basal topdressing
The northeast region 1.00 0.80 1.00 1.23 1.00 0.88
The Gan-Xin region 1.00 0.44 1.00 3.50 1.00 1.00
The southern China region 1.00 1.00 1.00 2.98 1.00 2.91
The Huang-Huai-Hai region 1.00 0.80 1.00 2.07 1.00 1.29
The Loess Plateau region 1.00 0.44 1.00 3.50 1.00 1.00
The Inner Mongolia and along the Great Wall region
1.00 0.44 1.00 3.50 1.00 1.00
The Tibetan Plateau region 1.00 0.44 1.00 3.50 1.00 1.00
The southwest region 1.00 0.33 1.00 2.33 1.00 1.88
The middle and lower Yangtze River region
1.00 1.39 1.00 1.66 1.00 1.29
are calculated following Pleim et al. (2013). The cuticu-lar resistance (Rw) is a function of Cc similar to Jones et
al. (2007).CstandCgare calculated as follows:
Cst=Mn/Vm
161 500 Tc
e
−10 380Tc
Ŵs, (3)
Cg=Mn/Vm
161 500 Ts e
−10 380
Ts
Ŵg, (4)
whereMn is the molar mass of NH3,Vm is the conversion factor of L to m3, andTsandTcare the soil and canopy
tem-perature in K. The apoplast gamma (Ŵs)is modeled with a
function similar to Zhang et al. (2010). The soil gamma (Ŵg)
is defined as soil [NH+
4]/[H+], and the soil NH+4 budget
in CMAQ is parameterized following the method in EPIC (Williams et al., 1984). The soil NH+
4 would increase due
to N deposition, and decrease due to NH3 evasion and soil
nitrification. When fertilizer is used,Ŵgis calculated by the
following function:
Ŵg=
Napp/ (θsMNds)
10−pH , (5)
whereNapp is the fertilizer application rate (g N m−2),θs is
the soil volumetric water content (m3m−3),M
Nis the molar
mass of nitrogen (14 g mol−1),d
s is the depth of soil layer
(m), and pH is soil pH. The initial soil NH+
4,θs and pH are
taken from the EPIC output and then calculated in CMAQ hourly.
In addition to the inputs of soil condition and fertilizer use, other input data used were the same as those in the tradi-tional CMAQ model. WRF version 3.5.1 was used to gener-ate the meteorological input. The configuration options used in WRF and CMAQ were the same as those described by Fu et al. (2014).
Figure 4.Comparison of annual N fertilizer use at province level between existing statistical data(a)and EPIC output(b). The small insert represents the South China Sea and its islands.
method. This case did not include the bi-directional flux al-gorithm in CMAQ. For the bidi case, NH3 emissions were
estimated online using the bi-directional module in CMAQ. The emissions of ammonia from other sectors and the emis-sions of other pollutants were taken from Zhao et al. (2013) for both cases.
3 Results and discussion
3.1 Nitrogen fertilizer application
Nitrogen fertilizer application was a key aspect in this study, explored through a comparison of the EPIC results to exist-ing statistical data. The N use in each grid cell per day is calculated by the following formula
USEi=
crop
X
j=1
Nij×fij
×129 600, (6)
where USEi (kg) is the N application in grid cell i; Nij (kg ha−1) is the N application rate in the grid cellifor crop
j;fij is the fraction of cell used for cropj in grid celli; and 129 600 ha grid−1 is a conversion factor accounting for the
area of the grid cell.
Figure 5.Comparison of the fraction of N fertilizer use by each month between statistics and EPIC output.
Figure 4a and b show the patterns of annual fertil-izer use at province-level between the statistical data from NBSC (2012a) and the EPIC output. We can see that EPIC results captured the general pattern, especially for the provinces with the largest fertilizer use (>1750 million kg), such as Henan, Shandong, Jiangsu, and Hebei provinces, where the biases were−9.7,−5.1,−1, and−0.6 %, respec-tively. At the same time, relatively large biases existed for some provinces, such as Hunan province (−20.6 %) and Hei-longjiang province (19.2 %). This may be due to uncertainty in the statistical data. Additionally, the 36 km grid is rela-tively coarse and uncertainty exists for the gridded crop areas calculated according to the county-level statistical crop data and MODIS crop data. Because the provinces with a larger bias applied relatively small amounts of fertilizer, these mod-eled biases are not expected to lead to large biases in the sim-ulations.
Figure 6.Spatial distribution of NH3emissions from N fertilizer use in 36 km×36 km grid cell (kg yr−1). The small insert
repre-sents the South China Sea and its islands.
3.2 NH3emissions
3.2.1 Spatial and temporal distribution
The NH3emissions from N fertilizer application in 2011
es-timated in this study were approximately 3.0 Tg. The spatial distribution of annual NH3emission in a 36 km×36 km grid
is presented in Fig. 6 and shows that NH3volatilization was
concentrated in Henan, Shandong, Hebei, Jiangsu, and An-hui provinces, accounting for 11.1, 9.9, 8.8, 6.7, and 7.1 % of total emissions, respectively. The highest NH3emissions
in this region were above 386 kg ha−1. The crop production
here is the most intense in China and the total crop area in these five provinces accounts for about 31.4 % of China’s to-tal. These five provinces consumed approximately 37.3 % of the nitrogen fertilizer for the whole country in 2011 (NBSC, 2012b). Elevated emissions were also due to the high fertil-izer application rate. For example, the rate of N fertilfertil-izer use for rice in Jiangsu province was above 300 kg ha−1, which is
twice the national average. The smaller contributors to NH3
emission were primarily located in western China, in Tibet, Qinghai, and Gansu province, where the amount of arable land and N fertilizer use was small.
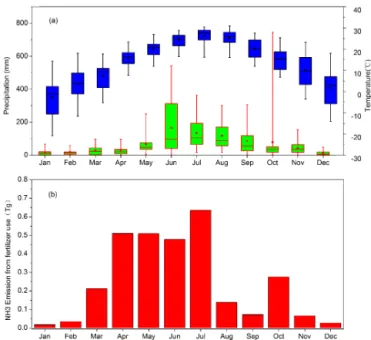
Figure 7b shows the monthly distribution of ammonia emissions, which were dominant from March to July, and in October, accounting for 88.7 % of the annual total. This agrees with the pattern of N fertilizer usage described in Sect. 3.1. Besides N fertilizer use, weather parameters, like temperature and precipitation, also affected the temporal and spatial distribution of emissions. For example, the emissions in March were much smaller than April and May due to lower temperatures (as shown in Fig. 7a), even though the amount of consumed fertilizer was nearly equivalent. Simi-larly, the emissions in June were slightly less than in April and May. A possible reason is that precipitation in June is
Figure 7. (a)The variation of monthly precipitation (green) and temperature (blue) in 31 provinces. In the box-and-whisker plots, the boxes and whiskers indicate the 100th (max), 75th, 50th (me-dian), 25th and 0th (min) percentiles, respectively. The point repre-sents the average value.(b)Monthly NH3emissions from N
fertil-izer use.
greater than that in the previous 2 months. Based on the sta-tistical data of major Chinese cities (NBSC, 2012a), the to-tal precipitation in June 2011 was 165.1 mm, while in April and May, it was 28.5 and 67.4 mm, respectively (as shown in Fig. 7a). Figure S1 in the Supplement presents the spatial distribution for each month. Some differences for the months with larger emissions can be seen. For example, in the North China Plain, like Hebei, Henan, and Shandong provinces, NH3 emissions were relatively small in May due to lower
amounts of fertilizer application. In northeast China, includ-ing Liaoninclud-ing, Jilin, and Heilongjiang provinces, the NH3
emissions in May, June and July were dominant. In Novem-ber, major NH3 emissions occurred in Jiangsu, Hubei and
Anhui provinces, when winter canola basal fertilizer was ap-plied.
3.2.2 Comparison with other studies
lower compared with other studies. The discrepancies are mostly caused by the various estimating methods and EFs employed. Streets et al. (2003), Dong et al. (2010) and Zhao et al. (2013) used averaged emission factors for all agricul-ture in China and did not consider the impacts of environ-mental parameters, e.g., soil pH, or precipitation. For exam-ple, the EFs for urea used by Streets et al. (2003), Dong et al. (2010), and Zhao et al. (2013) are 15–20 % (temperate and tropical ozone). However, the basic emission factors for urea used by X. Huang et al. (2012) are 8.8 % for acid soil and 30.1 % for alkaline soil. The agricultural regions in China are dominated by acidic soil (http://www.soil.csdb.cn/), so this value is nearly 50 % lower compared with averaged EFs. In addition to soil pH, precipitation can also decrease NH3
emissions, because precipitation can increase the water con-tent in soil and fertilizer N can be leached to a deeper soil layer by water (Wang et al., 2004). Zhang et al. (2011) ad-justed the EFs by 0.75, 0.80, 0.85, 0.90, 0.95, and 1.0 for significant rainfall events (>5 mm in 24 h) within 24, 24–48, 48–72, 72–96, 96–120, and>120 h of fertilizer application. In this study, the impacts of soil pH and precipitation on NH3
emissions were considered by impacting soil gamma and re-sistances, as shown in Sect. 2.3. In addition, our study and Zhang et al. (2011) included the impacts of irrigation. The experiments of Wang et al. (2004) in Beijing for the winter wheat–summer maize cycle show that NH3volatilization is
reduced after irrigation and reveal a low EF value of 2.1– 9.5 %.
Figures S4 and S5 represent the comparisons of provin-cial distributions and seasonal variations of these different NH3 emission inventories. The provincial distributions are
similar, and the emissions from Henan, Shandong, Jiangsu, Hebei, and Anhui provinces dominate the country’s annual total emissions. At the same time, some discrepancy also ex-ists for the specific provinces among the different studies, which may be caused by distinct fertilizer consumptions and emission rates employed. For example, for Henan province, the estimation of X. Huang et al. (2012) is the highest among these studies. A possible reason for this difference is that al-kaline soil is dominant in Henan province and X. Huang et al. (2012) set a uniform high emission factor for alkaline soil, which is twice as high as that in Dong et al. (2010). Com-pared with provincial distributions, the difference of seasonal variations among these studies is larger. The seasonal profile in Zhao et al. (2013) is based on temperature variations. In addition to temperature, others also considered the impacts of fertilizer application timing. It is indeed difficult to cap-ture the exact date of fertilization for all of China, which may have created this large discrepancy amongst studies. For ex-ample, X. Huang et al. (2012) states that the basal fertilizer and topdressing fertilizer of winter wheat are conducted in September and November. However, basal fertilizer was ap-plied in October in our study and in the Zhang et al. (2011), and the topdressing fertilizer is mainly used in March of the next year. The diversity of seasonal fertilization among
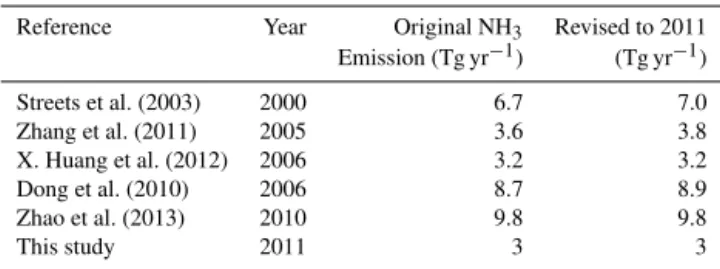
dif-Table 3.Comparison of NH3emissions from fertilizer use in our study with other published results.
Reference Year Original NH3 Revised to 2011
Emission (Tg yr−1) (Tg yr−1)
Streets et al. (2003) 2000 6.7 7.0 Zhang et al. (2011) 2005 3.6 3.8 X. Huang et al. (2012) 2006 3.2 3.2 Dong et al. (2010) 2006 8.7 8.9 Zhao et al. (2013) 2010 9.8 9.8 This study 2011 3 3
ferent studies reflects that the large uncertainties still exist for the temporal distribution of NH3 emissions and shows
that continued local research is needed.
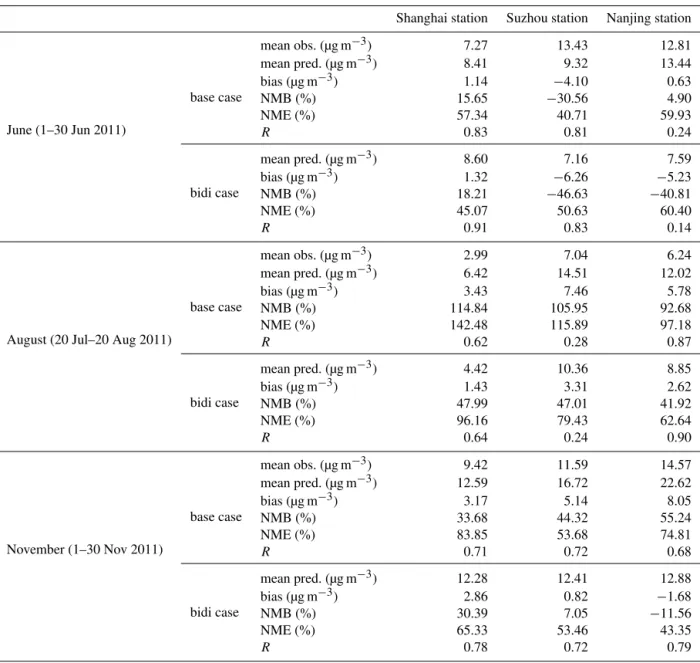
3.3 Evaluation of the CMAQ results by ground observations
NH3is the most important and abundant alkaline constituent
in the atmosphere, and NH3 emission estimates can affect
the simulation of the inorganic gas-particle system (Schiferl et al., 2014). As the dominant positive ion in the atmosphere, NH+
4 preferentially partitions to SO24−and then partitions to
NO−
3. In NH3-rich regions, the NO
−
3 concentration is
sensi-tive to NH3 changes, but NH3 changes do not lead to large
differences in SO2−
4 concentration (Wang et al., 2011). In
or-der to evaluate the reliability of this NH3emissions estimate,
we compared the CMAQ-modeled NO−
3 concentrations
us-ing different NH3 emissions against actual observations. In
China, observation data on chemical components of fine par-ticulates is very limited and not publicly available. For this study, we collected the observation data at three monitoring sites: Shanghai station (121.5◦E, 31.2◦N), Suzhou station
(120.6◦E, 31.3◦N), and Nanjing station (118.7◦E, 32.1◦N).
Ion chromatography (Dionex-3000, Dionex Corp,CA, USA) was used to measure daily NO−
3 concentration in PM2.5
par-ticles (Cheng et al., 2014). Some statistical indices, includ-ing mean observation (mean obs.), mean prediction (mean pred.), bias, normalized mean bias (NMB), normalized mean error (NME) and correlation coefficient (R) were calculated for the base case and bidi case in June, August, and Novem-ber, as shown in Table 4. For the base case, the emission in-ventory from Zhao et al. (2013) was used. For the bidi case, the NH3emission from fertilizer use was calculated online
Shanghai station. The correlation coefficient at Suzhou sta-tion and the NME at Nanjing stasta-tion were comparable for these two cases.
3.4 Uncertainty analysis
This is a pilot study to apply this model system to estimate NH3 emissions in China and therefore, large uncertainties
still exist in some aspects of this method. The quality of in-put data, mathematical algorithm, and parameters applied in EPIC and the bi-directional model may be associated with uncertainties in the model output.
Fertilizer application rates for each crop are important in-put data for the estimation of NH3 emissions from
agricul-tural fertilizers and were obtained from agriculagricul-tural statistics. These statistical data have some level of uncertainty, because the number of samples in the census are limited. Beusen et al. (2008) has employed an uncertainty of±10 % for the sta-tistical data of fertilizer use based on expert judgments when estimating the global NH3emission. A June 2006 sensitivity
run of this bi-directional model in the USA shows that a 50 % increase of crop fertilizer use would result in a 31 % increase in NH3emissions (Dennis et al., 2013). In addition, the
spa-tial distribution of NH3emissions from agricultural fertilizer
is strongly related to cropland area and its distribution, which are achieved from the MODIS data. Friedl et al. (2010) men-tions that the producer’s and user’s accuracies are 83.3 and 92.8 % for MODIS class 12 (cropland) and 60.5 and 27.5 % for class 14 (cropland/natural vegetation mosaic) in MODIS collection 5 product. This leads to the uncertainties in spa-tial distribution. Additionally, due to the limited data avail-able, the initial characteristics of the dominant soil in each grid were acquired from a US data set. Although we have matched the soil based on soil type, eco-region, and latitude, uncertainties still existed due to different long-term agricul-ture management.
Based on the algorithm described in Sect. 2.3, the EPIC outputs, including soil NH+
4 concentration, soil volumetric
water content (θs)and soil pH, are important inputs of the
bi-directional module. EPIC has been used and evaluated world wide to simulate the nitrogen cycle and soil water content. Some validation studies have found favorable results for soil nitrogen and/or crop nitrogen uptake levels (Cavero et al., 1998, 1999; Wang et al., 2013). However, less accurate simu-lation results have also been reported (Chung et al., 2002). Li et al. (2004) found that the EPIC model could catch the vari-ation of soil volumetric water content in different years accu-rately, with a relative bias of 11.7 %. The research conducted by Huang et al. (2006) also showed that the EPIC-simulated long-term averageθs values were not significantly different
from the measured values in the Loess Plateau of China. For soil pH, the normal growth pH range of three dominant crops
(rice, corn, and wheat) is 6.0–7.03. The 95 % confidence
in-terval of EPIC-simulated values is 6.3–7.6, which is reason-able and acceptreason-able although uncertainties still exist.
The bi-directional ammonia flux module in CMAQ is the core of this model system. The uncertainties of the bi-directional exchange parameterization would bring uncer-tainties to NH3 emission estimates. Pleim et al. (2013) has
compared the simulated NH3 flux from the box model of
this ammonia bi-directional flux algorithm with observa-tions in three periods. The results showed that the model generally reproduced the observed series and significantly correlated with the observations (p <0.001). The mean normalized biases were 78.6, −49, and 1 % for soybeans (18 June–24 August 2002), corn (21–29 June 2007), and corn (11–19 July 2007), respectively. The soil gamma (Ŵg)
and apoplast gamma (Ŵs)are two important parameters in
this ammonia bi-directional flux algorithm (Bash et al., 2013) and their parameterization remains uncertain (Massad et al., 2010). The field measurements ofŴgandŴsare limited, and
measured values are scattered, owing to complex impact fac-tors (Massad et al., 2010, and reference therein). Dennis et al. (2013) assessed the effects of these uncertainties. A 50 % increase of Ŵg would result in a 42.3 % increase in NH3
emission. Two different parameterization methods of Bash et al. (2013) and Massad et al. (2010) could lead to a 17 % change in NH3emissions.
In order to reduce the uncertainty in emission estimates, work is needed to improve the quality of input data and record additional local measurements of soil and vegeta-tion chemistry. Ambient NH3concentration and flux data are
also needed to enhance and evaluate the parameterizations of EPIC model and bi-directional module.
4 Conclusions
This study provides the first estimates of 2011 NH3
emis-sions from N fertilizer use in China using the bi-directional CMAQ model rather than the traditional “emission factors” method. Hourly NH3emissions can be calculated online with
CMAQ. Compared with previous researches, this method considers more influencing factors, such as meteorological fields, soil and fertilizer application, and provides improved spatial and temporal resolution. The higher resolution of NH3emissions is beneficial for modeling and exploring the
impacts of NH3 emission on air quality. In addition, the
re-sults can be used for a better comparison of novel and tradi-tional methods of emission estimation. This is an important contribution to scientific literature on this topic.
China’s NH3emissions from N fertilizer application were
approximately 3.0 Tg in 2011. The major contributors were Henan, Shandong, Hebei, Jiangsu, and Anhui provinces, ac-counting for 11.1, 9.9, 8.8, 6.7, and 7.1 % of total
emis-3http://njzx.mianxian.gov.cn/xxgk/ccpf/20804.htm;
Table 4.The performance statistics of CMAQ-modeled daily NO−3 concentrations for base case and bidi case, compared to the observations at three monitoring stations.
Shanghai station Suzhou station Nanjing station
June (1–30 Jun 2011)
mean obs. (µg m−3) 7.27 13.43 12.81
base case
mean pred. (µg m−3) 8.41 9.32 13.44
bias (µg m−3) 1.14 −4.10 0.63
NMB (%) 15.65 −30.56 4.90
NME (%) 57.34 40.71 59.93
R 0.83 0.81 0.24
bidi case
mean pred. (µg m−3) 8.60 7.16 7.59
bias (µg m−3) 1.32 −6.26 −5.23
NMB (%) 18.21 −46.63 −40.81
NME (%) 45.07 50.63 60.40
R 0.91 0.83 0.14
August (20 Jul–20 Aug 2011)
mean obs. (µg m−3) 2.99 7.04 6.24
base case
mean pred. (µg m−3) 6.42 14.51 12.02
bias (µg m−3) 3.43 7.46 5.78
NMB (%) 114.84 105.95 92.68
NME (%) 142.48 115.89 97.18
R 0.62 0.28 0.87
bidi case
mean pred. (µg m−3) 4.42 10.36 8.85
bias (µg m−3) 1.43 3.31 2.62
NMB (%) 47.99 47.01 41.92
NME (%) 96.16 79.43 62.64
R 0.64 0.24 0.90
November (1–30 Nov 2011)
mean obs. (µg m−3) 9.42 11.59 14.57
base case
mean pred. (µg m−3) 12.59 16.72 22.62
bias (µg m−3) 3.17 5.14 8.05
NMB (%) 33.68 44.32 55.24
NME (%) 83.85 53.68 74.81
R 0.71 0.72 0.68
bidi case
mean pred. (µg m−3) 12.28 12.41 12.88
bias (µg m−3) 2.86 0.82 −1.68
NMB (%) 30.39 7.05 −11.56
NME (%) 65.33 53.46 43.35
R 0.78 0.72 0.79
sions, respectively. The monthly distribution of these ammo-nia emissions is in line with the pattern of N fertilizer con-sumption. The emissions are dominant from March to July and in October, accounting for 88.7 % of the whole year. Compared to other NH3sources, nitrogen fertilizer
applica-tion is the second largest contributor to NH3 emissions in
China. It is important to reduce the use of N fertilizer to con-trol ammonia emissions.
This is a pilot study to apply this model system to estimate NH3emissions in China and gaps still exist for this method
due to the uncertainties of model parameterization and input data. Much work is still needed to improve this model system when applied to China in the future. For example, it is impor-tant to build the initial soil input file for EPIC based on
Chi-nese soil profile data instead of US data. In addition, ChiChi-nese farmers’ logic of agriculture management must be explored and an automatic management algorithm in the EPIC model for China shall be designed. This model system can be im-proved with additional local measurements of soil and veg-etation chemistry, ambient NH3concentration and flux data
to enhance and evaluate the parameterizations of the EPIC model and bi-directional module.
Although uncertainties still exist in the NH3emission
grid resolutions for China in order to more accurately capture spatial gradients in NH3emissions and the resulting impacts
on air quality. Secondly, this system reflects the impacts of weather and climate on NH3emissions. Therefore, it can be
coupled with climate models to explore the interaction of cli-mate change and NH3emission. When it is linked to a
wa-ter quality and transport model, the impacts of atmospheric nitrogen deposition from CMAQ and nutrient run off from EPIC on water eutrophication are estimated. This study is the first attempt to apply this model system to China, and it is also the foundation for future scientific research.
The Supplement related to this article is available online at doi:10.5194/acp-15-6637-2015-supplement.
Acknowledgements. This work was sponsored by the National Nat-ural Science Foundation of China (21221004), MEP’s special funds for Research on Public Welfare (201309009, 201409002), and the Strategic Priority Research Program of the Chinese Academy of Sciences (XBD05020300). This work was completed on the “Explorer 100” cluster system of Tsinghua National Laboratory for Information Science and Technology. The authors also appreciate the help of Jimmy R. Williams at Texas A&M University, Youlu Bai from the Chinese Academy of Agriculture Sciences, and Margaret Ledyard-Marks in UNC Institute for the Environment. Although this work was reviewed by EPA and approved for publication, it may not necessarily reflect official agency policy. Mention of commercial products does not constitute endorsement by the agency.
Edited by: G. Frost
References
Bash, J. O., Cooter, E. J., Dennis, R. L., Walker, J. T., and Pleim, J. E.: Evaluation of a regional air-quality model with bidirectional NH3 exchange coupled to an agroecosystem model,
Biogeo-sciences, 10, 1635–1645, doi:10.5194/bg-10-1635-2013, 2013. Beusen, A. H. W., Bouwman, A. F., Heuberger, P. S. C., Van Drecht,
G., and Van Der Hoek, K. W. V.: Bottom-up uncertainty esti-mates of global ammonia emissions from global agricultural pro-duction systems, Atmos. Environ., 42, 6067–6077, 2008. Cavero, J., Plant, R. E., Shennan, C., Williams, J. R., Kiniry, J.
R., and Benson, V. W.: Application of epic model to nitrogen cycling in irrigated processing tomatoes under different man-agement systems, Agr. Syst., 56, 391–414, doi:10.1016/s0308-521x(96)00100-x, 1998.
Cavero, J., Plant, R. E., Shennan, C., Friedman, D. B., Williams, J. R., Kiniry, J. R., and Benson, V. W.: Modeling nitrogen cycling in tomato-safflower and tomato-wheat rotations, Agr. Syst., 60, 123–135, doi:10.1016/s0308-521x(99)00023-2, 1999.
Cheng, Z., Wang, S., Jiang, J., Fu, Q., Chen, C., Xu, B., Yu, J., Fu, X., and Hao, J.: Long-term trend of haze pollution and impact
of particulate matter in the Yangtze River Delta, China, Environ. Pollut., 182, 101–110, doi:10.1016/j.envpol.2013.06.043, 2013. Cheng, Z., Wang, S., Fu, X., Watson, J. G., Jiang, J., Fu, Q., Chen,
C., Xu, B., Yu, J., Chow, J. C., and Hao, J.: Impact of biomass burning on haze pollution in the Yangtze River delta, China: a case study in summer 2011, Atmos. Chem. Phys., 14, 4573– 4585, doi:10.5194/acp-14-4573-2014, 2014.
Chung, S. W., Gassman, P. W., Gu, R., and Kanwar, R. S.: Evalua-tion of epic for assessing tile flow and nitrogen losses for alter-native agricultural management systems, Trans. Asae, 45, 1135– 1146, 2002.
CMAS: FEST-C 2014: User’s Guide for the Fertilizer Emission Scenario Tool for CMAQ (FEST-C) Version 1.1, Institute for the Environment, The University of North Carolina at Chapel Hill, Chapel Hill, NC, available at: https://www.cmascenter.org/ fest-c/documentation/1.1/FESTC1_1_userManual.pdf, last ac-cess: 1 November 2014.
Cooter, E. J., Bash, J. O., Walker, J. T., Jones, M. R., and Robarge, W.: Estimation of NH3 bi-directional flux from managed agricultural soils, Atmos. Environ., 44, 2107–2115, doi:10.1016/j.atmosenv.2010.02.044, 2010.
Cooter, E. J., Bash, J. O., Benson, V., and Ran, L.: Linking agri-cultural crop management and air quality models for regional to national-scale nitrogen assessments, Biogeosciences, 9, 4023– 4035, doi:10.5194/bg-9-4023-2012, 2012.
Corstanje, R., Kirk, G. J. D., Pawlett, M., Read, R., and Lark, R. M.: Spatial variation of ammonia volatilization from soil and its scale-dependent correlation with soil properties, Eur. J. Soil Sci., 59, 1260–1270, doi:10.1111/j.1365-2389.2008.01087.x, 2008. Dennis, R. L., Schwede, D. B., Bash, J. O., Pleim, J. E., Walker,
J. T., and Foley, K. M.: Sensitivity of continental United States atmospheric budgets of oxidized and reduced nitrogen to dry deposition parametrizations, Philos. Trans. Roy. Soc. B, 368, 20130124, doi:10.1098/rstb.2013.0124, 2013.
Ding, A. J., Fu, C. B., Yang, X. Q., Sun, J. N., Petäjä, T., Kerminen, V.-M., Wang, T., Xie, Y., Herrmann, E., Zheng, L. F., Nie, W., Liu, Q., Wei, X. L., and Kulmala, M.: Intense atmospheric pol-lution modifies weather: a case of mixed biomass burning with fossil fuel combustion pollution in eastern China, Atmos. Chem. Phys., 13, 10545–10554, doi:10.5194/acp-13-10545-2013, 2013. Dong, W. X., Xing, J., and Wang, S. X.: Temporal and spatial dis-tribution of anthropogenic ammonia emissions in China: 1994– 2006, Huanjingkexue, 31, 1457–1463, 2010.
FAO: Statistical Yearbook 2013: World food and agriculture, Food and Agriculture Organization of the United Nations, 289 pp., ISSN 2225-7373, 2013.
composition change: Ecosystem-atmosphere interactions, At-mos. Environ., 43, 5193–5267, 2009.
Friedl, M. A., Sulla-Menashe, D., Tan, B., Schneider, A., Ra-mankutty, N., Sibley, A., and Huang, X.: MODIS Collection 5 global land cover: Algorithm refinements and characteriza-tion of new datasets, Remote Sens. Environ., 114, 168–182, doi:10.1016/j.rse.2009.08.016, 2010.
Fu, X., Wang, S. X., Cheng, Z., Xing, J., Zhao, B., Wang, J. D., and Hao, J. M.: Source, transport and impacts of a heavy dust event in the Yangtze River Delta, China, in 2011, Atmos. Chem. Phys., 14, 1239–1254, doi:10.5194/acp-14-1239-2014, 2014.
Gassman, P. W., Williams, J. R., Benson, V. W., Izaurralde, R. C., Hauck, L. M., Jones, C. A., Atwood, J. D., Kiniry, J. R., and Flowers, J. D.: Historical Development and Applications of theEPIC and APEX Models, Center for Agricultural and Rural Development, Iowa State University, Ames, Iowa, 2005. He, H., Wang, Y., Ma, Q., Ma, J., Chu, B., Ji, D., Tang, G., Liu,
C., Zhang, H., and Hao, J.: Mineral dust and NOx promote the conversion of SO2 to sulfate in heavy pollution days, Scientific Reports, 4, 4172, doi:10.1038/srep04172, 2014.
Huang, K., Zhuang, G., Lin, Y., Fu, J. S., Wang, Q., Liu, T., Zhang, R., Jiang, Y., Deng, C., Fu, Q., Hsu, N. C., and Cao, B.: Typical types and formation mechanisms of haze in an East-ern Asia megacity, Shanghai, Atmos. Chem. Phys., 12, 105–124, doi:10.5194/acp-12-105-2012, 2012.
Huang, M., Gallichand, J., Dang, T., and Shao, M.: An evalu-ation of EPIC soil water and yield components in the gully region of Loess Plateau, China, J. Agr. Sci., 144, 339–348, doi:10.1017/s0021859606006101, 2006.
Huang, X., Song, Y., Li, M., Li, J., Huo, Q., Cai, X., Zhu, T., Hu, M., and Zhang, H.: A high-resolution ammonia emis-sion inventory in China, Global Biogeochem. Cy., 26, Gb1030, doi:10.1029/2011gb004161, 2012.
Jones, M. R., Leith, I. D., Fowler, D., Raven, J. A., Sutton, M. A., Nemitz, E., Cape, J. N., Sheppard, L. J., Smith, R. I., and Theobald, M. R.: Concentration-dependent NH3 deposition pro-cesses for mixed moorland semi-natural vegetation, Atmos. En-viron., 41, 2049–2060, 2007.
Klimont, Z.: Current and Future Emissions of Ammonia in China, Proceedings of the 10th International Emission Inventory Con-ference “One Atmosphere, One Inventory, Many Challenges”, Denver, CO, 30 April–3 May 2001.
Lepori, F. and Keck, F.: Effects of Atmospheric Nitrogen Deposi-tion on Remote Freshwater Ecosystems, Ambio, 41, 235–246, doi:10.1007/s13280-012-0250-0, 2012.
Li, J., Shao, M. A., and Zhang, X. C.: Simulation of water potential productivity of winter wheat and soil water dynamics on rainfed highland of the LoessPlateau, J. Nat. Resour., 19, 738–746, 2004. Massad, R.-S., Nemitz, E., and Sutton, M. A.: Review and param-eterisation of bi-directional ammonia exchange between vegeta-tion and the atmosphere, Atmos. Chem. Phys., 10, 10359–10386, doi:10.5194/acp-10-10359-2010, 2010.
National Bureau of Statistics of China (NBSC): China Statistical Yearbook 2012, China Stat. Press, Beijing, 2012a (in Chinese). National Bureau of Statistics of China (NBSC): Cost and income
of Chinese farm produce 2012, China Stat. Press, Beijing, 2012b (in Chinese).
Nemitz, E., Milford, C., and Sutton, M. A.: A two-layercanopy compensation point model for describing
bi-directionalbiosphere-atmosphere exchange of ammonia, Q. J. Roy. Meteor. Soc., 127, 815–833, 2001.
Pleim, J. E., Bash, J. O., Walker, J. T., and Cooter, E. J.: Develop-ment and evaluation of an ammonia bidirectional flux parame-terization for air quality models, J. Geophys. Res.-Atmos., 118, 3794–3806, doi:10.1002/jgrd.50262, 2013.
Pope III, C. A., Burnett, R. T., Turner, M. C., Cohen, A., Krewski, D., Jerrett, M., Gapstur, S. M., and Thun, M. J.: Lung Cancer and Cardiovascular Disease Mortality Associated with Ambi-ent Air Pollution and Cigarette Smoke: Shape of the Exposure-Response Relationships, Environ. Health Perspect., 119, 1616– 1621, doi:10.1289/ehp.1103639, 2011.
Ran, L. M., Cooter, E., Benson, V., and He, Q.: Development of an Agricultural Fertilizer Modeling System for Bi-directional Am-monia Fluxes in the CMAQ Model, 31st NATO/SPS Interna-tional Technical Meetingon Air Pollution Modeling and its Ap-plication, Torino, Italy, 2010.
Roelle, P. A. and Aneja, V. P.: Characterization of ammonia emissions from soils in the upper coastal plain, North Car-olina, Atmos. Environ., 36, 1087–1097, doi:10.1016/s1352-2310(01)00355-7, 2002.
Schiferl, L. D., Heald, C. L., Nowak, J. B., Holloway, J. S., Neu-man, J. A., Bahreini, R., Pollack, I. B., Ryerson, T. B., Wied-inmyer, C., and Murphy, J. G.: An investigation of ammo-nia and inorganic particulate matter in Califorammo-nia during the CalNex campaign, J. Geophys. Res.-Atmos., 119, 1883–1902, doi:10.1002/2013jd020765, 2014.
Stevens, C. J., Dise, N. B., Mountford, J. O., and Gowing, D. J.: Im-pact of nitrogen deposition on the species richness of grasslands, Science, 303, 1876–1879, doi:10.1126/science.1094678, 2004. Streets, D. G., Bond, T. C., Carmichael, G. R., Fernandes, S. D., Fu,
Q., He, D., Klimont, Z., Nelson, S. M., Tsai, N. Y., Wang, M. Q., Woo, J. H., and Yarber, K. F.: An inventory of gaseous and primary aerosol emissions in Asia in the year 2000, J. Geophys. Res.-Atmos., 108, 8809, doi:10.1029/2002jd003093, 2003. Sutton, M. A., Schjoerring, J. K., and Wyers, G. P.: Plant
atmo-sphere exchange of ammonia, Philos. T. Roy. Soc., 351, 261– 278, 1995.
Thenkabail, P. S., Biradar, C. M., Noojipady, P., Dheeravath, V., Li, Y. J., Velpuri, M., Reddy, G. P. O., Cai, X. L., Gumma, M., Turral, H., Vithanage, J., Schull, M., and Dutta, R.: A Global Irrigated Area Map (GIAM) Using Remote Sensing at the End of the Last Millennium, International Water Management Institute, Colombo, Sri Lanka, 2008.
Wang, J., Ma, W., and Jiang, R.: Analysis about amount and ratio ofbasal fertilizer and topdressing fertilizer on rice, wheat, maize in China, Chin. J. Soil Sci., 39, 329–333, 2008 (in Chinese). Wang, S., Xing, J., Jang, C., Zhu, Y., Fu, J. S., and Hao, J.:
Im-pact Assessment of Ammonia Emissions on Inorganic Aerosols in East China Using Response Surface Modeling Technique, Environ. Sci. Technol., 45, 9293–9300, doi:10.1021/es2022347, 2011.
Wang, X., Wang, W., Yang, L., Gao, X., Nie, W., Yu, Y., Xu, P., Zhou, Y., and Wang, Z.: The secondary formation of inor-ganic aerosols in the droplet mode through heterogeneous aque-ous reactions under haze conditions, Atmos. Environ., 63, 68–76, doi:10.1016/j.atmosenv.2012.09.029, 2012.
the Loess Plateau of China, Computer and Computing Technolo-gies in Agriculture VII, 2013.
Wang, Z. H., Liu, X. J., Ju, X. T., Zhang, F. S., and Malhi, S. S.: Ammonia volatilization loss from surface-broadcast urea com-parison of vented and closed chamber methods and loss in a win-ter wheat-summer maize rotation in North China Plain, Comm. Soil Sci. Plant Anal., 35, 2917–2939, 2004.
Wichink Kruit, R. J., Schaap, M., Sauter, F. J., van Zanten, M. C., and van Pul, W. A. J.: Modeling the distribution of ammonia across Europe including bi-directional surface–atmosphere ex-change, Biogeosciences, 9, 5261–5277, doi:10.5194/bg-9-5261-2012, 2012.
Williams, J. R., Jones, C. A., and Dyke, P. T.: A modeling approach to determining the relationship between erosion and soil produc-tivity, Trans. ASAE, 27, 129–144, 1984.
Ye, X. N., Ma, Z., Zhang, J. C., Du, H. H., Chen, J. M., Chen, H., Yang, X., Gao, W., and Geng, F. H.: Important role of ammonia on haze formation in Shanghai, Environ. Res. Lett., 6, 024019, doi:10.1088/1748-9326/6/2/024019, 2011.
Zhang, L., Wright, L. P., and Asman, W. A. H.: Bi-directional air surface exchange of atmospheric ammonia: A review of mea-surements and a development of a big leaf model for applica-tions in regional-scale air-quality models, J. Geophys. Res., 115, D20310, doi:10.1029/2009JD013589, 2010.
Zhang, S. D.: The regional fertilizer supply and demand charac-ter and managing strategies in China, Agriculture University of Hebei, Hebei, China, Master thesis, 2008.
Zhang, Y., Luan, S., Chen, L., and Shao, M.: Estimating the volatilization of ammonia from synthetic nitrogenous fer-tilizers used in China, J. Environ. Manage., 92, 480–493, doi:10.1016/j.jenvman.2010.09.018, 2011.
Zhao, B., Wang, S., Wang, J., Fu, J. S., Liu, T., Xu, J., Fu, X., and Hao, J.: Impact of national NOx and SO2 control policies on particulate matter pollution in China, Atmos. Environ., 77, 453– 463, 10.1016/j.atmosenv.2013.05.012, 2013.