www.atmos-meas-tech.net/3/631/2010/ doi:10.5194/amt-3-631-2010
© Author(s) 2010. CC Attribution 3.0 License.
Measurement
Techniques
Extending differential optical absorption spectroscopy for limb
measurements in the UV
J. Puk¸¯ıte1, S. K ¨uhl1, T. Deutschmann2, U. Platt2, and T. Wagner1
1Max Planck Institute for Chemistry, J. J. Becher Weg 27, 55128 Mainz, Germany
2Institute of Environmental Physics, University of Heidelberg, Im Neuenheimer Feld 229, 69120 Heidelberg, Germany Received: 24 September 2009 – Published in Atmos. Meas. Tech. Discuss.: 18 November 2009
Revised: 6 May 2010 – Accepted: 10 May 2010 – Published: 19 May 2010
Abstract. Methods of UV/VIS absorption spectroscopy to determine the constituents in the Earth’s atmosphere from measurements of scattered light are often based on the Beer-Lambert law, like e.g. Differential Optical Absorption Spec-troscopy (DOAS). While the Beer-Lambert law is strictly valid for a single light path only, the relation between the op-tical depth and the concentration of any absorber can be ap-proximated as linear also for scattered light observations at a single wavelength if the absorption is weak. If the light path distribution is approximated not to vary with wavelength, also linearity between the optical depth and the product of the cross-section and the concentration of an absorber can be assumed. These assumptions are widely made for DOAS applications for scattered light observations.
For medium and strong absorption of scattered light (e.g. along very long light-paths like in limb geometry) the rela-tion between the optical depth and the concentrarela-tion of an absorber is no longer linear. In addition, for broad wave-length intervals the differences in the travelled light-paths at different wavelengths become important, especially in the UV, where the probability for scattering increases strongly with decreasing wavelength.
However, the DOAS method can be extended to cases with medium to strong absorptions and for broader wavelength in-tervals by the so called air mass factor modified (or extended) DOAS and the weighting function modified DOAS. These approaches take into account the wavelength dependency of the slant column densities (SCDs), but also require a priori knowledge for the air mass factor or the weighting function from radiative transfer modelling.
Correspondence to:J. Puk¸¯ıte ([email protected])
We describe an approach that considers the fitting results obtained from DOAS, the SCDs, as a function of wavelength and vertical optical depth and expands this function into a Taylor series of both quantities. The Taylor coefficients are then applied as additional fitting parameters in the DOAS analysis. Thus the variability of the SCD in the fit window is determined by the retrieval itself.
This new approach provides a description of the SCD the exactness of which depends on the order of the Taylor ex-pansion, and is independent from any assumptions or a priori knowledge of the considered absorbers.
In case studies of simulated and measured spectra in the UV range (332–357 nm), we demonstrate the improvement by this approach for the retrieval of vertical profiles of BrO from the SCIAMACHY limb observations. The results for BrO obtained from the simulated spectra are closer to the true profiles, when applying the new method for the SCDs of ozone, than when the standard DOAS approach is used. For the measured spectra the agreement with validation mea-surements is also improved significantly, especially for cases with strong ozone absorption.
While the focus of this article is on the improvement of the BrO profile retrieval from the SCIAMACHY limb measure-ments, the novel approach may be applied to a wide range of DOAS retrievals.
1 Introduction
1980; Mount et al., 1987; Solomon et al., 1987; Wahner et al., 1990; Burrows et al., 1999; Platt and Stutz, 2008; Wagner et al., 2008).
For direct light observations, the light path is well defined and the detected integrated number density along the light path, the slant column density (SCD) is related to the vertical column density (VCD, being the number density integrated along the altitude) by an enhancement factor (so called air mass factor, AMF). The AMF only depends on the obser-vation angle and can be calculated by simple trigonometry. For observations of scattered light, which are usually char-acterized by complex viewing geometries, this enhancement factor is no longer a pure geometric quantity but depends strongly on the individual light paths contributing to the mea-surement (e.g. Solomon et al., 1987; Perliski and Solomon, 1993). Therefore, the interpretation of the measurements re-quires advanced radiative transfer modelling (RTM) and in-version algorithms, especially for observations at large solar zenith angle (SZA) or for limb observations (i.e., at tangen-tial view from the satellite into the Earth’s atmosphere).
The AMF for scattered light observations depends on all factors that impact light propagation in the atmosphere (like the SZA, the air density, the abundance of absorbers – e.g. ozone, as well as clouds, aerosols, albedo etc.). In par-ticular, due to the dependence of the propagation of light on scattering and absorption processes, the AMF is a function of wavelength and the absorption strength (Marquard et al., 2000). For the application of DOAS this means that the re-lation between SCD and VCD may vary considerably within the wavelength interval chosen for a DOAS fit (Platt et al., 1997).
While the wavelength dependency of the SCD can be ne-glected for many applications, it was found that it becomes important for cases with strong absorption (e.g., absorption by ozone in the UV) and large SZA for satellite nadir and ground observations (Diebel et al., 1995; Richter, 1997). For limb geometry, where the atmosphere is observed in a tan-gential view, a correction for these effects is even more nec-essary due to the increased light path lengths.
A common approach for this correction is the so called AMF modified or extended DOAS (Diebel et al., 1995; Richter, 1997) which considers the product of the AMFs and the absorption cross-sections in the DOAS analysis instead of the cross-sections alone. Thus, wavelength independent VCDs are fitted directly.
Alternatively, the weighting function DOAS method (Buchwitz et al., 2000; Coldewey-Egbers et al., 2004, 2005; Frankenberg et al., 2005) was developed. It accounts for the wavelength modulation of the slant path by approximating the measured optical depth with a Taylor expansion around the reference intensity at a certain a priori state plus a low order polynomial. For limb observations the so called full re-trieval approach was developed (Rozanov et al., 2005), mod-elling the intensities for all altitudes of one particular limb scanning sequence simultaneously.
In this article, we propose a method that takes into account the dependency of SCD on optical depth and on wavelength already in the fitting procedure itself. Thus, wavelength de-pendent SCDs are determined by DOAS. The pre-calculation of AMFs or weighting functions and intensities is not re-quired, and the approach does not need a priori input for the retrieval of SCDs. The method is based on the formulation of the AMFs (and consequently SCDs) as function of wave-length and optical depth of strong absorbers: a Taylor series expansion for AMFs or SCDs with respect to the wavelength and absorption by trace gases is performed.
The terms of this series are then co-fitted by the least squares approach like the absorption cross-sections in the standard DOAS analysis. From the fitted coefficients, the functional relationship of the SCDs on wavelength and ab-sorption can be determined and taken into account to the pre-cision of the order of the Taylor series expansion.
We study the capability and limitations of the method for the retrieval of vertical BrO profiles from EN-VISAT/SCIAMACHY limb measurements in the near UV spectral region (332–357 nm).The method is applied for sim-ulated spectra for different fit windows to investigate its importance and performance for different spectral regions. Also, to verify that the approach can be applied for improved retrievals from actual measurement data, we compare the ob-tained BrO profiles to those from correlated balloon observa-tions performed for the validation of SCIAMCHY limb mea-surements.
The article is structured as follows: in Sect. 2 we describe the standard DOAS approach, its limitations for strong ab-sorptions and limb geometry, and introduce the Taylor se-ries approach to overcome this problem. Section 3 demon-strates the applicability of the approach to synthetic spectra, and Sect. 4 studies the sensitivity of the novel approach for different absorption strengths, geometries, fit windows and fit parameters. Section 5 shows the application of the ap-proach to real measurements of SCIAMACHY and compares the result with correlated balloon measurements (Dorf et al., 2006). Finally, Sect. 6 draws some conclusions.
2 The method
2.1 Standard DOAS: principle and limitations for strong absorptions and scattered light
2.1.1 Standard DOAS
with known absorption cross-sectionsσi to the difference of the logarithm of a measured spectrumIand a reference spec-trumI0:
ln I0(λ)
I (λ) =
k
X
i=1
σi(λ)·Si + l
X
p=1
apλp
| {z }
P
(1)
Usually, the absorption due to trace gases shows a strong variation with wavelengthλ. It is described by the absorption cross sections of the considered molecules that are known from laboratory measurements. Structures due to scattering, which vary only slowly with wavelength, are described by a broad band polynomialP (last term in Eq. 1) of orderl in the fit analysis (Platt, 1994). The reference spectrum does not include the trace gas absorptions or only contains a small amount. For satellite observations usually a direct Sun spec-trum, or – for limb geometry – a spectrum measured at high tangent height (TH), where the considered trace gas has low concentration, is applied as reference spectrum. In a least squares fit, the differences between the right and left terms of Eq. (1) are minimized for all wavelengths simultaneously providing as result the SCDsSi and polynomial coefficients
apthat fit best to the respective measurement.
The SCD is related to the VCD as the product of AMFAi and VCDVi:
Si=Ai·Vi (2)
Equations (1) and (2) are simplifications in so far as the wavelength dependency of AMF and SCD is not considered. This simplification can be applied for a wide range of obser-vation geometries and absorbers, as long as the dependency of the SCDs on wavelength is negligible within the fitting window.
2.1.2 Limitations for measurements of scattered light
For very long light paths or cases of strong absorption, how-ever, it is found that the variability of the SCD in the fit window becomes important. For standard DOAS applica-tions in satellite nadir geometry, this was first described by Diebel et al. (1995) and Richter (1997): For the retrieval of ozone VCDs from simulated spectra in a wavelength region between 335–346 nm, a discrepancy of∼2% for SZA sig-nificantly below 90◦ and∼15% for SZA near to 90◦ was found with respect to the true column, if the wavelength de-pendence of the SCD is not taken into account.
The wavelength dependence of the SCD is caused by two effects:
(1) The slant path of scattered light varies with wavelength and the light path distribution changes (e.g. Solomon et al., 1987), since the Rayleigh-scattering cross-section varies as the inverse of the wavelength to the fourth power. Also, other scattering and reflection processes
(on clouds, aerosols or ground) in the atmosphere are characterized by broad band functions of wavelength. (2) SCDs vary across spectral structures of the trace gas
absorption cross-sections because different light paths through the atmosphere also depend on the strength of the trace gas absorption (Platt et al., 1997; Marquard et al., 2000). Longer paths with stronger absorption have a smaller intensity and thus contribute less to the measurement than shorter paths with weaker absorp-tion. Therefore the average path will be shorter and the SCD lower for stronger absorption. This effect be-comes more pronounced for stronger absorption and when light crosses the atmosphere along very different trajectories. In contrast to the broad band scattering ef-fect, the wavelength dependence caused by absorption can have a narrowband component of SCD variation be-cause it depends on the absorption cross-sections of the absorbing trace gases.
Thus, the assumption of a wavelength and absorption inde-pendent SCD may lead to errors in the detection of all trace gases analyzed in a specific wavelength interval. In partic-ular, neglecting the wavelength dependency for strong ab-sorbers will affect the retrieval of minor abab-sorbers. A more accurate description of the relation between vertical and slant column density should therefore take into account also the dependency on wavelength and vertical optical depthυ (Mar-quard et al., 2000):
Si =Si(λ,υ)=Ai(λ,υ)·Vi (3)
For a number ofkabsorbers, the total vertical optical depth is the sum of the vertical optical depths of the individual ab-sorbers:
υ= k
X
i=1
Viσi (4)
2.1.3 AMFs for strong absorptions in limb geometry
In limb geometry, light detected by the instrument arises from various locations along the LOS which has a length on the order of up to one thousand km through the Earth’s atmo-sphere. Due to the wavelength dependency of the scattering and also the absorption processes, the length and the geome-try of individual light paths differ significantly, resulting in a variation of the AMF (or the SCD) with wavelength for limb geometry much stronger than for nadir geometry.
Examples of AMFs for the wavelength region of 332– 357 nm are illustrated in Fig. 1 for nadir (left panel) and limb (right panel) geometry for predefined atmospheric scenarios (parameters of the simulation are given in Table 1). The am-plitudes of the AMF variations with respect to the mean value and their standard deviation are given in Table 2.
Table 1.Parameters used for the simulation studies.
Parameter Description of main settings Settings for the AMF comparison Settings for the sensitivity studies
RTM model Full spherical 3-D Monte Carlo RTM McArtim (Deutschmann, 2009). Simulations for 10 million photon trajectory ensembles. Atmosphere discretized in 1 km layers up to 100 km.
Atmosphere Rayleigh atmosphere (i.e. without clouds and aerosols).
Ground albedo 0.3
Atmospheric profiles of T, p Subarctic scenario corresponding Ozone profile also scaled to 200 DU Ozone profile also scaled to 200 DU and trace gases (O3, NO2 to Kiruna (67.9◦N) in March, (additionally to the main setting). (additionally to the main setting).
and BrO). (Profiles of ozone ozone VCD of 460 DU. Additionally, tropical scenario, (ozone
are provided in Fig. 2) VCD=270 DU, maximum concentration
of ozone at 28 km).
Geometry Geometry (SZA, SAA) from Additionally: Additionally to the main settings,
SCIAMACHY orbit 5545 with – AMFs at SZAs of 90◦, 88.5◦and scenarios with SZA=43◦at TP. SZA at tangent point of 75◦, 43◦for nadir.
SAA=60◦. For limb geometry:
– AMFs at SZAs=88.5◦ – AMF for tropical scenario with SZA=43◦at tangent point (TP). (For the case with SZA=43◦, also ozone profile of 200 DU is applied)
Wavelength region 338–357 nm. AMFs are studied in 332–357 nm Different fit windows within the
region. 332–357 nm region.
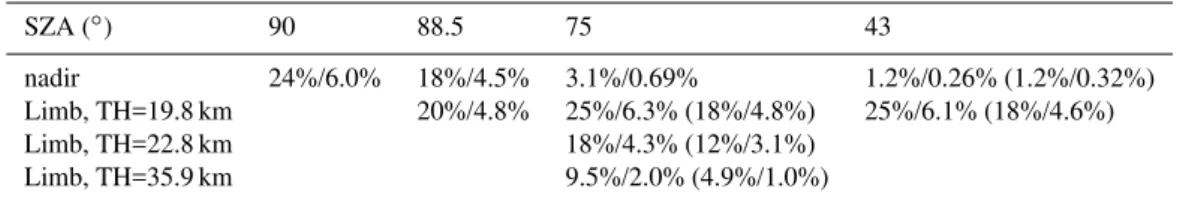
Table 2. Variation of AMFs of ozone in the wavelength range of 332–357 nm for different observation geometries and ozone profile with VCD of 460 DU (in brackets values for the scenario with VCD of ozone of 200 DU are given). The first number gives the difference between maximum and minimum values of AMFs normalized by the mean of AMFs in the wavelength range; the second number is the standard deviation. Calculations are performed only for selected geometries and SZAs in order to illustrate the general tendencies.
SZA (◦) 90 88.5 75 43
nadir 24%/6.0% 18%/4.5% 3.1%/0.69% 1.2%/0.26% (1.2%/0.32%)
Limb, TH=19.8 km 20%/4.8% 25%/6.3% (18%/4.8%) 25%/6.1% (18%/4.6%)
Limb, TH=22.8 km 18%/4.3% (12%/3.1%)
Limb, TH=35.9 km 9.5%/2.0% (4.9%/1.0%)
Fig. 1), with a slight increase towards larger wavelengths. Additionally, at wavelengths, where absorption by ozone is stronger, AMFs are decreased by∼2% at 334 nm because of the increased ozone absorption cross-section. For a SZA of 90◦(green line), however, the AMF increase for longer wave-lengths is much stronger and the variation along the ozone absorption bands is more prominent, resulting in a variation of the AMFs in the fit window of around 25%.
This strong dependency of the AMF on wavelength causes the discrepancies in the ozone retrieval described by Diebel et al. (1995) and Richter (1997).
Compared with the nadir viewing geometry, the variation with wavelength for limb geometry is one order of magnitude stronger for a scenario with SZA=75◦and the ozone VCD of 460 DU (solid red and cyan lines in the right panel of Fig. 1). The variation is around 25% with up to∼10% decrease at
the ozone absorption bands for a TH near the peak of the BrO and ozone profile.
A clear dependency of the AMF of ozone on its opti-cal depth is observed: For an ozone profile with a VCD of 460 DU (solid red and cyan lines in the plot) the AMFs de-crease in comparison to the ozone profile scaled to a VCD of 200 DU (dashed red and cyan lines). The difference is stronger for those wavelengths where the absorption cross-section of ozone is larger. The ozone profiles applied for the simulations are plotted in Fig. 2.
Due to the long light paths for limb geometry and the re-sulting large differences of the light paths, the strong vari-ation of the AMF with wavelength occurs already for low SZAs.
Nadir Limb
SZA=75o , O
3VCD=460 DU SZA=90o , O
3VCD=460 DU
SZA=75o, TH=19.8km, O3VCD=460 DU
– –SZA=75o, TH=19.8km, O
3scaled to 200 DU SZA=75o, TH=22.8km, O
3VCD=460 DU – –SZA=75o, TH=22.8km, O3scaled to 200 DU
SZA=88.5o, TH=19.8km, O
3VCD=460 DU
Wavelength (nm)
Air Mass Factor Air Mass Factor Air Mass Factor Air Mass Factor
Wavelength (nm)
330 335 340 345 350 355 360
8 9 10 11 12 13 14
330 335 340 345 350 355 36015
16 17 18 19 20 21
330 335 340 345 350 355 360
3 3.5 4 4.5 5 5.5 6 6.5 7
330 335 340 345 350 355 36010
10.5 11 11.5 12 12.5 13 13.5 14 14
Fig. 1.AMFs of ozone for nadir (left) and limb geometry (right) as function of wavelength for different atmospheric scenarios (see legend and Table 1 for details).
a result, for nadir observations, only a small part of all satel-lite measurements is affected by large discrepancies. In con-trast, for limb geometry light paths are much longer, result-ing in larger differences between light paths. Consequently a strong variation of the AMF with wavelength occurs already at small SZA. Hence, every limb measurement is affected significantly.
2.2 A new approach for accounting for the variability of SCDs and AMFs in the DOAS fit
In the following, we introduce a new approach to take into account the spectral dependency of the SCD or AMF on wavelength in the DOAS fit, and thereby to minimize the associated retrieval error. As summarized above (see Sects. 2.1.2 and 2.1.3), the wavelength dependency of the SCD and the AMF results from scattering and absorption processes (Eq. 3). Both processes can be described by a broad band function of wavelength and/or the vertical optical depth (which itself shows a narrow band variation on wave-length). Thus, it is reasonable to formulate the SCD or the AMF as a function of wavelength and vertical optical depth. The Taylor series expansion for such a function generally can be written as:
F (λ,υ)= ∞
X
n=0 ∞
X
m=0
∂n∂m ∂λn∂υm
F (w,d)
n!m! (λ−w)
n(υ−d)m (5)
F (λ,υ) can be either the SCD or AMF at wavelength
λ and vertical optical depthυ being approximated around wavelengthw and vertical optical depthd. nandmis the order of derivation with respect to wavelengthλand vertical optical depthυ, respectively.
0 2 4 6 8
x 1012 10
15 20 25 30 35 40 45 50
O3number density (molec./cm3)
Altitude (km)
main (subarctic), VCD = 460 DU main scaled to VCD = 200 DU tropical scenario, VCD = 270 DU
Fig. 2.Different ozone profiles applied for the simulation of spectra, air mass factor calculations and sensitivity studies.
When taking into account the terms up to the 1st order, the wavelength and optical depth dependent SCD is described by:
S(λ,υ)≈S0∗(w,d)+Sλ(w,d)λ+Sυ(w,d)υ (6) where the subscripts indicate the quantity with respect to which the partial derivatives are performed andS0∗(w,d)is the sum of the 0-th order terms:
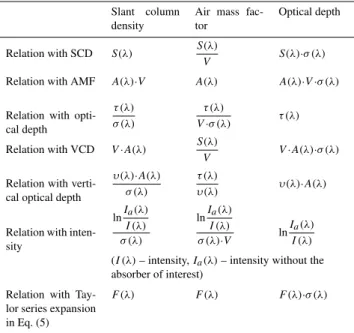
Table 3.Relation of the spectral quantities with Eq. (5) and to each other.
Slant column density
Air mass fac-tor
Optical depth
Relation with SCD S(λ) S(λ)
V S(λ)·σ (λ) Relation with AMF A(λ)·V A(λ) A(λ)·V·σ (λ) Relation with
opti-cal depth
τ (λ) σ (λ)
τ (λ)
V·σ (λ) τ (λ)
Relation with VCD V·A(λ) S(λ)
V V·A(λ)·σ (λ)
Relation with verti-cal optiverti-cal depth
υ(λ)·A(λ) σ (λ)
τ (λ)
υ(λ) υ(λ)·A(λ)
Relation with inten-sity
lnIa(λ) I (λ) σ (λ)
lnIa(λ) I (λ)
σ (λ)·V ln Ia(λ)
I (λ) (I (λ)– intensity,Ia(λ)– intensity without the absorber of interest)
Relation with Tay-lor series expansion in Eq. (5)
F (λ) F (λ) F (λ)·σ (λ)
optical depth), the last term of Eq. (6) becomes (compare with Eq. 4 whenk=1):
Sυυ≈Sυ υs z}|{ Vs
| {z }
Ss
σs =Ssσs (8)
whereSsis the product ofSυand the VCD of the absorbers, andσs its cross-section.
Thus Eq. (6) becomes:
S(λ,υ)≈S0∗(w,d)+Sλ(w,d)λ+Ss(w,d)σs (9) In the DOAS equation, the optical depth of a particular trace gas is a product of its SCD and cross-sectionσ. There-fore, the optical depth for an absorberaaccording to Eq. (9) is:
τa(λ,υ)≈S0,a∗ σa+Sλ,aλσa+Ss,aσsσa (10) ParametersS0,a∗ ,Sλ,a andSs,a are functions linearized at ar-bitrary wavelengthw and vertical optical depth d, and are determined by a common least squares DOAS fit. The to-tal wavelength dependent SCDSof the considered absorber then results from Eq. (9).
If we consider only the absorption of the strong absorber (i.e. s=a) and write Eq. (10) for the optical depth of this absorber, it becomes:
τs(λ,υ)≈S0,s∗ σs +Sλ,sλσs+Ss,sσs2 (11) Because the vertical optical depths of minor absorbers cause only negligible contributions to the total optical depth,
it is necessary to consider the wavelength dependency of the SCD only for strong absorbers in practice. For example, in Sect. 3 we show that the DOAS retrieval of BrO is improved considerably when including the first order terms according to Eqs. (6) and (11) for the ozone SCD in the spectral anal-ysis (in the following, this first order approximation is re-ferred to as the Taylor series approach). Taking into account the wavelength dependency of the SCDs also for minor ab-sorbers further improves the retrieval (see Appendix C).
The mathematical relations for the spectroscopic quanti-ties SCD, AMF and optical depth are summarized in Table 3. In Appendix A we show that the AMF (and thus also SCD) can be approximated by the Taylor series approach up to a precision on the order of the simulation error of the AMFs. If the absorption of minor absorbers is not accounted for, the approximation of AMFs is improved by one order of magni-tude in the fit window of 338–357 nm.
3 Application of the Taylor series approach to DOAS retrieval from simulated spectra
In the following, we compare the new retrieval approach to standard DOAS and the AMF modified DOAS by performing the DOAS fit i.e. retrieving SCDs of several absorbing trace gases (ozone, BrO and NO2) from simulated spectra.
For the study, we apply spectra simulated by the RTM McArtim with the main settings provided in Table 1, cor-responding to the SCIAMACHY limb scanning sequence on 23 March 2003 over Kiruna with a SZA of 75◦at the tangent point (TP). The output of the RTM is the sun normalized ra-diance,I /I0. The wavelength range of 338–357 nm, which is employed in our standard retrieval algorithm for BrO, is used, for details see K¨uhl et al. (2008).
The standard DOAS approach for the absorption of ozone, NO2and BrO according to Eq. (1) is:
ln I0
I =SO3σO3+SNO2σNO2+SBrOσBrO+P (12)
In the considered UV spectral range the absorption by ozone dominates. Taking into account the first order Tay-lor series expansion for this strong absorber (s=O3in Eqs. 9 and 11), the DOAS equation becomes:
ln I0
I =S
∗
0,O3σO3 +Sλ,O3λσO3 +SO3,O3σ 2 O3
| {z }
τO3
(13)
+SNO2σNO2 +SBrOσBrO+P
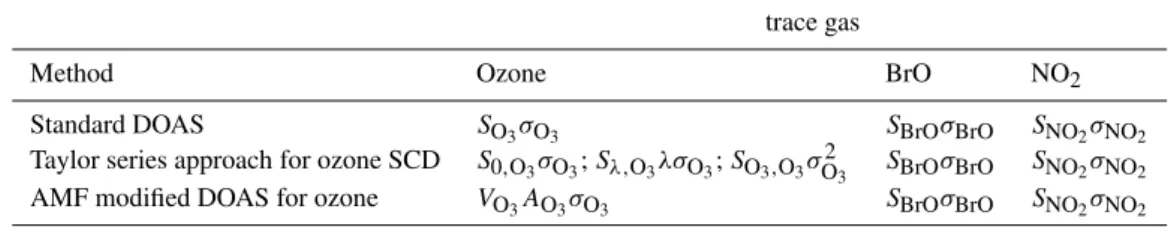
Table 4.Fit terms describing the trace gas absorptions for different approaches in the DOAS fit.
trace gas
Method Ozone BrO NO2
Standard DOAS SO3σO3 SBrOσBrO SNO2σNO2
Taylor series approach for ozone SCD S0,O3σO3;Sλ,O3λσO3;SO3,O3σ 2
O3 SBrOσBrO SNO2σNO2
AMF modified DOAS for ozone VO3AO3σO3 SBrOσBrO SNO2σNO2
acquired from the fitted coefficientsS0,O3,Sλ,O3 andSO3,O3 according to Eq. (9).
Alternatively for comparison we apply also the AMF modified DOAS method (according to Diebel et al., 1995; Richter, 1997) where the variation of the ozone SCD in the fit window is described by the AMF:
ln I0
I =VO3AO3
| {z }
SO3
σO3 +SNO2σNO2 +SBrOσBrO+P (14)
Here the VCD of ozone is acquired directly by fitting the
AO3σO3 term (where the AMFs should be calculated for ev-ery wavelength in advance for an a priori scenario). The SCD is obtained as the product of the fitted VCD and the AMFs used for the fit.
Table 4 summarizes the terms used for the description of the optical depth by the different approaches.
3.1 Improvement for the retrieval of ozone SCDs
Since the new Taylor series approach is applied for the SCDs of ozone, we first investigate in how far the improved de-scription of the wavelength dependency of the ozone SCDs (Eq. 14) results in an improvement for the fit. Later we study also the related improvement for the fit of the weak absorber BrO (Sect. 3.2).
Figure 3 shows the relative deviation of the fitted SCDs of ozone from the true values simulated by the RTM for selected THs (19.8 and 22.8 km, near the peak of the BrO profile). Included are the results for the Taylor series approach, the standard DOAS and the AMF modified DOAS (Eqs. 12–14). The standard DOAS approach, which neglects the varia-tion of the ozone SCD in the fit window, gives more than 10% underestimation at some wavelengths with respect to the true values of the SCDs (dashed lines in Fig. 3). This dif-ference reflects the variability of the AMFs in the fit window discussed in the section before. The discrepancy is largest at longer wavelengths (outside the strong absorption bands) because the DOAS fit is more constrained by wavelength regions with strong variations of the cross-section (see e.g. Marquard et al., 2000).
In comparison, the novel approach for the parameteriza-tion of the SCDs of ozone by the Taylor series approach im-proves the retrieval significantly (see solid lines in Fig. 3):
335 340 345 350 355 360 -12
-10 -8 -6 -4 -2 0 2
TH=19.8km, AMF modified DOAS TH=22.8km, AMF modified DOAS TH=19.8km, standard DOAS TH=22.8km, standard DOAS
TH=19.8km, Taylor series approach TH=22.8km, Taylor series approach
SCD retrieved w.r.t. SCD simulat
ed (%)
wavelength (nm)
Fig. 3.Relative difference between the retrieved and the true (sim-ulated) ozone SCDs using different approaches. Plots are for two THs near the peak of the BrO profile (19.8 and 22.8 km). The same relative differences are valid also for the relation between fitted and true optical depths.
the deviation from the true value is only 1.5% at maximum at the longer wavelength edge of the fit window. Similarly as for the description of the AMFs in Appendix A, the improve-ment is one order of magnitude, compared with the standard approach. These results indicate that the approach allows to account much better for the wavelength variation of the ozone SCD in the fit window, even without knowledge of the ozone AMFs. The remaining negative discrepancy and the structures at the BrO absorption peaks in the figure can be explained by unfitted higher order terms and the impact of minor absorbers on the ozone SCD (compare Appendix A).
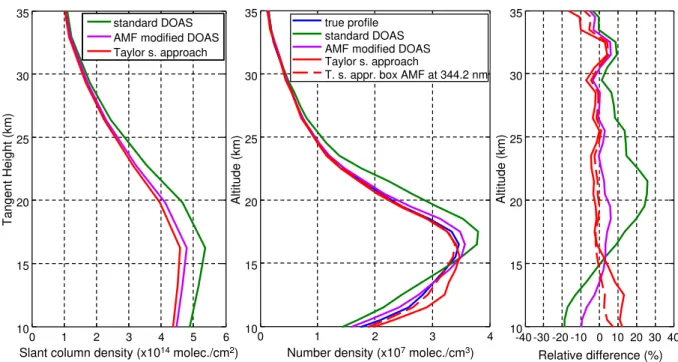
0 1 2 3 4 10
15 20 25 30 35
Altitude (km)
true profile standard DOAS AMF modified DOAS Taylor s. approach
T. s. appr. box AMF at 344.2 nm
-40 -30 -20 -10 0 10 20 30 40 10
15 20 25 30 35
Relative difference (%)
Altitude (km)
0 1 2 3 4 5 6
10 15 20 25 30 35
Slant column density (x1014molec./cm2)
Tangent Height (km)
standard DOAS AMF modified DOAS Taylor s. approach
Number density (x107molec./cm3)
Fig. 4. BrO SCDs (left panel) and the vertical concentration profiles (middle panel) retrieved by different approaches (green: standard DOAS, violet: AMF modified DOAS, red: Taylor series approach, dashed red: AMFs for the Taylor series approach evaluated at a single wavelength of 344.2 nm). The right panel shows the relative difference of the retrieved profiles to the true concentration profile applied for the simulation.
At certain wavelengths the discrepancy of the SCD re-trieved by the standard DOAS with the true SCD is much smaller than 10%, for wavelengths around 340 nm, even an agreement can be found. Although this agreement cannot be extrapolated for every scenario, it is possible to retrieve a rather accurate ozone profile by applying the AMF for the wavelength region with the smallest discrepancy. Thus the introduced Taylor series approach would not always be nec-essary for the ozone profile retrieval. However, the unfitted ozone absorption structures that arise from not taking into account the wavelength dependency of the ozone SCD cause large errors in the retrieval of minor absorbers as is shown in detail in the following section.
3.2 Improvement for the retrieval of BrO
In the following, we show that the improvement in the ozone SCD retrieval by the Taylor series approach results also in an improvement of the BrO SCD retrieval (Sect. 3.2.1) and therefore in a much better agreement of the retrieved BrO vertical profile with the true simulated profile, compared to standard DOAS (Sect. 3.2.2).
3.2.1 Slant column density of BrO
For the same scenario and spectra as in Sect. 3.1, we now in-vestigate the values retrieved for the BrO SCDs by the three approaches (i.e. standard DOAS, Taylor series approach for
the SCDs of ozone, and AMF modified DOAS for ozone), see Fig. 4 (left panel). The values for standard DOAS (green line) are by up to 15% larger compared to the Taylor series approach (red line) or AMF modified DOAS (magenta line). This can be explained by unfitted structures in the fit residual (see Fig. 5) that increase the retrieval error for the standard DOAS approach: As illustrated in Fig. 5, residual structures around the ozone absorption bands occur because the varia-tion of the SCD of ozone within the fit window is not taken into account. These ozone specific absorption structures re-main because they are not (completely) allocated to other fit parameters. However, misallocation of some optical depth of ozone to BrO takes place: The underestimation of the SCD (or optical depth) of ozone at the absorption bands of BrO (compare e.g. SCD of ozone at 338 nm, where the strongest BrO absorption band occurs, in Fig. 3) leads to an overesti-mation of the retrieved SCDs of BrO in the standard DOAS. This dependency of the retrieved BrO SCDs on ozone ab-sorption is investigated in more detail in Appendix C.
335 340 345 350 355 360 0
5
10x 10
-3
335 340 345 350 355 360
-4 -2 0 2 4
x 10-3
335 340 345 350 355 360
0 5
10x 10
-3
335 340 345 350 355 360
-4 -2 0 2 4
x 10-3
335 340 345 350 355 360
0 5
10x 10
-3
335 340 345 350 355 360
-4 -2 0 2 4
x 10-3
wavelength (nm) wavelength (nm)
wavelength (nm)
R
es
idua
l
R
es
idua
l
Br
O
optica
l d
epth
Br
O
optica
l d
epth
Standard DOAS Taylor series approach AMF modified DOAS
true fitted fitted+resid.
true fitted fitted+resid.
true fitted fitted+resid.
Br
O
optica
l d
epth
wavelength (nm) wavelength (nm)
wavelength (nm)
R
es
idua
l
Fig. 5.Left panel: Retrieved optical depth of BrO for TH=22.8 km by the standard DOAS fit. Middle panel: same but for the Taylor series approach. Right panel: same but for AMF modified DOAS for ozone. Top panels show the true optical depth of BrO (blue), fitted optical depth of BrO (red) and the optical depth plus residual structures (green). The bottom panels show the residuals alone.
the strongest absorption peaks of BrO, and the discrepancy shows only negligible influence by ozone absorption (see also Appendix C).
3.2.2 Improvement for the retrieved BrO profile
In the next step, the BrO profile is determined by inversion of the BrO SCDs. For this purpose, we apply our general retrieval algorithm based on the linear optimal estimation method (Rodgers, 2000) and described in detail in Puk¸¯ıte et al. (2006) and K¨uhl et al. (2008). The a priori settings are se-lected assuring that the measurement response (i.e., the sum of the rows of the averaging kernel matrix) is close to unity at altitudes between 13 to 35 km for all of the three approaches (standard DOAS, Taylor series approach and AMF modified DOAS), i.e. thereby minimizing the impact of a priori as-sumptions. To achieve this, an a priori profile as 2/3 of the true profile is used, with an a priori uncertainty of 100% of its maximum value. The retrieval is performed on a 1 km altitude grid. For smoothing purposes, a correlation length (see Rodgers, 2000, page 38) of 3.5 km is introduced in the a priori covariance matrix. With these settings, the impact of the a priori is minimized for this altitude range so that even a shift of the a priori profile by 3 km downwards results in less than∼2% differences in retrieved profiles both for the Taylor series approach and AMF modified DOAS, and less than∼5% changes for the standard DOAS.
Box AMFs for the inversion are calculated for the same atmospheric conditions as the simulated spectra, in order to limit related systematical retrieval errors in the compar-ison of the three approaches. Box AMFs are derived by a weighted average calculated at different wavelengths based on an approach by Marquard et al. (2000) that the fit is constrained stronger by absorption structures that vary more
rapidly with wavelength. An alternative retrieval is per-formed with box AMFs calculated at a single wavelength of 344.2 nm. At this wavelength, the retrieved BrO SCDs agree with the true SCDs of BrO within∼3% for different ozone profiles as it is deduced from sensitivity studies, see e.g. Fig. C1, second panel from top, in the Appendix C.
The obtained vertical concentration profiles are shown to-gether with the true profile in Fig. 4 (middle panel), the dif-ference is plotted in the right panel. The profile retrieved from SCDs acquired by standard DOAS shows a shift up-wards (by ∼1.5 km) and too large values at the peak by ∼10%. The overestimation above the peak is more than 20 or 25% for altitudes with large ozone concentration, i.e. around 20 km (compare with Fig. 2). On the other hand, the profile obtained by AMF modified DOAS or the Taylor series ap-proach agrees much better with the true profile. For altitudes between 15 and 28 km the agreement for the Taylor series approach is better than 5%. For altitudes below 15 km the discrepancy increases to∼10% (note that below 12 km the measurement response is very low).
Thus, although the wavelength dependency of the SCDs of minor absorbers is not taken into account, the retrieval of BrO is improved considerably by taking the variability of the SCD of ozone in the fit window into consideration.
The disagreement around altitudes of 19 km for the AMF modified DOAS and the slightly lower values for the Taylor series approach probably arise from the interference with the absorption structures of the minor absorbers (note that both AMF modified DOAS and the Taylor series DOAS are per-formed only for the SCD of ozone).
main fit window of 338 – 357 nm
330 335 340 345 350 355 360
0 0.5 1 1.5 2 2.5
wavelength (nm)
BrO
c
ross-sections (x10
–17
cm
2)
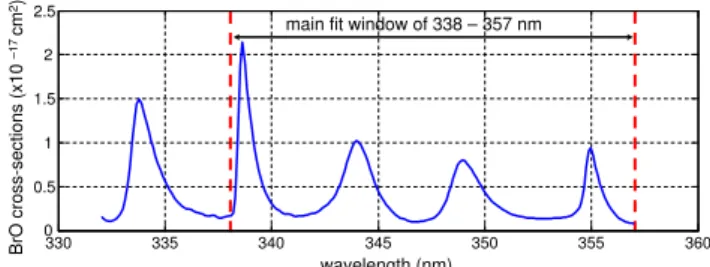
Fig. 6. BrO absorption cross-section (Fleischmann et al. (2004)) used for simulations of spectra, convoluted to SCIAMACHY reso-lution of FWHM of 0.21 nm. In the main settings the fit window from 338–357 nm is applied (indicated by red lines in the plot). For the sensitivity studies, different fit windows containing 2–5 BrO ab-sorption peaks within the wavelength region from 332–357 nm are investigated.
within 3% for most altitudes (compare also sensitivity stud-ies in Appendix C).
It should be noted that all discussed methods can use an iterative scheme in order to improve the profile retrieval, e.g., by applying the retrieved information for the calculation of AMFs or weighting functions in the next iteration step.
4 Sensitivity studies with simulated spectra
The previous section revealed that the Taylor series approach for the ozone SCD significantly improves the retrieval both for ozone and for the minor absorber BrO for the fit window of 338–357 nm. The agreement with the true (simulated) val-ues is better and the fit quality increases, which is reflected by reduced fit residual. This was shown for a subarctic atmo-spheric scenario with a relatively strong absorption of ozone (VCD=460 DU).
In this section we investigate the new retrieval approach for different fit windows (see Sect. 4.1) and for different ab-sorption strengths of ozone and BrO by assuming different atmospheric profiles (Sect. 4.2).
Additionally, in Appendix C, we present a study of the possibility to describe also the SCDs of the minor absorber BrO by Taylor series terms.
4.1 Application of the method to different fit windows
Since the strength of absorption and the scattering probability in the atmosphere vary with wavelength, the improvement of the retrieval by the Taylor series approach with respect to standard DOAS may be different for fit windows covering various wavelength ranges.
We investigate the applicability of the approach for differ-ent fit windows in the range from 332–357 nm where BrO absorption is largest (see Fig. 6).
We perform the DOAS retrieval considering various pa-rameters of the Taylor series: either including all three terms
of ozone optical depth in Eq. (14); accounting only for the broad band wavelength dependency (by the first and the sec-ond term in the equations); or considering only the narrow band dependency due to the ozone absorption structures (by the first and the third term). For comparison, we also apply the standard DOAS retrieval. The focus here is on the BrO retrieval, the impact on the ozone SCD is explored for the fit window of 338–357 nm in Appendix B.
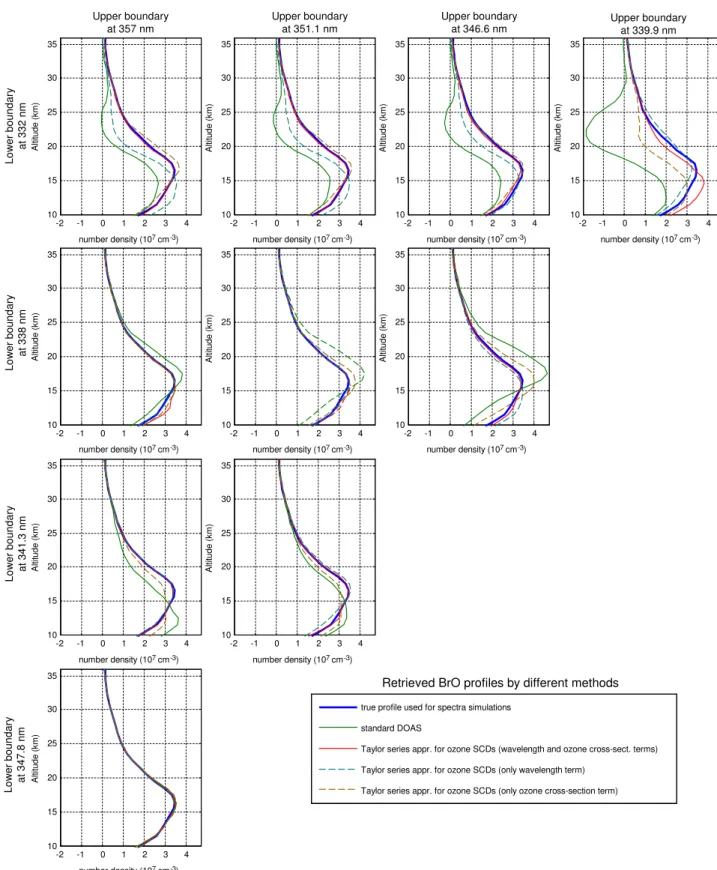
The study is performed for all possible combinations of fit windows with 2–5 BrO absorption peaks. The fit windows and the retrieved BrO profiles are depicted in Fig. 7. A com-parison of the quality of the profiles retrieved by the different methods is given in Table 5.
Standard DOAS: Summarizing the results, standard DOAS (green lines in Fig. 7) gives better results for fit windows that do not include the first absorption peak of BrO at 334 nm because otherwise large retrieval errors (due to large struc-tures in the residuals) are obtained. If only two absorption bands are considered (plots on the far right), the error de-creases if the bands at larger wavelengths are included in the fit due to the decrease in ozone absorption. Therefore, very good agreement for standard DOAS is obtained only for the fit window 347.8–357 nm (see the plot in the bottom panel).
Taylor series approach: The retrieved BrO profile (red lines in the Fig. 7) is considerably improved compared with the standard DOAS. Only small discrepancies (not much larger than 5%) are found for the fit windows starting at shorter wavelengths, probably because of the small effect of minor trace gases on the optical depth of ozone.
The agreement is best for either very large fit windows (332–357 nm and 332–351.1 nm, first and second plots from left at the top in the figure), or for fit windows at longer wave-lengths where ozone absorption is smaller (those starting at 341.3 nm, see last two panels at the bottom of Fig. 7).
Separate terms of Taylor series approach: Some improve-ment is already gained with respect to standard DOAS if only either the wavelength dependency term (Sλ,O3λσO3) or the cross-section dependency term (SO3,O3σO23) for the optical depth of ozone is included in the analysis (green and brown dashed lines in Fig. 7, respectively). In particular, a good agreement with the true profile is found for cases when only the wavelength term is considered for the fit windows with the lower boundary at or above 338 nm (see plots in the last panels at the top of the figure). For fit windows including the much stronger ozone absorption band at 334 nm (plots in the top panel), however, the consideration of the cross-section term in describing the ozone SCDs is important in order to retrieve correct values for the BrO concentration. Neglecting this term can lead to errors of up to 20%.
Upper boundary at 357 nm
Upper boundary at 351.1 nm
Upper boundary at 346.6 nm
Upper boundary at 339.9 nm
Lo w er bound ar y at 332 nm Lo w er bound ar y at 338 nm Lo w er bound ar y at 341.3 n m Lo w er bound ar y at 347.8 n m
-2 -1 0 1 2 3 4 10 15 20 25 30 35
number density (107cm-3)
A lti tud e ( k m )
-2 -1 0 1 2 3 4 10 15 20 25 30 35
number density (107cm-3)
Alti tu de ( k m )
-2 -1 0 1 2 3 4 10 15 20 25 30 35
number density (107cm-3)
Alti tu de ( k m )
-2 -1 0 1 2 3 4 10 15 20 25 30 35
number density (107cm-3)
Alti tu de ( k m )
-2 -1 0 1 2 3 4 10 15 20 25 30 35
number density (107cm-3)
A lti tud e ( k m )
-2 -1 0 1 2 3 4 10 15 20 25 30 35
number density (107cm-3)
Alti tu de ( k m )
-2 -1 0 1 2 3 4 10 15 20 25 30 35
number density (107cm-3)
Alti tu de ( k m )
-2 -1 0 1 2 3 4 10 15 20 25 30 35
number density (107cm-3)
A lti tud e ( k m )
-2 -1 0 1 2 3 4 10 15 20 25 30 35
number density (107cm-3)
Alti tu de ( k m )
-2 -1 0 1 2 3 4 10 15 20 25 30 35
number density (107cm-3)
A lti tud e ( k m )
true profile used for spectra simulations
standard DOAS
Taylor series appr. for ozone SCDs (wavelength and ozone cross-sect. terms)
Taylor series appr. for ozone SCDs (only wavelength term)
Taylor series appr. for ozone SCDs (only ozone cross-section term)
Retrieved BrO profiles by different methods
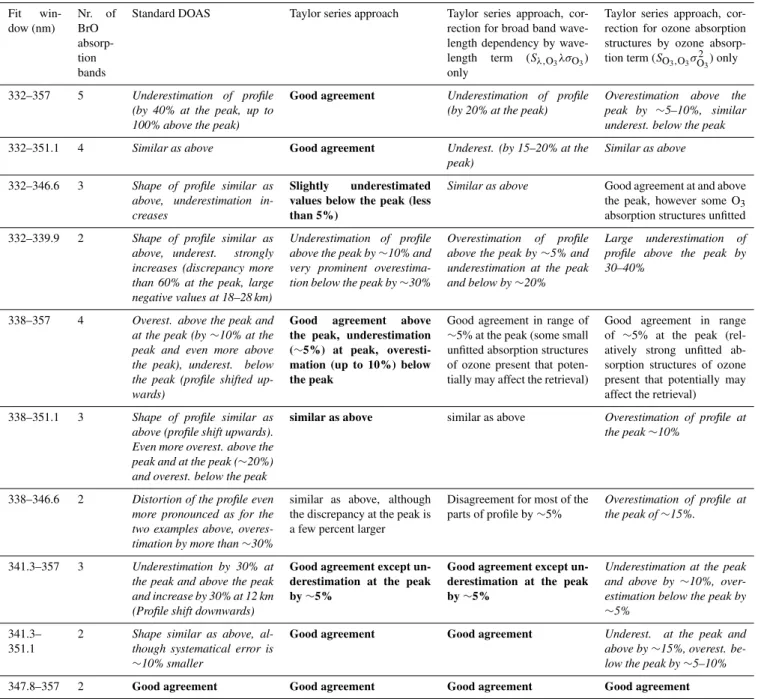
Table 5.Characterization of the BrO retrieval results obtained by different methods and applying different fit windows. Text in bold indicates good agreement, text in italic significant disagreement.
Fit win-dow (nm)
Nr. of BrO absorp-tion bands
Standard DOAS Taylor series approach Taylor series approach, cor-rection for broad band length dependency by wave-length term (Sλ,O3λσO3)
only
Taylor series approach, cor-rection for ozone absorption structures by ozone absorp-tion term (SO3,O3σ
2 O3) only
332–357 5 Underestimation of profile
(by 40% at the peak, up to 100% above the peak)
Good agreement Underestimation of profile (by 20% at the peak)
Overestimation above the peak by ∼5–10%, similar underest. below the peak
332–351.1 4 Similar as above Good agreement Underest. (by 15–20% at the
peak)
Similar as above
332–346.6 3 Shape of profile similar as above, underestimation in-creases
Slightly underestimated values below the peak (less than 5%)
Similar as above Good agreement at and above the peak, however some O3 absorption structures unfitted
332–339.9 2 Shape of profile similar as above, underest. strongly increases (discrepancy more than 60% at the peak, large negative values at 18–28 km)
Underestimation of profile above the peak by∼10% and very prominent overestima-tion below the peak by∼30%
Overestimation of profile above the peak by∼5% and underestimation at the peak and below by∼20%
Large underestimation of profile above the peak by 30–40%
338–357 4 Overest. above the peak and at the peak (by∼10% at the peak and even more above the peak), underest. below the peak (profile shifted up-wards)
Good agreement above the peak, underestimation (∼5%) at peak, overesti-mation (up to 10%) below the peak
Good agreement in range of ∼5% at the peak (some small unfitted absorption structures of ozone present that poten-tially may affect the retrieval)
Good agreement in range of ∼5% at the peak (rel-atively strong unfitted ab-sorption structures of ozone present that potentially may affect the retrieval)
338–351.1 3 Shape of profile similar as above (profile shift upwards). Even more overest. above the peak and at the peak (∼20%) and overest. below the peak
similar as above similar as above Overestimation of profile at the peak∼10%
338–346.6 2 Distortion of the profile even more pronounced as for the two examples above, overes-timation by more than∼30%
similar as above, although the discrepancy at the peak is a few percent larger
Disagreement for most of the parts of profile by∼5%
Overestimation of profile at the peak of∼15%.
341.3–357 3 Underestimation by 30% at the peak and above the peak and increase by 30% at 12 km (Profile shift downwards)
Good agreement except un-derestimation at the peak by∼5%
Good agreement except un-derestimation at the peak by∼5%
Underestimation at the peak and above by ∼10%, over-estimation below the peak by ∼5%
341.3– 351.1
2 Shape similar as above, al-though systematical error is ∼10% smaller
Good agreement Good agreement Underest. at the peak and above by∼15%, overest. be-low the peak by∼5–10%
347.8–357 2 Good agreement Good agreement Good agreement Good agreement
atmosphere (e.g., clouds, aerosols, temperature and pres-sure).
For the studied fit windows we also retrieved the BrO pro-file by the AMF modified DOAS. The agreement with the Taylor series approach is within 5% for altitudes between 15 and 25 km, except for the fit window of 332.02–339.94 nm where only the first two BrO absorption peaks are consid-ered in the fit. In this case the Taylor series approach gives ∼10% lower values for altitudes above the peak compared with AMF modified DOAS and the true profile.
4.2 Application of the method for different atmospheric conditions
0 1 2 3 4 10
15 20 25 30 35
Number density (x107molec./cm3)
Altitude (km)
true profile
standard DOAS, 460 DU standard DOAS, 200 DU Taylor s. approach, 460 DU Taylor s. approach, 200 DU
-40 -30 -20 -10 0 10 20 30 40 10
15 20 25 30 35
Relative difference (%)
Altitude (km)
Subarctic scenario
0 0.5 1 1.5
15 20 25 30 35
Number density (x107molec./cm3)
Altitude (km)
true profile st. DOAS, trop.O3 st. DOAS, 200 DU Taylor s. appr, trop.O3 Taylor s. appr.,200 DU
15 20 25 30 35
Altitude (km)
-40 -30 -20 -10 0 10 20 30 40 Relative difference (%)
Tropical scenario
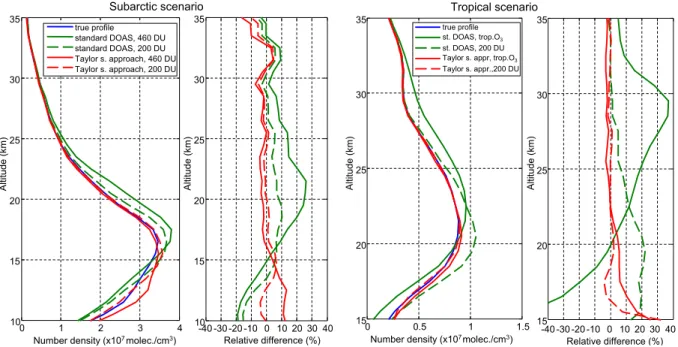
Fig. 8. Retrieved concentration profiles of BrO from simulated spectra by the standard DOAS and Taylor series approach (first and third panel from left) and the relative differences with the true profile (second and fourth panel). Left panels: Result for the subarctic atmospheric scenario where besides the simulation of spectra using the ozone profile with VCD=460 DU also a simulation for an ozone profile scaled to VCD=200 DU is performed. Right panels: Result for a tropical scenario with a tropical ozone profile with the maximum at 28 km and also for a subarctic profile (scaled to 200 DU) with the peak at 19 km.
The response of the approach to different ozone profiles is of particular interest. In case studies we found that other atmospheric parameters that impact the light distribution in the atmosphere (temperature, pressure, as well as viewing geometry) have a very small effect compared with the effect caused by ozone absorption.
In the following, we investigate: (1) the effect of differ-ent vertical optical depths of ozone on the retrieval of BrO by scaling the ozone profile, and (2) the effect of a differ-ent ozone profile with the concdiffer-entration peak at higher al-titudes. For the simulation of spectra we apply the ozone profiles shown in Fig. 2 and Table 1. In the first case, for the subarctic scenario, the ozone profile with VCD=460 DU is scaled to 200 DU. In the second case, for tropical scenario, besides applying the ozone profile characteristic for the trop-ics (VCD=270 DU, the profile peak at higher altitude, i.e. at 28 km), also the subarctic profile (with peak at 18 km, scaled to 200 DU) is applied.
The retrieved BrO profiles and their relative difference with respect to the true profile are given in Fig. 8.
When the ozone profile is scaled down from 460 DU to 200 DU, a better agreement for the retrieved profile of BrO with the true profile is obtained both for standard DOAS and for the Taylor series approach (see Fig. 8, left panel). For standard DOAS, at most altitudes the agreement is within 10% (Fig. 8, second panel from left). For the Taylor series approach, the agreement is within 2% between 16 and 30 km.
Like for standard DOAS, this improvement can be explained by the decreased contribution of the ozone optical depth to the total optical depth of absorption. Accordingly, the effects of uncorrected higher order Taylor series terms and the im-pact of minor absorbers on the absorption of ozone decrease relative to the total optical depth.
For the tropical scenario (Fig. 8, two panels on the right) even larger relative discrepancies (up to 40%) for the pro-files retrieved by standard DOAS (see the solid green line in the plot) can be seen than for the subarctic scenarios stud-ied before. The larger relative discrepancy can be explained by the lower BrO concentration. The absolute discrepancy, however, is similar to the scenario with the subarctic pro-file of ozone scaled to 200 DU. The largest discrepancy is observed at higher altitudes (above 25 km), compared with the subarctic scenario studied previously, because the ozone concentration peaks at higher altitudes (28 km) in the tropics (Fig. 2). This becomes clear from a study where the trop-ical ozone profile is replaced by the subarctic ozone profile scaled to 200 DU which peaks at lower altitudes (19 km). For the latter, the largest disagreement of 20% is found at lower altitudes (below 20 km), i.e., near the peak of the ozone pro-file (dashed green line in the far right plot of Fig. 8).
the tropics has a similar VCD (270 DU). In relative values, the discrepancy for the tropical profile is lower than 5% for altitudes above 20 km, but increases for altitudes below.
5 Application of the method to SCIAMACHY measurements
In the previous two sections, we showed the advantage of the Taylor series approach for the retrieval of BrO vertical pro-files from simulated spectra. In the following we study the possibility to apply the method for the retrieval of BrO ver-tical profiles from SCIAMACHY limb measurements. We perform the retrieval of SCDs by standard DOAS and by the Taylor series approach and compare the retrieved vertical concentration profiles with correlated balloon measurements provided by Dorf et al. (2006, 2008).
Note that in comparison to the simulation studies larger errors are expected for real measurements. These include ef-fects of the temperature dependency of the cross-sections, the spectral calibration, the Ring effect and instrumental prob-lems. For the comparison of measurements from different instruments, trajectory modelling and photochemical correc-tion for balloon measurements contribute to addicorrec-tional uncer-tainties. Also note that for the balloon retrieval, a different BrO cross-section (Wahner et al., 1988) for the DOAS fit was used and the retrieval was performed in another fit window. 5.1 Instrument description
The SCIAMACHY instrument on the ENVISAT satellite op-erates in a near polar sun synchronous orbit with an inclina-tion from the equatorial plane of∼98.5◦. It performs one orbit in approximately 100 min with equator crossing time of 10:00 in descending node. The satellite probes the atmo-sphere at the day side of Earth in alternating sequences of nadir and limb measurements. Limb scans in one scanning sequence are performed with approximately 3.3 km elevation steps at the TP in flight direction. The cross track swath is 960 km at the TP and consists of up to 4 pixels for the UV/VIS spectral range. The field of view (FOV) is 0.045◦in elevation and 1.8◦ in azimuth. This corresponds to approx-imately 2.5 km in vertical direction and 110 km in horizon-tal direction at TP, respectively. SCIAMACHY measures in the UV-VIS-NIR spectral range from 240 to 2380 nm with a spectral resolution of approximately 0.25 to 0.55 nm in the UV-VIS range. More instrumental details can be found in Bovensmann et al. (1999).
5.2 Retrieval of BrO
For the retrieval of BrO vertical profiles from the SCIA-MACHY limb measurements, an algorithm developed in our group is applied (K¨uhl, 2005; Puk¸¯ıte et al., 2006; K¨uhl et al., 2008). The retrieval of vertical BrO profiles is performed in
two steps in a similar way as for the simulated spectra studies above.
In the first step, the retrieval of SCDs, we apply the same retrieval settings as described in K¨uhl et al. (2008). The fit window ranges from 338.01–357.25 nm and two ozone cross-sections (at 223 and 243 K) by Bogumil et al. (2003) are included in the fit in order to account for the tempera-ture dependency of ozone cross-section. In the current study, the cross-section at 243 K is replaced with the one at 203 K for cases when temperature drops below 210 K in the lower stratosphere in order to apply the cross-sections best fitting to the actual temperature profile.
For the Taylor series approach we implement the descrip-tion of wavelength and absorpdescrip-tion dependency of the ozone SCD in the fit window in the same way as for the simulated spectra: compared to the standard DOAS approach the ozone cross-section term at 223 K is replaced by the three terms given in Eq. (14). The second cross-section term at 243 K (or 203 K) is left unchanged as the purpose of it is to account for the dependency of the ozone cross-section on temperature. We simulated spectra accounting for the temperature depen-dency of the ozone cross-section and found that the spectral features of ozone absorption due to temperature are well ac-counted for with this one additional term. Expansion of it in the Taylor series does not give additional improvement. Also orthogonalization of the ozone cross-section of 243 K (or 203 K) with respect to the cross-section of 223 K does not affect the retrieval.
For the second step of the retrieval, the inversion of the BrO SCDs to a number density profile of BrO, we apply the RTM McArtim (Deutschmann, 2009), like for the sim-ulations above. Box AMFs according to the geometry of each individual SCIAMACHY measurement are calculated at the single wavelength of 344.2 nm (as shown for exam-ple in Sect. 3.2.2, see dashed red line in Fig. 4). In case studies we found that for this wavelength the retrieved and the true SCDs agree within∼3% for different ozone profiles (see e.g. Fig. C1, second panel from top, in the Appendix C). Thus with this practical solution it is not necessary to cal-culate the box AMFs at all wavelengths which would be a very time consuming task for every SCIAMACHY measure-ment. The inversion is performed by the optimal estimation method (Rodgers, 2000). It is performed on the measurement grid with an a priori uncertainty of 100% and the off-diagonal elements of the covariance matrix equal to zero.
5.3 Comparison of SCIAMACHY BrO measurements
with collocated balloon measurements
balloon measurements in order to match the same location and atmospheric conditions (i.e., SZA) as for SCIAMACHY. A time mismatch between the satellite observation and the air mass trajectory starting at the balloon observation smaller than 1 h and a distance mismatch smaller than 500 km were allowed. If no SCIAMACHY observations fulfill these cri-teria, the distance criterion was extended to 1000 km. For the backward and forward trajectory modelling and for fur-ther information on the balloon measurements and the profile retrieval please refer to Dorf et al. (2006, 2008).
In Fig. 9, the BrO profiles retrieved by SCIAMACHY are compared with the correlated balloon observations per-formed for: Kiruna (67.9◦N, 21.1◦E), Aire sur l‘Adour (43.7◦N, 0.3◦E) and Teresina (5.1◦S, 42.9◦W) in March, October and June, respectively. The altitude range at which the modelled trajectories of air masses measured by balloon match with the TPs of the SCIAMACHY limb observations are indicated by gray shading in the figure.
It can be clearly observed that the profiles retrieved from the SCDs acquired by standard DOAS generally show larger values compared with the Taylor series approach (violet dashed line in Fig. 9, right hand side). The difference be-tween both retrievals is about 10 to 25%, in accordance with the findings for the studies on the simulated spectra (see Sect. 4.2).
Also, the dependence on the ozone VCD is very similar: The discrepancy is the largest for measurements at Kiruna, where it is up to 25% for altitudes between 20 and 25 km. For this comparison, very large ozone VCD (above 400 DU) were observed above Kiruna in March. Therefore the large discrepancy between the profiles obtained by standard DOAS and the Taylor series approach at the altitudes of the ozone peak may be attributed to the impact of the ozone absorption, which causes the overestimation of the BrO SCD by standard DOAS (compare Fig. 8).
In contrast, for the observation above Aire sur l’Adour in October, the difference between both SCIAMACHY re-trievals is smaller (between 10 and 15%) because of the much smaller ozone VCD (below 300 DU) compared with Kiruna. Thus, the impact of ozone absorption on the BrO retrieval is less at this site and standard DOAS shows a good agreement with the balloon observations here.
For the tropical scenario over Brazil the standard DOAS gives 10–40% larger values compared with the Taylor se-ries approach. The discrepancy is larger for altitudes above 25 km which is again in very good accord with the sensitivity studies for the tropical scenario (see Sect. 4.2).
In spite of the difficulties to be expected when comparing remote sensing observations of the minor absorbing species from different platforms, for most altitudes where the air masses measured by balloon and SCIAMACHY match, a good agreement within error bars is found for the Taylor se-ries approach. For wide altitude ranges, the discrepancy is within 25%, for certain altitudes also below 10% and always within 40% for both Kiruna cases (first and third panel from
the top) and 10% at Aire sur l‘Adour in France (second panel from the top). In contrast, the discrepancy of the standard DOAS retrieval to the balloon profiles is significantly higher (around∼50% for Kiruna).
For the tropical case (bottom panel), significantly lower values are observed by up to 35% compared with the bal-loon observation for altitudes below 25 km although show-ing good agreement above. Currently we cannot provide an explanation for this discrepancy, except that there are still large uncertainties regarding the observations of strato-spheric BrO. In particular, only very few measurements have been performed so far for the tropical lower stratosphere (Dorf et al., 2008). However for this case, also other SCIA-MACHY retrieval algorithms retrieve lower concentrations from the SCIAMACHY measurements (A. Rozanov, per-sonal communication, 2009). Note that for all compared BrO profile retrievals the agreement with the profiles obtained by the IUP Bremen full retrieval approach (Rozanov et al., 2005) is improved when applying the Taylor series approach compared to standard DOAS (compare with results presented in Sheode et al., 2006). The improved agreement is expected, because the full retrieval approach by itself correctly consid-ers the wavelength dependence of the SCDs. A comparison of BrO profiles retrieved from SCIAMACHY measurements by algorithms of different retrieval groups with each other and with balloon validation measurements will be presented in a publication by Rozanov et al. (2010).
6 Conclusions
For complex measurement geometries like in satellite limb measurements, light propagation in the atmosphere strongly varies with wavelength. The light can reach the instrument along very different light paths including those with strong absorption (e.g. due to ozone in the UV/VIS spectral range). In such cases DOAS is not directly applicable without ac-counting for the changes in the light propagation with wave-length because the assumption of a constant SCD within the DOAS fit window will lead to significant systematic errors.
For such cases, modifications of DOAS can be introduced that account for the variability of the SCD within the fit win-dow (e.g., extended or AMF modified DOAS). We intro-duced a new approach that describes the SCD as function of wavelength and of vertical optical depth by accounting for the broad band variation with wavelength due to changes in light propagation and absorption, and by considering the narrow band dependency of absorption varying with cross-section. The functional relationships are expressed in a Tay-lor series of which the first order terms are included in the DOAS fit, allowing to account for the wavelength depen-dency of the SCD. Thus, wavelength dependent SCDs are determined by DOAS.
A
lti
tu
d
e
(
k
m
)
-80 -60 -40 -20 0 20 40 60 80
15 20 25 30
A
lt
it
ude
(
k
m
)
-80 -60 -40 -20 0 20 40 60 80
15 20 25 30
A
lt
itu
d
e
(
k
m
)
-80 -60 -40 -20 0 20 40 60 80
15 20 25 30
Difference (%)
A
lt
itu
d
e
(
k
m
)
-80 -60 -40 -20 0 20 40 60 80
15 20 25 30
A
lt
itu
d
e
(
k
m
)
0 0.5 1 1.5 2 2.5 3 3.5 4 4.5 5
x 107 15
20 25 30
A
lt
it
u
de (
k
m
)
0 0.5 1 1.5 2 2.5 3 3.5 4 4.5 5
x 107 15
20 25 30
A
lt
itu
d
e
(
k
m
)
0 0.5 1 1.5 2 2.5 3 3.5 4 4.5 5
x 107 15
20 25 30
Number density (molec./cm-3)
A
lti
tu
d
e
(
k
m
)
0 0.5 1 1.5 2 2.5 3 3.5 4 4.5 5
x 107 15
20 25 30
Vertical BrO profile
Relative difference
23 March 2003, Kiruna (67.9°N, 21.1°E) Backward match: Orbit 5545, at 75°N, 16°E
9 Oct 2003, Air sur l`Adour (43.7°N, 0.3°E) Backward match: Orbit 8407, at 41°N, 8°E
24 March 2004, Kiruna (67.9°N, 21.1°E) Backward match: Orbit 10798, at 66°N, 9°E
27 June 2005, Teresina (5.1°S, 42.9°W) Forward match: Orbit 17255, at 5°S, 48°W
x 107 x 107 x 107 x 107
Number density (molec./cm-3) Difference (%)
balloon
Standard DOAS Taylor series approach
Standard DOAS w.r.t. balloon Taylor series approach w.r.t. balloon Standard DOAS w.r.t. Taylor series approach
(compared with the standard DOAS approach). At the same time, the advantages of a two step approach are retained: ra-diative transfer is separated from spectral analysis, saving calculation time for both steps. In particular, box AMFs can be calculated at one selected single wavelength.
Studies based on simulated spectra demonstrated the use-fulness of the method for different spectral regions in the range of 332–357 nm. In this region, relatively strong absorp-tion by ozone prevails and the light path distribuabsorp-tion in the atmosphere changes considerably with wavelength. Here, neglecting the dependency of ozone SCDs on wavelength leads to significant cross-effects for the retrieval of minor ab-sorbers like BrO: Depending on the fit window the discrep-ancy to the true profile can reach 20 to 100%.
Accounting for this variation by the Taylor series approach provides a more correct retrieval of minor absorbers and eliminates biases that arise due to the assumption of the constant ozone SCD in the fit window: Sensitivity studies show that the agreement between the retrieved and simulated BrO SCDs is very good for atmospheric scenarios with dif-ferent ozone profiles. Consequently, also for the retrieved and true BrO profile a very good accord is found for differ-ent fit windows and ozone profiles.
We applied the Taylor series approach to the retrieval of BrO profiles from SCIAMACHY measurements and com-pared the results with those from standard DOAS retrieval and correlated balloon measurements. While profiles ob-tained by standard DOAS show discrepancies of up to∼50% compared to the balloon validation measurements, the Taylor series approach leads to much better agreement, in particu-lar for cases with strong ozone absorption. This confirms the results of the sensitivity studies where an overestimation of the BrO SCD due to an incorrect ozone SCD description by standard DOAS was found.
Compared to AMF modified DOAS, the Taylor series ap-proach has the advantage of being independent from a priori information that may, in general, differ from reality. In ad-dition, it is not necessary to calculate AMFs for every wave-length in the fit window.
For the inversion of SCDs to vertical profiles, the new ap-proach makes the RTM calculations much easier because the interference of the narrow band spectral features caused by the wavelength dependency of the SCD of strong absorbers with minor absorber is minimized. Therefore, the selection of the wavelength at which the box AMFs for the inversion should be calculated depends much less on the strength of the absorption by ozone.
We demonstrated the improvement for the BrO profile re-trieval by the Taylor series expansion applied for SCDs of ozone for simulated and measured spectra. In simulation studies we also showed the possibility to extend this proach for a minor absorber (i.e., BrO). However, the ap-proach has the potential to improve DOAS retrievals also for other minor or strong absorbers when strong absorp-tion is present in the atmosphere, and is not limited to limb
geometry. In general, the approach allows to extend the ap-plicability of DOAS for observations where the light path varies strongly with wavelength (e.g., limb measurements or scenarios with large SZAs for nadir, ground based or other observations), or where medium or strong absorptions occur (e.g., ozone in the UV spectral range). Moreover, due to the improved description of the wavelength dependency of the SCDs, the Taylor series approach also allows to use broader fit windows which could improve the extraction of signals of very weak absorbers.
Appendix A
Approximation for the spectral variation of
simulated AMFs of ozone in the UV spectral range for limb geometry
In this appendix we investigate how well the approximation of ozone AMFs by the Taylor series approach agrees with its true function of wavelength. Because of the proportionality between AMF and SCD in Eq. (3), similar conclusions for the SCDs can be drawn.
For the study, we simulated AMFs for limb geometry in the UV spectral region (338–357 nm), see “main” parameters given in Table 1. The AMFs are obtained by the RTM McAr-tim (Deutschmann, 2009) from the simulated spectral inten-sity with and without the ozone absorption (according to the second bottom row in the third column in Table 3).
In analogy to Eq. (6), taking into account the proportion-ality between AMF and SCD, the first order approximation for AMFs is described by:
A(λ,υ)≈A∗0+Aλλ+Aυυ (A1)
In the simulated wavelength region, although minor ab-sorbers are present, absorption by ozone dominates. There-fore, for the determination of the vertical optical depthυwe first neglect the impact of minor absorbers by considering only the absorption of ozone (υO3=VO3σO3) in analogy to Eq. (9):