www.atmos-chem-phys.net/16/8295/2016/ doi:10.5194/acp-16-8295-2016
© Author(s) 2016. CC Attribution 3.0 License.
Spectral analysis of atmospheric composition: application to surface
ozone model–measurement comparisons
Dene R. Bowdalo, Mathew J. Evans, and Eric D. Sofen
Wolfson Atmospheric Chemistry Laboratories, Department of Chemistry, University of York, Heslington, York, YO10 5DD, UK
Correspondence to:Dene R. Bowdalo ([email protected])
Received: 26 February 2016 – Published in Atmos. Chem. Phys. Discuss.: 14 March 2016 Revised: 7 June 2016 – Accepted: 15 June 2016 – Published: 11 July 2016
Abstract. Models of atmospheric composition play an es-sential role in our scientific understanding of atmospheric processes and in providing policy strategies to deal with so-cietally relevant problems such as climate change, air qual-ity, and ecosystem degradation. The fidelity of these models needs to be assessed against observations to ensure that er-rors in model formulations are found and that model lim-itations are understood. A range of approaches are neces-sary for these comparisons. Here, we apply a spectral anal-ysis methodology for this comparison. We use the Lomb– Scargle periodogram, a method similar to a Fourier trans-form, but better suited to deal with the gapped data sets typical of observational data. We apply this methodology to long-term hourly ozone observations and the equivalent model (GEOS-Chem) output. We show that the spectrally transformed observational data show a distinct power spec-trum with regimes indicative of meteorological processes (weather, macroweather) and specific peaks observed at the daily and annual timescales together with corresponding har-monic peaks at one-half, one-third, etc., of these frequencies. Model output shows corresponding features. A comparison between the amplitude and phase of these peaks introduces a new comparison methodology between model and mea-surements. We focus on the amplitude and phase of diurnal and seasonal cycles and present observational/model com-parisons and discuss model performance. We find large bi-ases notably for the seasonal cycle in the mid-latitude North-ern Hemisphere where the amplitudes are generally overesti-mated by up to 16 ppbv, and phases are too late on the order of 1–5 months. This spectral methodology can be applied to a range of model–measurement applications and is highly suit-able for Multimodel Intercomparison Projects (MIPs).
1 Introduction
Ozone (O3) at the surface is a pollutant, harmful to both
hu-man and plant health (WHO, 2005; Fowler et al., 2009). It is the dominant source of the hydroxyl radical (OH) (Levy, 1972), which controls the concentration of key climate gases (CH4, HCFCs, etc.) and is an important climate gas in its
own right (Forster et al., 2007).
The main sources of O3in the troposphere are from
photo-chemical production and transport from the stratosphere. It is lost through dry deposition and photochemical loss (Monks et al., 2000; Stevenson et al., 2006; Monks et al., 2015). In the troposphere O3 photochemical production is driven by
the emission of precursors: nitrogen oxides (NOx), carbon
monoxide (CO), methane (CH4), and volatile organic
com-pounds (VOCs), which in the presence of appropriately en-ergetic photons can lead to a complex set of reactions, which ultimately produce O3in a non-linear fashion (Ehhalt, 1999;
Jenkin and Clemitshaw, 2000; Monks, 2005).
Our understanding of tropospheric ozone comes from observations of the spatial and temporal distribution of ozone and its precursors together with numerical simula-tions. Given the lifetime of tropospheric ozone (∼22 days)
(Stevenson et al., 2006), global models either online (chem-istry transport models – CTMs) or offline (Earth system mod-els – ESMs) are particularly useful and are used extensively. An assessment of model fidelity is essential to find errors in processes, to evaluate where model processes are inadequate, and to understand when models provide useful predictive ca-pabilities.
“long-term” surface ozone observations as a basis (Tanimoto et al., 2005; Jonson et al., 2006; Oltmans et al., 2006; Der-went et al., 2008; Cooper et al., 2012; Logan et al., 2012; Hess and Zbinden, 2013; Oltmans et al., 2013; Parrish et al., 2013, 2014). Typically, these observations are averaged onto a monthly timescale and compared to a similarly averaged model output, and the two compared as a function of time. This offers some advantages. The averaged measurement and modelled data sets are small, making comparisons compact and easy to understand. It also removes the short-term vari-ability (<monthly) that may not be of interest to the re-searchers.
However, this approach also suffers from a range of limitations. Processes occurring on timescales shorter than monthly include photochemistry, deposition, transport, and emission, all of which are important to the success of the model. By focusing on the monthly variability alone other timescales are ignored, which may lead to an insufficiently robust analysis of model performance. What is required is a methodology to assess model fidelity on a range of timescales simultaneously. Spectral methods offer this ap-proach but atmospheric chemistry has only been used in a small number of studies, and specifically for ozone in a limited sense, fitting stand-alone sine waves to time series (Schnell et al., 2015) and applied to a small selection of coarse monthly average data (Parrish et al., 2016).
In this paper we introduce a methodology for the spec-tral analysis of observations of atmospheric composition data (Sect. 2). We describe this methodology for two contrasting sites (Sect. 3). We then show this methodology applied to a range of surface ozone observations sites (Sect. 4), and ap-plied to a CTM (Sect. 5). We then compare these results and finally discuss potential reasons for biases (Sect. 6).
2 Spectral methods
The decomposition of a time series into a set of orthogo-nal periodic functions was first suggested by Joseph Fourier. Classically, this decomposition yields a number of sinusoidal waves each with an associated amplitude and phase. This technique is used extensively in disciplines such as engineer-ing and geophysics. Usengineer-ing a computer to compute this de-composition, traditionally by correlation of basis functions with a time series, is termed the discrete Fourier transform (DFT). However, this method is computationally intense, which led to the development of the fast Fourier transform (FFT). One of the limitations of the FFT is that it cannot ac-curately handle data sets with irregular time intervals. Some kind of interpolation is needed to provide data on a regular time interval, which biases results (particularly at high fre-quencies) (Press et al., 1992; Schulz and Stattegger, 1997; Musial et al., 2011; Rehfeld et al., 2011). Atmospheric obser-vations inherently have irregular time intervals due to
instru-mental issues (power breaks, instrument failures, calibration times, etc.) so another numerical method is needed.
The Lomb–Scargle periodogram (LSP) is a spectral analy-sis method designed to handle gapped data sets (Lomb, 1976; Scargle, 1982; Horne and Baliunas, 1986; Press and Rybicki, 1989; Press et al., 1992), which has been applied in a small number of instances to air quality data (Dutton et al., 2010; Stefan et al., 2010). It can be formulated as a modified DFT (Scargle, 1982; Press et al., 1992), and also equivalently by the least squares of fit of sine and cosine waveforms to a time series centred around zero (Lomb, 1976). Using the mod-ified DFT methodology, for an equally spaced time series, taking the magnitude squared of the dot products of a time series (centred around zero) with cosine and sine waveforms at set frequencies gives a spectrum that is an estimate of the power contributing to the original data. In the presence of data gaps, the sine and cosine model functions are modified to be exactly orthogonal by an additional phase parameter2 (Scargle, 1982), making the estimation invariant to shifts in time of the input time series (i.e. data gaps). It is commonly represented in its normalised form (termed Power Spectral Density), e.g. (Press et al., 1992), as
P (ω)= (1)
1 2σ2
N P i=1
y(ti)cos(ωti−2)
2
N P
i=1
cos2(ωt
i−2)
+ N
P i=1
y(ti)sin(ωti−2)
2
N P
i=1
sin2(ωt
i−2)
,
wherey(ti)is the observable at timeti,ωis the angular
fre-quency, andσ2is the variance of the time series. The phase offset2is calculated with the four quadrant inverse tangent, shown by Eq. (2). Additionally, the DFT is modified so when data gaps exist the distribution of the normalised spectrum for pure Gaussian noise is exponential, equivalent to that of the equal spaced case.
2=1
2arctan
N
X
i=1
sin(2ωti) , N
X
i=1
cos(2ωti)
!
(2) The LSP does not output any phase information natively. However, Hocke (1998) gave a method to modify the LSP algorithm to output real and imaginary components or am-plitude and phase, as a result of the Fourier transform, which we apply in our work.
Spectral leakage
of the time series, then its power would lie between two of the frequencies, resulting in leakage of that power through-out the rest of the spectrum. Atmospheric time series are not typically integer-year long. For example, if the time series was 10.5 years long the spectrum would consist of the pe-riods: 10.5, 5.25, 3.5, 2.1, . . . , 1.16, 1.05, 0.955 years, etc. Therefore, if large variability were contained on exactly a 1-year cycle, the LSP would spread that power throughout the spectrum.
Spectral leakage results from an assumption in spectral analysis methods that the time record is infinitely long. The transform assumes that the finite data set is one period of an infinite periodic signal. Therefore, when the periodicity of in-terest is non-harmonic with the total span of the time record, there is a discontinuity, which results in leakage in the spec-tral domain (Horne and Baliunas, 1986).
To ensure the power leakage from multiple periodic com-ponents does not contaminate the entire spectrum, the input time series can be multiplied by a window function (Har-ris, 1978). The window is shaped so that it is zero at the be-ginning and end, and has some defined shape in between. The window effectively changes the shape of the leakage in the frequency domain, limiting its impact to only a few frequencies around the peak frequency, providing a trade-off between peak resolution (the width of the peak) and spectral leakage (the amplitude of the tails of the leakage), with dif-ferent windows altering the peaks of the spectrum in difdif-ferent ways. In this study a Hanning window was chosen as it of-fers an acceptable trade-off between resolution and spectral leakage (Harris, 1978).
Although the shape of the leakage can be altered, the peak amplitude will still be underestimated as there are no fre-quencies that estimate exactly at the exact frequency of in-terest. However, the LSP methodology (unlike the FFT) can estimate at any frequency, allowing the exact capturing of the top of the peak. Thus, if significant cycles are known a pri-ori (annual, daily, etc.) their sinusoids can be calculated very accurately.
3 Lomb–Scargle periodogram of surface ozone
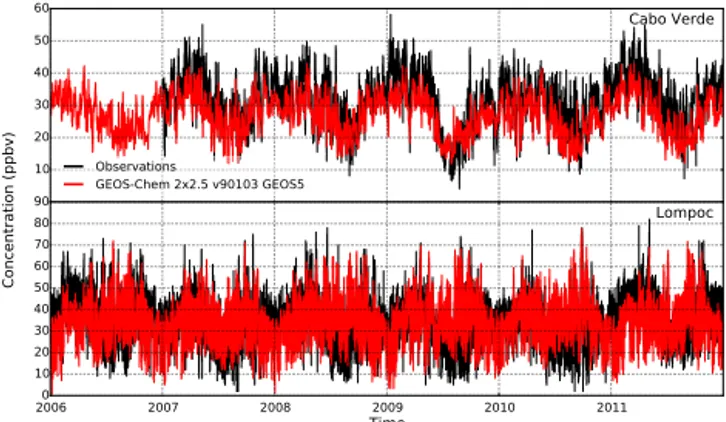
Figure 1 shows the time series of hourly surface ozone mix-ing ratios collected at Cabo Verde (Carpenter et al., 2010) and Lompoc together with equivalent model output (see Sect. 5). Cabo Verde (16.51◦N, 24.52◦W) is a small remote island
country consisting of 10 islands situated in the tropical east-ern North Atlantic Ocean, 570 km off the West African coast. It represents one of the only ozone measurement stations in the tropics, and is relatively undeveloped, also making it one of the small number of baseline oceanic measurement sites. It is maintained by the atmospheric chemistry group at the University of York, and thus presents a readily avail-able data set for analysis. Lompoc (34.73◦N, 120.43◦W), is
a USA environmental protection agency air quality system
10 20 30 40 50
60 Cabo Verde
Observations
GEOS-Chem 2x2.5 v90103 GEOS5
20060 2007 2008 Time2009 2010 2011 10
20 30 40 50 60 70 80
90 Lompoc
Concentration (ppbv)
Figure 1. Time series of surface O3 at Cabo Verde (16.51◦N,
24.52◦W) and Lompoc (34.73◦N, 120.43◦W) for the observations
(black) and the GEOS-Chem model (red), between 2006 and 2012.
(EPA AQS) rural continental site located on the US Califor-nian west coast. Using the Lomb–Scargle methodology, the time series at Cabo Verde and Lompoc can be transformed into a number of sinusoidal waves at a range of periods with differing amplitudes and phases. In Fig. 2 we show the am-plitude (ppbv) of these waves as a function of their period (days).
The spectra for both sites shown in Fig. 2 have a range of characteristic features. There are broadly linear regions from 2 h to 10 days and from 10 days to the last period of 1826 days. There are also sets of peaks, which occur at char-acteristic timescales (i.e. 1 day and 1 year). We will initially discuss the identification of these linear regimes and then dis-cuss the identification of the peaks.
3.1 Meteorological regimes
Figure 2 shows two distinct linear regimes for both sites’ spectra in the value of the amplitude of the waves making up the LSP, which meet at around 10 days. Very similar spectra are seen in physical parameters in the atmosphere (Lovejoy and Schertzer, 2013a, b). There are three main scaling regimes of meteorological variability (Lovejoy and Schertzer, 2013a, b): “weather”, “macroweather”, and “cli-mate”, with each regime being the outcome of different dy-namical processes.
Weather processes range from microscale local turbulence to planetary-scale weather systems, with the temporal life-times of these features roughly proportional to their spa-tial scale (Lovejoy and Schertzer, 2013b). The variability induced on O3 also scales accordingly to these; thus, the
weather regime for O3 is represented by a steep spectral
gradient (on the log–log spectrum – Fig. 2) from 2 h to
∼10 days, after which there is a sharp transition to a
of being the average of the largest planetary-scale weather systems, being no more than low-frequency weather, with no new dynamical elements or forcing mechanism, the statis-tics of this regime being well captured by unforced “control” runs of general circulation models (Lovejoy and Schertzer, 2013a). The regime has been shown for metrological spectra to extend out to 10–100 years, and is termed “macroweather” (Lovejoy and Schertzer, 2013b). The final regime is char-acterised by a steep increase from the flat macroweather gradient between 10 and 100 years caused by new (inter-nal) low-frequency non-linear interactions or (exter(inter-nal) so-lar, volcanic, or anthropogenic forcings, and represents long-term changes of the macroweather. Human induced changes would be termed “climate change”. As our work only uses time series of 5 years in we do not see evidence of any climate regime for our spectra. We thus we end up with two regimes to describe the impact of meteorology on sur-face O3variability: weather (2 h–10 days) and macroweather
(>10 days).
These regimes can be described by fitting a model of two joint piecewise linear functions in log–log space to the spectrum (minimising the residuals). We set the transition point at 10 days, as the theoretical maximum lifetime for the largest planetary-scale weather systems (Lovejoy and Schertzer, 2013b). We only use periods less than 100 days, for the few points beyond this value are noisy and can often introduce significant variability into this fitting. The upper panels of Fig. 2 show the linear fits (green line) to the ob-served surface O3spectra for both Cabo Verde and Lompoc.
To find periods that deviate from these fits, we scale the fit-ted models by percentiles of the chi-squared probability dis-tribution to obtain false-alarm levels (Schulz and Mudelsee, 2002). Peaks exceeding these false-alarm levels indicate non-model components in the time series, and should be consid-ered significant (Schulz and Mudelsee, 2002). Here, we take frequencies that have an amplitude above the 99th percent confidence level to be significant. Our attention now focuses on these significant frequencies, namely the annual and daily peaks (and their harmonics).
3.2 Annual and daily cycles
From Fig. 2 it is evident that there are significant peaks on an-nual and daily timescales for both Cabo Verde and Lompoc. There are also additional significant harmonic peaks (12daily for Cabo Verde; 12, 13, 14, 15, 16, 71, 18, 19,101,111, 121 daily and
1
2 annual for Lompoc). These periodic cycles are driven by
the planetary processes of the Earth’s rotation around its own axis and its rotation around the sun both of which changes the predominant driving force for the atmosphere, solar ra-diation. Variability in solar radiation is not sinusoidal in na-ture, and the atmosphere is not linear in its response. Thus, any harmonics are a product of the non-sinusoidal shape of the daily and annual cycles of ozone (Valenzuela and Pontt, 2009). Parrish et al. (2016) finds that the annual and
half-annual cycles are enough to characterise the seasonal vari-ability of marine boundary layer O3, and that the forcing
re-sponsible for the half-annual cycle a priori is attributable to the 2nd harmonic of the photolysis rate of O3. It is important
to note however, that the harmonics do not have to have inde-pendent physical forcings. The power of the harmonics can simply be a function of the mathematics.
For the surface ozone observational data set described in Sect. 4 (Sofen et al., 2016), we find almost all sites show significant peaks at the fundamentals (and most harmonics) of the annual and daily timescales. It is notable that we do not find any sites that show significance of a 7-day cy-cle (Altshuler et al., 1995; Marr and Harley, 2002; Beirle et al., 2003). Application of this approach to longer time se-ries may also allow the investigation of other characteristic timescales such as North Atlantic Oscillation (NAO) or El Niño–Southern Oscillation (ENSO) (Ziemke et al., 2015). 3.2.1 Definition of “seasonal” and “diurnal” cycles
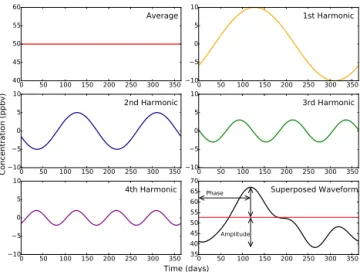
For all of the sites investigated the amplitude of the daily cy-cle is always significantly larger than any of its harmonics. However, this is not true for the annual cycle, as the mag-nitude of the half-annual cycle can sometimes compete with that of the annual cycle. To bring together the fundamental and the harmonics we superpose the fundamental and the harmonic signals to create “seasonal” and “diurnal” cycles. We show an example of this in Fig. 3, where the average, 1st (fundamental), 2nd, 3rd and 4th harmonics are superposed to create the net waveform. We choose to superpose down to the 12th harmonic for the diurnal cycle, and 4th harmonic for the seasonal cycle as they are the highest harmonics for each pe-riodicity that we find significance (>99th percent confidence level). We characterise the superposed cycles with their am-plitude being half the peak to trough height and their phase being the timing of the maxima. We modify the LSP code to ensure we estimate precisely at 1 day (and 2nd to 12th har-monics) and 365.25 days (and 2nd, 3rd and 4th harhar-monics) to ensure accurate estimation of these cycles. From this point onwards all references to the “seasonal” or “diurnal” cycle refer to the superposition of the respective fundamental and harmonics, and any “annual” and “daily” references refer to solely the fundamental terms.
3.2.2 Fraction of total variance associated with a periodicity
repre-0.0001 0.001 0.01 0.1 1
10 Cabo Verde
0.01 0.1 1 10 100 1000 10000
0.0001 0.001 0.01 0.1 1 10
Lompoc
Observations Model Fit
95 % Chi Significance2
99 % Chi Significance2
0.1 1 10 100 1000 10000
Observations
GEOS-Chem 2x2.5 v90103 GEOS5
Period (days)
Amplitude (ppbv)
Figure 2.Lomb–Scargle periodogram spectra for surface O3at Cabo Verde (16.51◦N, 24.52◦W) and Lompoc (34.73◦N, 120.43◦W), between 2006 and 2012. The upper panels shows the observed data spectra together with chi-squared false-alarm levels for significant periodicity based on linear piecewise fits to the spectra. The lower panels compare the spectra of the observations (black) and the GEOS-Chem model (red).
0 50 100 150 200 250 300 350 40
45 50 55 60
Average
0 50 100 150 200 250 300 350 10
5 0 5 10
1st Harmonic
0 50 100 150 200 250 300 350 10
5 0 5 10
2nd Harmonic
0 50 100 150 200 250 300 350 10
5 0 5 10
3rd Harmonic
0 50 100 150 200 250 300 350 10
5 0 5 10
4th Harmonic
0 50 100 150 200 250 300 350 35
40 45 50 55 60 65 70
Amplitude
Phase Superposed Waveform
Time (days)
Concentration (ppbv)
Figure 3.Example of spectral superposition of the average, funda-mental frequency and the harmonics for a frequency of interest.
sentative of the total periodic σ2. In the same way as it was previously done, we take the fraction of the total pe-riodic σ2 to the time series σ2. Removing the total peri-odic waveform (including gaps) from the raw time series gives a time series that is solely derived of the weather and macroweather “noise”. The variances of these peri-odic and noise time series are essentially additive so that σ2(diurnal)+σ2(seasonal)+σ2(noise)=σ2(time series).
4 Application to observations
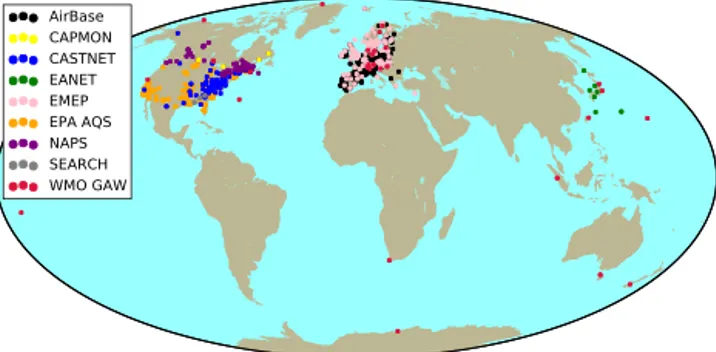
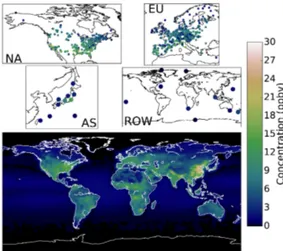
We apply these methods to an updated hourly version of the long-term surface ozone data set from Sofen et al. (2016), compiled for the task of model evaluation. The data set ap-plies multiple stringent data quality checks: removing urban sites, duplicate sites, coarse and partial year data, and obvi-ous outliers. The data are originally drawn from the AirBase, CAPMON, CASTNET, EANET, EMEP, EPA AQS, NAPS, SEARCH, and WMO GAW monitoring networks (see Sofen et al. (2016) and references therein for details), and for sim-plicity we choose the period between 2005 and 2010 as this represents the most comprehensively observed time period. We exclude sites with data gaps of more than 365 days in this period and additionally sites with data gaps greater than 60 days in 3 or more years. We additionally limit the sites to be below 1.5 km from sea level. Figure 4 shows the loca-tion of the 710 valid sites. Most of the sites are from the US EPA AQS and EU AirBase data sets, which leads to an over representation of northern continental mid-latitude locations and an under representation of other areas of world.
We now investigate these observations in the context of the Lomb–Scargle-derived diurnal and seasonal cycles.
4.1 Significance of seasonal and diurnal cycle
AirBase CAPMON CASTNET EANET EMEP EPA AQS NAPS SEARCH WMO GAW
Figure 4.Map of surface sites reporting surface O3between 2005 and 2010 used in this study, coloured by the providing data network.
NA
EU
AS
ROW
NA
EU
AS
ROW
NA
EU
AS
ROW
0 20 40 60 80 100
% of total variance Diurnal Seasonal
All Periodic
Figure 5.Observational fractional variance of time series by site from diurnal, seasonal and total periodicity. NA is North America, EU is Europe, AS is Asia, and ROW is rest of world.
represents a much larger fractional variance than the diurnal cycle.
The greatest contribution to total variance from the sea-sonal cycle is for the Antarctic site (85 %) and the oceanic and continental Southern Hemisphere (SH) sites (30–60 %). This reflects the lack of anthropogenic influence and spatial homogeneity of these regions leading to small spatial gradi-ents in O3. Without spatial gradients to advect, weather
sys-tems cannot induce much variability, thus diurnal and sea-sonal variability dominates. For high NOx regions in the
north-eastern USA, southern and central Europe, and Japan (Fig. 13c), the seasonal cycle contributes 30–50 % of the to-tal variance. In southern central USA contribution from the seasonal cycle to the total variability is very small (2–10 %). For the oceanic, polar, and sites in low NOx areas in the
extra-tropics (i.e. Cape Point (34.21◦S, 18.29◦E) – the most
south-westerly point of Africa) the diurnal cycle is negligi-ble. These diurnal cycles are typically small as ozone pro-duction and loss in these low NOx environments is small.
However, it is a major contributor (20–40 %) to the total vari-ability for some low latitude regions in North America and Europe, where high NOxconcentrations and photolysis rates
lead to significant diurnal cycles.
Superposition of the diurnal and seasonal cycles gives a measure of the fraction of total variance induced from peri-odicity. For most sites the percentage contribution is between 40 and 60 %. The highest value being for the Antarctic site (85 %). The site with the lowest % contribution from peri-odicity is in Indonesia (15 %), almost on the Equator, where there is very little variability in the solar radiation.
From this analysis it is evident that forcing of the atmo-sphere from seasonal and diurnal processes (changes in solar irradiation, chemistry, emissions, etc.) are for responsible for the most part for around 50 % of the variability seen in these sites. The remaining 50 % of the variability is attributable to changes on the weather or macroweather timescales due to processes such as boundary layer mixing, synoptic systems, changing emissions, etc. We now describe in more detail the seasonal and diurnal cycles seen at different locations. 4.2 Seasonal cycle
The seasonal cycle of ozone has been subject to much dis-cussion (Derwent and Davies, 1994; Logan, 1985; Monks et al., 2000; Monks, 2000; Tanimoto et al., 2005; Cooper et al., 2010, 2014; Carpenter et al., 2010; Parrish et al., 2013; Clifton et al., 2014; Parrish et al., 2016). In general, NH mid-latitude continental sites in the late 2000s show a springtime maxima, which has shifted from a broad summertime peak in the 1990s (Cooper et al., 2014). This change is strongly as-sociated with NOxemission reductions in Europe and North
America due to air quality legislation (Parrish et al., 2013; Clifton et al., 2014); however, some of the most polluted ur-ban sites still show a summertime peak (Cooper et al., 2014). Extra-tropical baseline sites show a consistent winter–spring maxima and tropical baseline sites a small winter maxima.
Our findings are consistent with the literature. The upper panels of Fig. 6 show the amplitude of the seasonal wave-form for the observations. In general, most amplitudes are in the range of 5–15 ppbv. Sites influenced by highly polluted outflow such as the Central Valley in the USA and the Po Valley in Italy show large amplitudes (up to 22 ppbv). High amplitudes can also be seen in the Asian sites downwind of China, particularly to the south of Japan (up to 23 ppbv).
The maxima in the observed seasonal waveforms (upper panels of Fig. 7) occurs in the spring (April, May) for most of the continental sites with a tendency for later peaks in southern Europe. The small number of continental sites in the Southern Hemisphere (SH) show peaks 3–6 months out of phase compared to the Northern Hemisphere (NH), peak-ing in the SH late winter to sprpeak-ing (August–October). The SH oceanic site, American Samoa (14.27◦S, 170.13◦W), has a
0 3 6 9 12 15 18 21 24 27 30
Concentration (ppbv)
NA
AS
EU
ROW
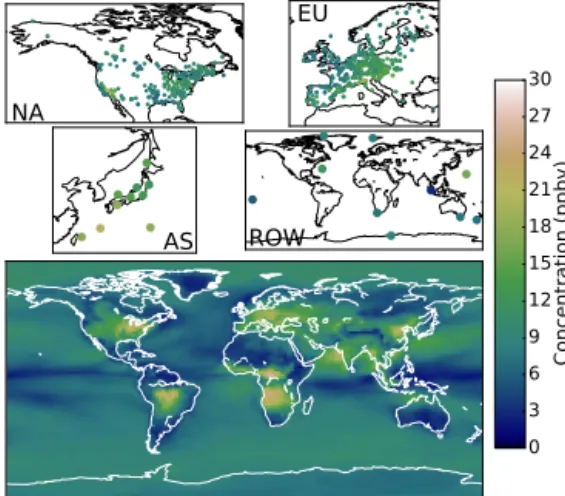
Figure 6.Seasonal amplitudes of observations (upper panels) and model (lower panel). NA is North America, EU is Europe, AS is Asia, and ROW is rest of world.
4.3 Diurnal cycle
The upper panels of Fig. 8 show the observational amplitudes of the diurnal cycle. In most of the locations this is in the range of 0–15 ppbv, with a tendency for larger amplitudes to-wards the tropics where solar radiation is more intense. There are also higher amplitudes in regions with higher NOx
emis-sions (Fig. 13c), with again the Central and Po valleys being evident.
Significant differences between sites can be seen in the phases of the diurnal cycle (upper panels of Fig. 9). Baseline sites (i.e. American Samoa) show a phase that peaks close to dawn, reflecting photochemical O3destruction during the
day and O3build-up at night. Continental sites (i.e. Lompoc)
show maxima in the early afternoon due to photochemical ozone production during the day.
The amplitude and phase of the diurnal and seasonal wave-forms give a compact method of summarising much of the variability seen in surface ozone sites. We now explore how a CTM simulates these observations.
5 Model perspective
GEOS-Chem is a global three-dimensional (3-D) CTM driven by assimilated meteorological observations from the Goddard Earth Observing System (GEOS) of the NASA Global Modelling Assimilation Office (GMAO). The basic model is described in (Bey et al., 2001). We run version v9.01.03, using GEOS5 analysed meteorology at 2◦×2.5◦
resolution run for 5 years between 2005 and 2010, out-putting surface hourly O3 in each grid box. Global
anthro-pogenic emissions of CO, NOx, and SO2are from the global
EDGAR v3.2 inventory (Olivier et al., 2005). Global anthro-pogenic emissions of non-methane VOCs (NMVOCs) are from the RETRO monthly global inventory for the year 2000,
Figure 7.Seasonal phases of observations (upper panels) and model (lower panel). NA is North America, EU is Europe, AS is Asia, and ROW is rest of world.
as described by Hu et al. (2015), except for ethane (Xiao et al., 2008) and global biofuel emissions (Yevich and Logan, 2003). Inventories are scaled for individual years on the basis of economic data. Regional inventories are used in certain re-gions where there is improved information, as described by van Donkelaar et al. (2008). There are also inputs of NOx
from additional sources, i.e. aircraft (Wang et al., 1998), ships (Vinken et al., 2011), and biomass burning (Giglio et al., 2010). Inputs from lightning and soil NOx are
calcu-lated online (Yienger and Levy, 1995; Murray et al., 2012). Biogenic VOC emissions are from the global MEGAN v2.1 inventory (also calculated online) (Guenther et al., 2006). Stratosphere–troposphere exchange is handled as a param-eterised climatological representation of species sources and sinks (McLinden et al., 2000; Murray et al., 2012). Bound-ary layer mixing is parameterised using a non-local scheme, which considers different states of mixing within the bound-ary layer as determined by the static instability (Holtslag and Boville, 1993; Lin and McElroy, 2010).
5.1 Modelled power spectrum
The power spectra for the modelled surface O3at Cabo Verde
and Lompoc are shown in the lower panels of Fig. 2. As for the observed spectra the weather and macroweather regimes are visibly separated at around 10 days. The model underes-timates the amplitude on the shortest timescales for both sites (<3 days). This is unsurprising given the model spatial scale (2◦×2.5◦, approx. 250 km) and the timescale for model
mete-Figure 8. Diurnal amplitudes of observations (upper panels) and model (lower panel). NA is North America, EU is Europe, AS is Asia, and ROW is rest of world.
orological variability will be missing. In general this will be true for all models. Therefore, on some timescales the model cannot be expected to interpret the observed variability, and this limitation should be considered when preparing model experiments.
As with the observations there are peaks at 365.25 days and 1 day with appropriate harmonics. As per the obser-vations, we superpose the daily and annual fundamentals with their harmonics to produce seasonal and diurnal signals, which we describe with a phase and amplitude. We now in-vestigate the amplitude and phase of the modelled diurnal and seasonal cycles.
5.2 Seasonal cycle
The lowest panel of Fig. 6 shows the modelled amplitude for the seasonal cycle in surface ozone. As with the obser-vations, the model shows large amplitudes over regions with significant anthropogenic NOxemissions (Fig. 13c) such as
North America, Europe, and Asia (up to 26 ppbv). Regions with significant seasonal cycles in the NOxemissions, such
as from biomass burning in the Amazon and Central Africa also have large cycles (up to 27 ppbv). These large ampli-tudes can be seen to extend away from the source regions into the Pacific and Indian oceans. Over the remote tropi-cal oceans the seasonal cycle is very small (1 ppbv). Due to a scarcity of observations, many of these features are unob-served.
Figure 7 shows the global seasonal phase of modelled sur-face O3 (lower panel). There are distinct bands of phases.
Over polluted NH continental regions a July–September maximum is calculated, with the cleaner northern extra-tropics showing a April–May maximum and the clean trop-ics a December–February maximum. In the SH there is a September–December maximum for continental regions, and a July–September maximum over the oceans and Antarctica.
0 2 4 6 8 10 12 14 16 18 20 22
Hour
NA
AS
EU
ROW
Figure 9.Diurnal phases of observations (upper panels) and model (lower panel). NA is North America, EU is Europe, AS is Asia, and ROW is rest of world.
5.3 Diurnal cycle
The largest diurnal amplitudes (lower panel of Fig. 8) are found in eastern China (up to 28 ppbv) where the emissions of NOx are the greatest. This leads to large diurnal
photo-chemical production of O3but also large titration by NO at
night. High diurnal amplitudes are also found over the pol-luted north-eastern USA (13–17 ppbv), central Europe (10– 13 ppbv), and India (11–15 ppbv). Again, regions with sig-nificant seasonal cycles in the NOxemissions from biomass
burning also have large amplitudes, i.e. Amazon, Indonesia, and Central Africa.
Figure 9 shows the global diurnal phases of modelled sur-face O3(lower panel). As with the observations the two
dis-tinct clean and polluted regimes emerge. The polluted areas almost all have diurnal cycle peaking at 14:00 or 15:00 local solar time. This band includes all continental regions (except Greenland and polar regions). It also includes a band across the northern Pacific and northern Atlantic oceans. The clean areas almost all have a phase at 08:00, the exception being a circumpolar band of phases, which peak at 04:00 around Antarctica. The diurnal phase at the poles looks incoherent, which is predominantly due to the very small amplitudes in these regions; thus, the phase becomes practically irrelevant.
6 Model – measurement comparisons
1 2 3 4 5 6 7 8 9 10 11 12 510 1520 2530
Amplitude
(ppbv)
Phase
(month)
Seasonal
Observations
1 2 3 4 5 6 7 8 9 10 11 12 510 1520 2530GEOS-Chem
0 +1 +2 +3 +4 +5 +-6 -5 -4 -3 -2 -1 -15 -10 -5 0 +5 +10 +15 +20Difference
0 1 2 3 4 5 6 7 8 9 10 11 12 13 14 15 16 17 1819 2021 22 23 510 1520 25
Amplitude
(ppbv)
Phase
(h)
Diurnal
0 1 2 34 5 6 7 8 9 10 11 12 13 14 15 16 17 1819 20
21 22 23
510
1520
25 0 +1 +2
+3 +4 +5 +6 +7 +8 +9 +10 +11 ±12 -11 -10 -9 -8 -7 -6-5 -4-3 -2 -1 -15 -10 -5 0 +5 +10 +15 +20
Africa
Antarctica
Arctic
Asia
Europe
North America
Oceania
Oceanic
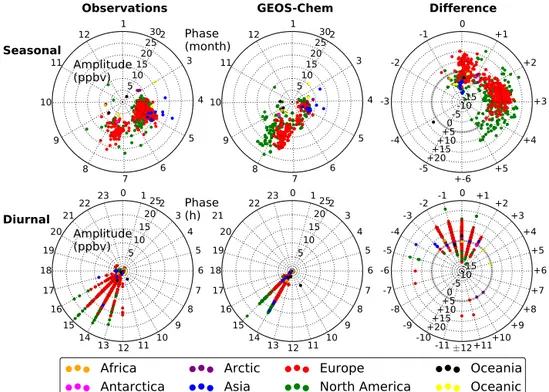
Figure 10.Polar plot of the diurnal and seasonal amplitudes and phases for observations and the GEOS-Chem model, and the differences between them. Circle colour indicates the location of the site.
6.1 Seasonal cycle
Figure 10 shows the polar representation of the seasonal cy-cle for the observations, model, and the difference between the two. North American and European site seasonal am-plitudes are on average overestimated (up to 16 ppbv). The seasonal phase also shows biases with most sites’ phases in North America and Europe peaking 1–5 months later than the observations, in mid-late summer rather than mid-late spring. Seasonal amplitudes for the African, Antarctic, Arc-tic, Asian, Oceania, and oceanic sites are all underestimated (up to 10 ppbv) but their phases show generally good agree-ment with the observations.
Figure 11 shows the spatial distribution of the difference for the seasonal amplitudes and phases. The biggest model overestimations for the amplitudes (upper panels) are in re-gions with high very O3precursors, i.e. north-eastern USA
(up to 16 ppbv) and mainland central Europe (to 11 ppbv); both generally at sites inland, away from oceanic influence. In contrast, it is the coastal and oceanic sites where the model underestimations are greatest, with the largest coming in Asia (5–10 ppbv) and eastern Canada (up to 8 ppbv).
The lower panels of Fig. 11 show that in mainland Europe the seasonal phases are generally 1–3 months too late in the model and 2–4 months too late in the north-eastern/south-eastern USA. The biggest phase differences come in the cen-tral southern USA with the model phases approximately 4– 5 months too late (a region where the seasonal cycle con-tributes very little to the total variance, Fig. 5).
6.2 Diurnal cycle
Figure 10 also shows the polar representation of the diur-nal cycle observations, model, and difference. The model has some skill in determining the diurnal amplitudes. There is on average an overestimation of North American, European, and Asian diurnal amplitudes (up to 17 ppbv). Amplitudes for the clean oceanic sites are well estimated, with the rest of the sites in Oceania, Africa, Antarctic, and Arctic displaying rea-sonable agreement. The model has generally good skill for simulating the diurnal phases (ignoring the polar sites); how-ever, notable biases show that in the oceanic and Asian sites with the model up to 5 h late, and up 4 h early respectively for the groupings. Additionally for the North American and European groupings, the model simulates the vast majority of phases in a narrow band, where there is a broader group-ing of phases in the observations. This may represent issues with the timing of processes such as boundary layer mixing, which is suggested to be excessive (Travis et al., 2016).
Spatially, Fig. 12 upper panels, the biggest overestimations in the amplitudes are again in regions with high emissions of O3 precursors: Central Valley USA (up to 17 ppbv),
north-eastern USA (up to 14 ppbv), Japan (up to 11 ppbv), and mainland central Europe (up to 11 ppbv). The biggest under-estimations come in coastal regions, i.e. US west coast (up to 11 ppbv) and southern Europe (up to 10 ppbv).
The lower panels of Fig. 12 show the model in the high NOx emitting regions of north-eastern USA and central
NA
EU
AS
ROW
NA
EU
AS
ROW
-18 -12 -6 0 +6 +12 +18 Concentration (ppbv) +-6 -4 -2 0 +2 +4 +-6 Months Amplitude diff. Phase Diff.Figure 11. Seasonal amplitude (upper panel) and phase (lower panel) differences between observations and the GEOS-Chem model. NA is North America, EU is Europe, AS is Asia, and ROW is rest of world.
phase offsets (excluding polar sites) are found in the oceanic sites of Bermuda and American Samoa (+3 and+5 h).
6.3 Possible causes of biases
A range of model biases are evident in this analysis. These may be explained by a range of model errors/uncertainties in the emissions, deposition, chemistry, photolysis rates, boundary layer mixing, stratospheric transport, tropospheric transport, resolution, etc.
The most discussed uncertainties lie in the emissions. Probably the most accurate emission estimates are for North America and Europe, but even here significant uncertain-ties exist. Anderson et al. (2014) found the anthropogenic US National Emissions Inventory (NEI) 2005 NOx
emis-sions (projected to 2011) in the mid-eastern USA to be 51– 70 % too high compared with measurements taken on the DISCOVER-AQ field campaign. The NEI 2011 emissions appear to overestimated by an even larger margin. Vestreng et al. (2009) found±8–25 % uncertainties in European NOx
emissions. Stein et al. (2014) also recently found wintertime systematic underestimates in NH CO by a global CTM, best offset by increases in winter CO road traffic emissions to-gether with an improved CO dry deposition scheme.
As anthropogenic NOx decreases, the relative importance
of lightning and soil NOxis much greater and the importance
of low NOx isoprene chemistry increases (Palmer, 2003;
Fiore et al., 2014). Millet et al. (2008) showed the MEGAN v2.1 biogenic emission inventory in the USA (Guenther et al., 2006) overestimates emissions of isoprene in areas where it specifies high emission factors.
Reduced winter/early spring photochemical removal by NO titration (Jonson et al., 2006); efficient transport of en-hanced springtime O3 from East Asia (Wild and Akimoto,
2001; Tanimoto, 2002; Tanimoto et al., 2005); as well as
ear-NA
EU
AS
ROW
NA
EU
AS
ROW
-18 -12 -6 0 +6 +12 +18 Concentration (ppbv) +-12 -9 -6 -3 0 +3 +6 +9 +-12 Hours Amplitude diff. Phase Diff.Figure 12.Diurnal amplitude (upper panel) and phase (lower panel) differences between observations and the GEOS-Chem model. NA is North America, EU is Europe, AS is Asia, and ROW is rest of world.
0 2 4 6 8 10
GEOS-Chem NOx 2005-2010 Average (ppbv)
15 10 5 0 5 10 15 20 GE OS -C he m
O3 Se
asona l am plitud e Bia s ( pp bv) (a)
0 2 4 6 8 10
GEOS-Chem NOx 2005-2010 Average (ppbv)
6 4 2 0 2 4 6 GE OS -C he m O3 Se asona l pha se Bi as (months) (b) Africa Antarctica Arctic Asia Europe North America Oceania Oceanic
NA
EU
AS
ROW
0123 4 5 6 7 8 9 10 N O x 20 05 -20 10 Average (ppbv) (c)
Figure 13. (a) Seasonal amplitude bias vs. 2005–2010 Average GEOS-Chem model NOx,(b)Seasonal phase bias vs. 2005–2010 Average GEOS-Chem model NOx,(c)2005–2010 Average GEOS-Chem model NOxby observational site. NA is North America, EU is Europe, AS is Asia, and ROW is rest of world.
lier peak stratospheric–tropospheric exchange to the surface, may be synergistic factors along with reduced emissions in bringing about a springtime ozone maximum for NH mid-latitude continental sites (Parrish et al., 2013).
We attempt to correlate seasonal model O3amplitude and
phase biases with average 2005–2010 model NOx, Fig. 13.
For the seasonal cycle the greatest overestimates of the am-plitude generally correlate with the highest NOx
largest biases in the phase (panel b). Although the phase bi-ases are not linear with NOx emissions, from the amplitude
biases it is clear that evaluation of NOxemissions would be
a sensible place to start in trying to correct biases.
7 Conclusions
We have used a Lomb–Scargle methodology to spectrally analyse surface ozone. We find spectra with distinct relation-ships between amplitude and period due to meteorological processes (weather and macroweather) as well as peaks at 1-and 365.25-day timescales (1-and harmonics). The amplitude and phase of the periodicity associated with these timescales varies significantly between sites.
A comparison between model output and measured sur-face ozone spectra shows a model underestimate of the am-plitudes at high frequencies due the spatial and temporal scales inherent in the model.
A comparison between of the periodic components for model and measurements shows model biases in the seasonal cycle in the mid-latitude NH, where there is a general over-estimation of the seasonal amplitudes in North America and Europe of up to 16 ppbv, together with delayed phase max-ima by 1–5 months. We show the amplitude biases may be related to errors in the emissions of NOx. We find lower
bi-ases for the diurnal cycle but show the majority of amplitudes in Europe and North America to be overestimated, by up to 17 ppbv.
This methodology has significant scope for future use. It can be applied to a range of model–measurement applica-tions and the associated metrics are highly suitable for Mul-timodel Intercomparison Projects (MIPs). We aim to apply this methodology to the Atmospheric Chemistry and Climate Model Intercomparison Project (ACCMIP) and Chemistry-Climate Model Initiative (CCMI) MIPs to explore differ-ences in chemistry between the different CTMs/ESMs.
8 Data availability
Observational data used in this work is publicly avail-able in a gridded format (to protect the data owner-ship rights of the original data contributors) at 1◦
reso-lution, as well as other common model resolutions (e.g. 2◦×2.5◦) in netCDF-4 file format via the British
Atmo-spheric Data Centre (BADC) (doi:10.5285/08fbe63d-fa6d-4a7a-b952-5932e3ab0452) (Evans and Sofen, 2015; Sofen et al., 2016).
The GEOS-Chem CTM is an open-access model, the source code can be downloaded from http://acmg.seas. harvard.edu/geos/. Specific model data used in this work are available on request, please contact: [email protected] or [email protected].
Acknowledgements. This work was funded by the NERC
BAC-CHUS and CAST projects NE/L01291X/1, NE/J006165/1. Thanks go to the data providers at the AirBase, CAPMON, CASTNET, EANET, EMEP, EPA AQS, NAPS, SEARCH, and WMO GAW monitoring networks for the data to make this evaluation possible. Thanks also go to colleagues at the Wolfson Atmospheric Chem-istry Laboratories, University of York for the maintaining of the monitoring station in Cabo Verde, providing data for this paper.
Edited by: R. Harley
References
Altshuler, S., Arcado, T., and Lawson, D.: Weekday vs. weekend ambient ozone concentrations – discussion and hypotheses with focus on northern California, J. Air Waste Manage., 45, 967–972, doi:10.1080/10473289.1995.10467428, 1995.
Anderson, D. C., Loughner, C. P., Diskin, G., Weinheimer, A., Canty, T. P., Salawitch, R. J., Worden, H. M., Fried, A., Mikoviny, T., Wisthaler, A., and Dickerson, R. R.: Measured and modeled CO and NOyin DISCOVER-AQ: An evaluation of emissions and chemistry over the eastern US, Atmos. Environ., 96, 78–87, doi:10.1016/j.atmosenv.2014.07.004, 2014.
Beirle, S., Platt, U., Wenig, M., and Wagner, T.: Weekly cycle of NO2 by GOME measurements: a signature of anthropogenic sources, Atmos. Chem. Phys., 3, 2225–2232, doi:10.5194/acp-3-2225-2003, 2003.
Bey, I., Jacob, D. J., Yantosca, R. M., Logan, J. A., Field, B. D., Fiore, A. M., Li, Q. B., Liu, H. G. Y., Mickley, L. J., and Schultz, M. G.: Global modeling of tropospheric chemistry with assimilated meteorology: Model description and evaluation, J. Geophys. Res.-Atmos., 106, 23073–23095, doi:10.1029/2001jd000807, 2001.
Carpenter, L. J., Fleming, Z. L., Read, K. A., Lee, J. D., Moller, S. J., Hopkins, J. R., Purvis, R. M., Lewis, A. C., Muller, K., Heinold, B., Herrmann, H., Fomba, K. W., van Pinxteren, D., Muller, C., Tegen, I., Wiedensohler, A., Muller, T., Niedermeier, N., Achterberg, E. P., Patey, M. D., Kozlova, E. A., Heimann, M., Heard, D. E., Plane, J. M. C., Mahajan, A., Oetjen, H., Ingham, T., Stone, D., Whalley, L. K., Evans, M. J., Pilling, M. J., Leigh, R. J., Monks, P. S., Karunaharan, A., Vaughan, S., Arnold, S. R., Tschritter, J., Pohler, D., Friess, U., Holla, R., Mendes, L. M., Lopez, H., Faria, B., Manning, A. J., and Wallace, D. W. R.: Seasonal characteristics of tropical marine boundary layer air measured at the Cape Verde Atmospheric Observatory, J. Atmos. Chem., 67, 87–140, doi:10.1007/s10874-011-9206-1, 2010. Clifton, O. E., Fiore, A. M., Correa, G., Horowitz, L. W., and Naik,
V.: Twenty-first century reversal of the surface ozone seasonal cycle over the northeastern United States, Geophys. Res. Lett., 41, 7343–7350, doi:10.1002/2014GL061378, 2014.
Cooper, O. R., Gao, R.-S., Tarasick, D., Leblanc, T., and Sweeney, C.: Long-term ozone trends at rural ozone monitoring sites across the United States, 1990–2010, J. Geophys. Res.-Atmos., 117, D22307, doi:10.1029/2012JD018261, 2012.
Cooper, O. R., Parrish, D. D., Ziemke, J., Balashov, N. V., Cu-peiro, M., Galbally, I. E., Gilge, S., Horowitz, L., Jensen, N. R., Lamarque, J.-F., Naik, V., Oltmans, S. J., Schwab, J., Shindell, D. T., Thompson, A. M., Thouret, V., Wang, Y., and Zbinden, R. M.: Global distribution and trends of tropospheric ozone: An observation-based review, Elem. Sci. Anthr., 2, 000029, doi:10.12952/journal.elementa.000029, 2014.
Derwent, R. and Davies, T.: Modelling the impact of NOxor hydro-carbon control on photochemical ozone in Europe, Atmos. Envi-ron., 28, 2039–2052, doi:10.1016/1352-2310(94)90472-3, 1994. Derwent, R., Stevenson, D., Doherty, R., Collins, W., and Sander-son, M.: How is surface ozone in Europe linked to Asian and North American NOx emissions?, Atmos. Environ., 42, 7412– 7422, doi:10.1016/j.atmosenv.2008.06.037, 2008.
Dutton, S. J., Rajagopalan, B., Vedal, S., and Hannigan, M. P.: Temporal patterns in daily measurements of inorganic and or-ganic speciated PM2.5in Denver, Atmos. Environ., 44, 987–998, doi:10.1016/j.atmosenv.2009.06.006, 2010.
Ehhalt, D. H.: Photooxidation of trace gases in the tro-posphere, Phys. Chem. Chem. Phys., 1, 5401–5408, doi:10.1039/a905097c, 1999.
Evans, M. J. and Sofen, E. D.: Gridded Global Surface Ozone Met-rics data (1971–2015) for Atmospheric Chemistry Model Eval-uation – version 2.4, Centre for Environmental Data Analysis, doi:10.5285/08fbe63d-fa6d-4a7a-b952-5932e3ab0452, 2015. Fiore, A., Oberman, J., Lin, M., Zhang, L., Clifton, O.,
Ja-cob, D., Naik, V., Horowitz, L., Pinto, J., and Milly, G.: Es-timating North American background ozone in U.S. surface air with two independent global models: Variability, uncer-tainties, and recommendations, Atmos. Environ., 96, 284–300, doi:10.1016/j.atmosenv.2014.07.045, 2014.
Forster, P., Ramaswamy, V., Artaxo, P., Berntsen, T., Betts, R., Fa-hey, D. W., Haywood, J., Lean, J., Lowe, D. C., Myhre, G., Nganga, J., Prinn, R., Raga, G., Schulz, M., and Dorland, R. V.: Changes in Atmospheric Constituents and in Radiative Forcing, in: Climate Change 2007: The Physical Science Basis. Contri-bution of Working Group I to the Fourth Assessment Report of the Intergovernmental Panel on Climate Change, edited by: Solomon, S., Qin, D., Manning, M., Chen, Z., Marquis, M., Av-eryt, K., Tignor, M., and Miller, H., 131–215, Cambridge Uni-versity Press, Cambridge, UK, 2007.
Fowler, D., Pilegaard, K., Sutton, M., Ambus, P., Raivonen, M., Duyzer, J., Simpson, D., Fagerli, H., Fuzzi, S., Schjoerring, J., Granier, C., Neftel, A., Isaksen, I., Laj, P., Maione, M., Monks, P., Burkhardt, J., Daemmgen, U., Neirynck, J., Personne, E., Wichink-Kruit, R., Butterbach-Bahl, K., Flechard, C., Tuovi-nen, J., Coyle, M., Gerosa, G., Loubet, B., Altimir, N., Gru-enhage, L., Ammann, C., Cieslik, S., Paoletti, E., Mikkelsen, T., Ro-Poulsen, H., Cellier, P., Cape, J., Horváth, L., Loreto, F., Niinemets, Ü., Palmer, P., Rinne, J., Misztal, P., Nemitz, E., Nilsson, D., Pryor, S., Gallagher, M., Vesala, T., Skiba, U., Brüggemann, N., Zechmeister-Boltenstern, S., Williams, J., O’Dowd, C., Facchini, M., de Leeuw, G., Flossman, A., Chaumerliac, N., and Erisman, J.: Atmospheric composition
change: Ecosystems–Atmosphere interactions, Atmos. Environ., 43, 5193–5267, doi:10.1016/j.atmosenv.2009.07.068, 2009. Giglio, L., Randerson, J. T., van der Werf, G. R., Kasibhatla, P.
S., Collatz, G. J., Morton, D. C., and DeFries, R. S.: Assess-ing variability and long-term trends in burned area by mergAssess-ing multiple satellite fire products, Biogeosciences, 7, 1171–1186, doi:10.5194/bg-7-1171-2010, 2010.
Guenther, A., Karl, T., Harley, P., Wiedinmyer, C., Palmer, P. I., and Geron, C.: Estimates of global terrestrial isoprene emissions using MEGAN (Model of Emissions of Gases and Aerosols from Nature), Atmos. Chem. Phys., 6, 3181–3210, doi:10.5194/acp-6-3181-2006, 2006.
Harris, F.: On the use of windows for harmonic analysis with the discrete Fourier transform, in: Proc. IEEE, Vol. 66, 51– 83, Institute of Electrical and Electronics Engineers (IEEE), doi:10.1109/PROC.1978.10837, 1978.
Hess, P. G. and Zbinden, R.: Stratospheric impact on tropospheric ozone variability and trends: 1990–2009, Atmos. Chem. Phys., 13, 649–674, doi:10.5194/acp-13-649-2013, 2013.
Hocke, K.: Phase estimation with the Lomb-Scargle periodogram method, Ann. Geophys., 16, 356–358, 1998.
Holtslag, A. A. M. and Boville, B. A.: Local versus non-local boundary layer diffusion in a global climate model, J. Climate, 6, 1825–1842, doi:10.1175/1520-0442(1993)006<1825:LVNBLD>2.0.CO;2, 1993.
Horne, J. H. and Baliunas, S. L.: A prescription for period analysis of unevenly sampled time-series, Astrophys. J., 302, 757–763, doi:10.1086/164037, 1986.
Hu, L., Millet, D. B., Baasandorj, M., Griffis, T. J., Travis, K. R., Tessum, C. W., Marshall, J. D., Reinhart, W. F., Mikoviny, T., Müller, M., Wisthaler, A., Graus, M., Warneke, C., and de Gouw, J.: Emissions of C6–C8 aromatic com-pounds in the United States: Constraints from tall tower and aircraft measurements, J. Geophys. Res.-Atmos., 120, 826–842, doi:10.1002/2014JD022627, 2015.
Jenkin, M. E. and Clemitshaw, K. C.: Ozone and other secondary photochemical pollutants: chemical processes governing their formation in the planetary boundary layer, Atmos. Environ., 34, 2499–2527, doi:10.1016/S1352-2310(99)00478-1, 2000. Jonson, J. E., Simpson, D., Fagerli, H., and Solberg, S.: Can we
ex-plain the trends in European ozone levels?, Atmos. Chem. Phys., 6, 51–66, doi:10.5194/acp-6-51-2006, 2006.
Levy, H.: Photochemistry of the lower troposphere, Planet. Space Sci., 20, 919–935, doi:10.1016/0032-0633(72)90177-8, 1972. Lin, J.-T. and McElroy, M. B.: Impacts of boundary layer mixing
on pollutant vertical profiles in the lower troposphere: Impli-cations to satellite remote sensing, Atmos. Environ., 44, 1726– 1739, doi:10.1016/j.atmosenv.2010.02.009, 2010.
Logan, J. A.: Tropospheric ozone: Seasonal behavior, trends, and anthropogenic influence, J. Geophys. Res., 90, 10463, doi:10.1029/JD090iD06p10463, 1985.
Lomb, N. R.: Least-squares frequency-analysis of un-equally spaced data, Astrophys. Space Sci., 39, 447–462, doi:10.1007/bf00648343, 1976.
Lovejoy, S. and Schertzer, D.: Low-Frequency Weather and the Emergence of the Climate, in: Extrem. Events Nat. Hazards Complex. Perspect., 231–254, American Geophysical Union, doi:10.1029/2011GM001087, 2013a.
Lovejoy, S. and Schertzer, D.: The Weather and Climate: Emergent Laws and Multifractal Cascades, Cambridge University Press, Cambridge, UK, 2013b.
Marr, L. C. and Harley, R. A.: Spectral analysis of weekday– weekend differences in ambient ozone, nitrogen oxide, and non-methane hydrocarbon time series in California, Atmos. Environ., 36, 2327–2335, doi:10.1016/S1352-2310(02)00188-7, 2002. McLinden, C. A., Olsen, S. C., Hannegan, B., Wild, O., Prather,
M. J., and Sundet, J.: Stratospheric ozone in 3-D models: A sim-ple chemistry and the cross-tropopause flux, J. Geophys. Res., 105, 14653, doi:10.1029/2000JD900124, 2000.
Millet, D. B., Jacob, D. J., Boersma, K. F., Fu, T.-M., Kurosu, T. P., Chance, K., Heald, C. L., and Guenther, A.: Spatial distribu-tion of isoprene emissions from North America derived from formaldehyde column measurements by the OMI satellite sen-sor, J. Geophys. Res., 113, D02307, doi:10.1029/2007JD008950, 2008.
Monks, P. S.: A review of the observations and origins of the spring ozone maximum, Atmos. Environ., 34, 3545–3561, doi:10.1016/s1352-2310(00)00129-1, 2000.
Monks, P. S.: Gas-phase radical chemistry in the troposphere, Chem. Soc. Rev., 34, 376–95, doi:10.1039/b307982c, 2005. Monks, P. S., Salisbury, G., Holland, G., Penkett, S. A., and Ayers,
G. P.: A seasonal comparison of ozone photochemistry in the remote marine boundary layer, Atmos. Environ., 34, 2547–2561, doi:10.1016/S1352-2310(99)00504-X, 2000.
Monks, P. S., Archibald, A. T., Colette, A., Cooper, O., Coyle, M., Derwent, R., Fowler, D., Granier, C., Law, K. S., Mills, G. E., Stevenson, D. S., Tarasova, O., Thouret, V., von Schneidemesser, E., Sommariva, R., Wild, O., and Williams, M. L.: Tropospheric ozone and its precursors from the urban to the global scale from air quality to short-lived climate forcer, Atmos. Chem. Phys., 15, 8889–8973, doi:10.5194/acp-15-8889-2015, 2015.
Murray, L. T., Jacob, D. J., Logan, J. A., Hudman, R. C., and Koshak, W. J.: Optimized regional and interannual variability of lightning in a global chemical transport model constrained by LIS/OTD satellite data, J. Geophys. Res.-Atmos., 117, D20307, doi:10.1029/2012JD017934, 2012.
Musial, J. P., Verstraete, M. M., and Gobron, N.: Technical Note: Comparing the effectiveness of recent algorithms to fill and smooth incomplete and noisy time series, Atmos. Chem. Phys., 11, 7905–7923, doi:10.5194/acp-11-7905-2011, 2011.
Olivier, J., Aardenne, J. A, Dentener, F., Ganzeveld, L., and Peters, J.: Recent trends in global greenhouse gas emissions: regional trends and spatial distribution of key sources, Environ. Sci., 2, 81–99, doi:10.1080/15693430500400345, 2005.
Oltmans, S. J., Lefohn, A. S., Harris, J. M., Galbally, I., Scheel, H. E., Bodeker, G., Brunke, E., Claude, H., Tarasick, D., John-son, B. J., Simmonds, P., Shadwick, D., Anlauf, K., Hay-den, K., Schmidlin, F., Fujimoto, T., Akagi, K., Meyer, C., Nichol, S., Davies, J., Redondas, A., and Cuevas, E.: Long-term
changes in tropospheric ozone, Atmos. Environ., 40, 3156–3173, doi:10.1016/j.atmosenv.2006.01.029, 2006.
Oltmans, S. J., Lefohn, A. S., Shadwick, D., Harris, J. M., Scheel, H. E., Galbally, I., Tarasick, D. W., Johnson, B. J., Brunke, E. G., Claude, H., Zeng, G., Nichol, S., Schmidlin, F., Davies, J., Cuevas, E., Redondas, A., Naoe, H., Nakano, T., and Kawasato, T.: Recent tropospheric ozone changes – A pattern domi-nated by slow or no growth, Atmos. Environ., 67, 331–351, doi:10.1016/j.atmosenv.2012.10.057, 2013.
Palmer, P. I.: Mapping isoprene emissions over North America us-ing formaldehyde column observations from space, J. Geophys. Res., 108, 4180, doi:10.1029/2002JD002153, 2003.
Parrish, D. D., Law, K. S., Staehelin, J., Derwent, R., Cooper, O. R., Tanimoto, H., Volz-Thomas, A., Gilge, S., Scheel, H. E., Stein-bacher, M., and Chan, E.: Lower tropospheric ozone at northern midlatitudes: Changing seasonal cycle, Geophys. Res. Lett., 40, 1631–1636, doi:10.1002/grl.50303, 2013.
Parrish, D. D., Lamarque, J.-F., Naik, V., Horowitz, L., Shindell, D. T., Staehelin, J., Derwent, R., Cooper, O. R., Tanimoto, H., Volz-Thomas, A., Gilge, S., Scheel, H.-E., Steinbacher, M., and Fröhlich, M.: Long-term changes in lower tropospheric baseline ozone concentrations: Comparing chemistry-climate models and observations at northern midlatitudes, J. Geophys. Res.-Atmos., 119, 5719–5736, doi:10.1002/2013JD021435, 2014.
Parrish, D. D., Galbally, I. E., Lamarque, J.-F., Naik, V., Horowitz, L., Shindell, D. T., Oltmans, S. J., Derwent, R., Tanimoto, H., Labuschagne, C., and Cupeiro, M.: Seasonal cycles of O3 in the marine boundary layer: Observation and model simu-lation comparisons, J. Geophys. Res.-Atmos., 121, 538–557, doi:10.1002/2015JD024101, 2016.
Press, W. H. and Rybicki, G. B.: Fast algorithm for spectral-analysis of unevenly sampled data, Astrophys. J., 338, 277–280, doi:10.1086/167197, 1989.
Press, W. H., Teukolsky, S. A., Vetterling, W. T., and Flannery, B. P.: Numerical Recipes in Fortran 77 – The Art Of Scien-tific Computing – Volume I, Vol. 1, Cambridge University Press, doi:10.1016/0169-2607(87)90037-X, 1992.
Rehfeld, K., Marwan, N., Heitzig, J., and Kurths, J.: Comparison of correlation analysis techniques for irregularly sampled time se-ries, Nonlin. Processes Geophys., 18, 389–404, doi:10.5194/npg-18-389-2011, 2011.
Scargle, J. D.: Studies in astronomical time-series analysis .2. Sta-tistical aspects of spectral-analysis of unevenly spaced data, As-trophys. J., 263, 835–853, doi:10.1086/160554, 1982.
Schnell, J. L., Prather, M. J., Josse, B., Naik, V., Horowitz, L. W., Cameron-Smith, P., Bergmann, D., Zeng, G., Plummer, D. A., Sudo, K., Nagashima, T., Shindell, D. T., Faluvegi, G., and Strode, S. A.: Use of North American and European air quality networks to evaluate global chemistry–climate model-ing of surface ozone, Atmos. Chem. Phys., 15, 10581–10596, doi:10.5194/acp-15-10581-2015, 2015.
Schulz, M. and Mudelsee, M.: REDFIT: estimating red-noise spectra directly from unevenly spaced paleoclimatic time series, Comput. Geosci., 28, 421–426, doi:10.1016/s0098-3004(01)00044-9, 2002.
Sofen, E. D., Bowdalo, D., Evans, M. J., Apadula, F., Bonasoni, P., Cupeiro, M., Ellul, R., Galbally, I. E., Girgzdiene, R., Luppo, S., Mimouni, M., Nahas, A. C., Saliba, M., and Tørseth, K.: Gridded global surface ozone metrics for atmospheric chemistry model evaluation, Earth Syst. Sci. Data, 8, 41–59, doi:10.5194/essd-8-41-2016, 2016.
Stefan, S., Necula, C., and Georgescu, F.: Analysis of long-range transport of particulate matters in connection with air circulation over Central and Eastern part of Europe, Phys. Chem. Earth, 35, 523–529, doi:10.1016/j.pce.2009.12.008, 2010.
Stein, O., Schultz, M. G., Bouarar, I., Clark, H., Huijnen, V., Gaudel, A., George, M., and Clerbaux, C.: On the wintertime low bias of Northern Hemisphere carbon monoxide found in global model simulations, Atmos. Chem. Phys., 14, 9295–9316, doi:10.5194/acp-14-9295-2014, 2014.
Stevenson, D. S., Dentener, F. J., Schultz, M. G., Ellingsen, K., van Noije, T. P. C., Wild, O., Zeng, G., Amann, M., Ather-ton, C. S., Bell, N., Bergmann, D. J., Bey, I., Butler, T., Co-fala, J., Collins, W. J., Derwent, R. G., Doherty, R. M., Drevet, J., Eskes, H. J., Fiore, A. M., Gauss, M., Hauglustaine, D. A., Horowitz, L. W., Isaksen, I. S. A., Krol, M. C., Lamarque, J.-F., Lawrence, M. G., Montanaro, V., Müller, J.-F., Pitari, G., Prather, M. J., Pyle, J. A., Rast, S., Rodriguez, J. M., Sanderson, M. G., Savage, N. H., Shindell, D. T., Strahan, S. E., Sudo, K., and Szopa, S.: Multimodel ensemble simulations of present-day and near-future tropospheric ozone, J. Geophys. Res., 111, D08301, doi:10.1029/2005JD006338, 2006.
Tanimoto, H.: Seasonal cycles of ozone and oxidized nitro-gen species in northeast Asia 2. A model analysis of the roles of chemistry and transport, J. Geophys. Res., 107, 4706, doi:10.1029/2001JD001497, 2002.
Tanimoto, H., Sawa, Y., Matsueda, H., Uno, I., Ohara, T., Yamaji, K., Kurokawa, J., and Yonemura, S.: Significant latitudinal gra-dient in the surface ozone spring maximum over East Asia, Geo-phys. Res. Lett., 32, L21805, doi:10.1029/2005GL023514, 2005. Travis, K. R., Jacob, D. J., Fisher, J. A., Kim, P. S., Marais, E. A., Zhu, L., Yu, K., Miller, C. C., Yantosca, R. M., Sulprizio, M. P., Thompson, A. M., Wennberg, P. O., Crounse, J. D., St. Clair, J. M., Cohen, R. C., Laugher, J. L., Dibb, J. E., Hall, S. R., Ull-mann, K., Wolfe, G. M., Pollack, I. B., Peischl, J., Neuman, J. A., and Zhou, X.: NOxemissions, isoprene oxidation pathways, ver-tical mixing, and implications for surface ozone in the Southeast United States, Atmos. Chem. Phys. Discuss., doi:10.5194/acp-2016-110, in review, 2016.
Valenzuela, J. and Pontt, J.: Real-Time Interharmonics Detection and Measurement Based on FFT Algorithm, in: Proc. Appl. Elec-tron., 259–264, Institute of Electrical and Electronics Engineers (IEEE), Pilsen, 2009.
van Donkelaar, A., Martin, R. V., Leaitch, W. R., Macdonald, A. M., Walker, T. W., Streets, D. G., Zhang, Q., Dunlea, E. J., Jimenez, J. L., Dibb, J. E., Huey, L. G., Weber, R., and Andreae, M. O.: Analysis of aircraft and satellite measurements from the Inter-continental Chemical Transport Experiment (INTEX-B) to quan-tify long-range transport of East Asian sulfur to Canada, At-mos. Chem. Phys., 8, 2999–3014, doi:10.5194/acp-8-2999-2008, 2008.
Vestreng, V., Ntziachristos, L., Semb, A., Reis, S., Isaksen, I. S. A., and Tarrasón, L.: Evolution of NOx emissions in Europe with focus on road transport control measures, Atmos. Chem. Phys., 9, 1503–1520, doi:10.5194/acp-9-1503-2009, 2009.
Vinken, G. C. M., Boersma, K. F., Jacob, D. J., and Meijer, E. W.: Accounting for non-linear chemistry of ship plumes in the GEOS-Chem global chemistry transport model, Atmos. Chem. Phys., 11, 11707–11722, doi:10.5194/acp-11-11707-2011, 2011. Wang, Y., Jacob, D. J., and Logan, J. A.: Global simulation of tropo-spheric O3-NOx-hydrocarbon chemistry: 1. Model formulation, J. Geophys. Res., 103, 10713, doi:10.1029/98JD00158, 1998. WHO: WHO Air quality guidelines for particulate matter, ozone,
nitrogen dioxide and sulfur dioxide: Global update 2005, World Health Organization, Regional Office for Europe, 2005. Wild, O. and Akimoto, H.: Intercontinental transport of ozone and
its precursors in a three-dimensional global CTM, J. Geophys. Res.-Atmos., 106, 27729–27744, doi:10.1029/2000jd000123, 2001.
Xiao, Y., Logan, J. A., Jacob, D. J., Hudman, R. C., Yantosca, R., and Blake, D. R.: Global budget of ethane and regional constraints on U.S. sources, J. Geophys. Res., 113, D21306, doi:10.1029/2007JD009415, 2008.
Yevich, R. and Logan, J. A.: An assessment of biofuel use and burn-ing of agricultural waste in the developburn-ing world, Global Bio-geochem. Cy., 17, 1095, doi:10.1029/2002GB001952, 2003. Yienger, J. J. and Levy, H.: Empirical model of global
soil-biogenic NOx emissions, J. Geophys. Res., 100, 11447, doi:10.1029/95JD00370, 1995.