231
E.U. VERSUS O.E.C.D. – MIGRATION FLOW UNDER THE LABOUR TAXATION IMPACT
Paula Lazăr, Mariana Vuță,
Finance Department, Faculty of Finance, Insurance, Banks and Stock Exchange, The Bucharest University of Economic Studies, Bucharest, Romania
[email protected] [email protected]
Abstract: In a world governed by the freedom of movement, production factors – capital, labour and consumption – can “run” from on territory to another bringing along positive and negative effects, just as well. Labour, the second in line of “run away” production factors, has a great impact upon a state economy generating sustainable growth or increasing budgetary revenues This paper presents for a period of 7 years, for both European (UE-28) and international (OECD) level, the migration flow under the labour taxation impact (it is well known that more than 75% of the migration flow is work force related). The authors found that even if both areas are attracting labour force the reasons for doing that are completely different – while for the OECD member states and non-EU member states there will always be the “occident fascination” in the Europeans are “voting with their feet”.
Keywords: migration, labour, taxation, implicit tax rate
JEL classification: F22, H30, O15
1. Introduction
The taxation policy and its impact upon a state economy is a never ending point of discussion at both European and international level. Taking into consideration that we live in a world without borders, where everybody can decide where they want to live and wo rk, where they want to invest their capital or what to buy – national or foreign products – we can state that even the slightest positive difference between national and foreign legislation – in any filed – can, and most probably will, trigger a “run for the better” of a production factor.
232
Migration is just as old as the world, but along history there have been a number of factors that pushed people to migrate, like: lack of opportunities in the origin state, economic crisis, religious persecutions, wars, etc. We can state that migration is just a natural and structural phenomenon of the human society. Its effects, and especially the effect brought by the specialized labour force, have been observed for the first time (Stanica, 2000) in the case of emigrants from the Byzantine Empire who brought their knowledge to the Islamic world and to the renascence Italy. The idea to quantify the migration effects appeared much later – late XVIII century, beginning of XIX century – when the international economy faces the technological boom.
2. Migration and labour taxation
Human flows are always taking place between two states – an origin state and a destination state. In both territories the migration phenomenon will have positive and negative effects but, in order, to consider migration a “good thing”, at a given time, the positive effects must compensate and overrun the negative ones.
Advantages Disadvantages
Origin state
· Discovers new opportunities in developing economies and will attract at national level
specialized labour force; · Interact with people from
different cultures, with different languages and religions, etc; · Gain knowledge about other
states, traditions, etc
· Loosing part of the specialized labour force that could have been used on national level;
· Decrease of number of jobs due to migration and from here, also decrease of the total collected revenues;
· Economic, social and never the less political pressure in order to stop the migration phenomenon – immigration and emigration, etc
Destination state
· Foreign labour force will sustain the economic growth;
· Increase in collected revenues; · Families reintegration;
· Specialized labour force that most time is cheaper than the national one, etc
· Special taxation treatments applied to foreign human capital against national one;
· Increase of unemployment among indigenous population; · Increase of criminality;
· Increase in social tensions, etc Figure 1 Migration flow advantages and disadvantages
Source: personal synthesis
We notice, as mentioned before, that in both cases the migration flow has positive and negative effects. Maybe the biggest advantage, of an destination state, is that attracting specialized labour force means that that state is also an financial capital attractor and can maximize both flows – more capital means more investments, more investments means more jobs, more jobs will attract a higher human flow. At the other end we will find the origin state that can loose both capital and specialized labour force – the capital won’t find investment opportunities and the labour force won’t find a job according to its requirements.
233
· macroeconomic stability – viewed by profitability of national and international future investments (capital);
· prices level – viewed by inflation and the purchasing power (consumption);
· unemployment rate – viewed by job’s safety /stability and in this context the working profitability (labour).
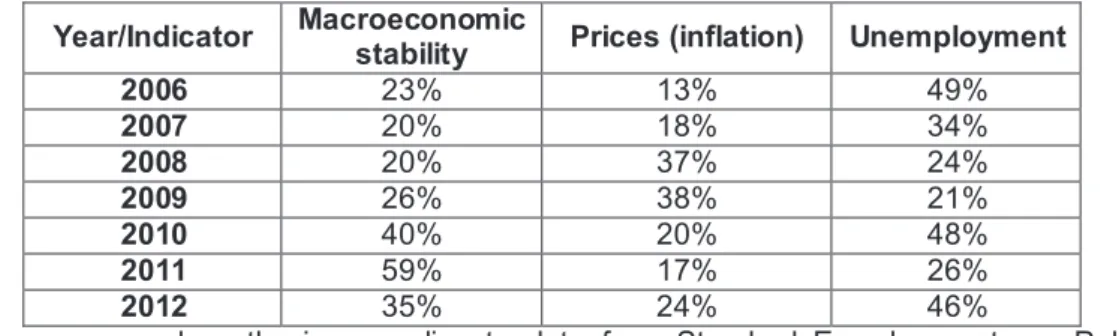
Table 1 European Union problems according to respondents
Year/Indicator Macroeconomic
stability Prices (inflation) Unemployment
2006 23% 13% 49%
2007 20% 18% 34%
2008 20% 37% 24%
2009 26% 38% 21%
2010 40% 20% 48%
2011 59% 17% 26%
2012 35% 24% 46%
Source: personal synthesis according to data from Standard Euro-barometru – Public opinion in the European Union, 2006-2012
We can notice that throughout the analysed period the three elements hierarchy is made according to the economic cycle evolution. Thus, at the first signs of the economic crisis (2008, 2009), inflation becomes an acute problem and afterwards (2010, 2011) the macro-stability takes the first place. We do have to notice that during this whole period the unemployment issues is actually the most important one – the average rate registered by the factor “unemployment” is 35.43% face to 31.86% for macro-stability and 23.85% for inflation. So the fear related to the unemployment status can and will generate migration. Furthermore, individuals – owners of the labour force – can and will choose to migrate and settle down wherever they want and feel like “home”, giving their vote of confidence to that chosen state.
The migratory pressure has intensify in the last decades because of differences in remunerations, opportunities given by certain jobs or certain states – these being related not only to the labour market – and nevertheless because of the demographic characteristics of the developed economies compared to the developing ones.
The task to correctly quantify and understand this phenomenon is very difficult due to the lack of data; most countries are realizing statistics regarding the number and structure of immigrants (immigrant – a person with a different nationality that chooses to enter the territory of another state with the clear intention of settling down there) and the number and structure of emigrants (a person leaving the national territory with the clear intention to settle down elsewhere); available data is coming though equerries made by special bodies or by the declaration filled by either immigrants or emigrants when they enter or leave the country.
Putting aside the lack of available data, we can state that net migration rate has fluctuated during periods of time due to factors like weather conditions, revenue level, job opportunities, political orientations, demography (age, sex, etc), taxation poli cies, budgetary policies, etc. some of these factors are pure natural – weather conditions, but some are “man made”, like policies.
234
is made for a period of 7 years for both areas and we aimed at finding out if one or both of these areas are attracting human capital or not.
Table 2 European average net migration rates (UE-28)
2006 2007 2008 2009 2010 2011 2012 2,94 3,32 4,01 1,57 0,88 1,55 1,34 Source: personal synthesis according to data from epp.eurostat.ec.europa.eu
The net migration rate is the difference between immigrants and emigrants determined over a period of time, usually 1 year, and reported by 1,000 individuals. This rate can have both positive values – in which case that territory attracts more immigrants; the number of immigrants is higher than the number of emigrants – and negative values – in which case the number of emigrants is higher than the immigrant’s one.
For data in table 2 we can see that the European area is a “magnet” to foreign labour force even of it is an intercommunity flow or an extra-community flow. Furthermore, we notice the influence of the economic and financial crisis that actually increased in 2008 the net migration rate face to 2007 and then because of the political and social tensions in the European area made the indicator to plunge to just 0,88 in 2010. If we were to analyse the data state by state we will find another interesting aspect. Thus, even if the UE-28 is a “magnet”, there are states that in the analysed period (2006-2012), actually throughout the entire period, have negative average net migration rates – Lithuania, Latvia, Romania, Estonia, Bulgaria – and the registered levels are getting higher because of the crisis (Lithuania) or because of the adhesion process to the UE-28 (Romania, Bulgaria). Opposite to these economies, there are states like – Luxembourg, Belgium, Hungary, Cyprus, Great Britain – that present a positive average net migration rate throughout the analysed period. Lithuania is the state that has the highest negative average net migration rate – is the most “unlike” state - and Luxembourg is the state with the highest positive average net migration rate – the most “liked” state - in the analysed period – but we do have to consider that both countries are relatively small – Luxembourg has approximately 650.000 citizens and Lithuania has less then 3.000.000 citizens and s o the results can be subject to distortions.
Table 3 Medium emigrants number at international level (OECD)
-thousands individuals -
2006 2007 2008 2009 2010 2011 2012 171,78 178,96 176,59 160,33 157,20 163,64 168,32 Source: personal synthesis according to available data on http://stats.oecd.org/
According to data in table 3 we noticed that OECD member states are also attracting human capital but we can’t state for sure that the OECD is a “magnet” or not due to the lack of data. Again if there is to analyse individual countries we find that non-EU OECD member states like, USA, Canada, Japan, Korea or Australia are attracting a significant number of emigrants.
Now, that we have seen that both areas are confronted with a migration flow, the question that arises is: Is part of this migration flow determined by the taxation policies promoted by states? We will try to answer this question in the next paragraphs.
235
made of taxes – direct, indirect – and social contributions and this is why the slightest positive difference in taxation face to others will lead to the “run away” of production factors from national territory.
Table 4 EU versus OECD - average %CIT/GDP and %PIT/GDP, 2006-2012)
CIT/GDP PIT/GDP
UE-28 2.7% 9.3%
OECD 3.2% 8.7%
Source: personal synthesis according to data from Taxation trends, 2014
Table 4 shows that both EU-28 and OECD areas are focusing their taxation policies on individuals – the personal income tax (PIT) to gross domestic product (GDP) is higher than the corporate income tax (CIT) to GDP with 6.6 pp in the EU-28 and with 5.5 pp in the OECD. This emphasized what we have stated before that states will try to compensate resources lost due to capital flows by increasing the fiscal burden upon labour.
A more accurate indicator used to establish the fiscal burden upon a production factor is the implicit tax rate (ITR) that quantifies the impact of all taxes levied upon that production factor.
Table 5 EU versus OECD - ITR for labour (%)
2006 2007 2008 2009 2010 2011 2012 UE-28 35.6 35.8 36.0 35.4 35.4 35.8 36.1 OECD 25.7 25.6 26.4 27.6 23.9 25.8 27.3 Source: personal synthesis according to data from Taxation trends, 2014
We notice that the fiscal burden upon labour in the European area is higher than the one register in the OECD area – with an average of 35.73% face to 26.05% and a 9.68 pp difference. Furthermore, we do noticed that during the crisis actually increases the fiscal burden on labour and that level registered after that period (2008) don’t fluctuate much. For the same period of time the average ITR for capital was 27,12% in the EU-28 and a staggering 10,4% in the OECD so, by comparing the two production factors ITR - labour and capital - we can easily notice state’s preference for taxing labour.
3. Conclusions
236
The authors are stating that we do have to take into account that the analysis was focused only upon general migration and general fiscal burden upon labour and that the conclusions might be subject to interpretation due to available data. Furthermore, it would be interesting to see a more detailed aspect of the anlysis – like only the brain-drain migration and it’s connection to the taxation systems.
Acknowledgement
This paper was co-financed from the European Social Fund, through the Sectoral Operational Programme Human Resources Development 2007-2013, project number POSDRU/159/1.5/S/138907 "Excellence in scientific interdisciplinary research, doctoral and postdoctoral, in the economic, social and medical fields - EXCELIS", coordinator The Bucharest University of Economic Studies
References:
Bradi C.(2000) The historical evolution of highly qualified migration, Instituite of Research and Population and Social Policies;
European Commission (2014) Taxation trends in the European Union: data for EU Member
States, Iceland and Norway – [online] Available:
http://ec.europa.eu/taxation_customs/taxation/gen_info/economic_analysis/tax_structures/i ndex_en.htm [27 March 2015]
European Union publications (2012) Standard Eurobarometru – Public opinion in the
european Union, 2006-2012, – [online] Available
http://ec.europa.eu/public_opinion/archives/eb_arch_en.htm [27 March 2015]
Tiebout C., (1956) A pure theory of local expenditure, Journal of Political Economics, no. 64 (1),
Stănică S.I. (2011) Apariția și evoluția fenomenului de brain drain, Revista română de sociologie, nr. 3-4, București;
http://stats.oecd.org/