No Major Host Genetic Risk Factor
Contributed to A(H1N1)2009 Influenza
Severity
Koldo Garcia-Etxebarria1¤a, María Alma Bracho2,3, Juan Carlos Galán3,4, Tomàs Pumarola5, Jesús Castilla3,6, Raúl Ortiz de Lejarazu7, Mario
Rodríguez-Dominguez4,8, Inés Quintela9, Núria Bonet1¤b, Marc Garcia-Garcerà1¤c, Angela Domínguez3,10, Fernando González-Candelas2,3, Francesc Calafell1
*, CIBERESP Cases and Controls in Pandemic Influenza Working Group
1Institut de Biologia Evolutiva (CSIC-Universitat Pompeu Fabra), Barcelona, Spain,2Unidad Mixta de Investigación en Genómica y Salud CSISP-UVEG/Institut Cavanilles-Universitat de València, València, Spain,3CIBER de Epidemiologia y Salud Pública, Madrid, Spain,4Servicio de Microbiología Hospital Universitario Ramón y Cajal and Instituto Ramón y Cajal de Investigación Sanitaria (IRYCIS), Madrid, Spain, 5Department of Microbiology, Hospital Universitari Vall d’Hebron (HUVH), Universitat Autònoma de Barcelona (UAB), Vall d’Hebron Institut de Recerca (VHIR), Barcelona, Spain,6Instituto de Salud Pública de Navarra, Pamplona, Spain,7Department of Microbiology and Immunology, Hospital Clinico Universitario, Valladolid, Spain,8Red Española de Investigación en Patología Infecciosa (REIPI), Madrid, Spain,9Grupo de Medicina Xenomica, Universidade de Santiago de Compostela, Centro Nacional de Genotipado— Plataforma de Recursos Biomoleculares y Bioinformaticos—Instituto de Salud Carlos III (CeGen-PRB2-ISCIII), Santiago de Compostela, Spain,10 Departament de Salut Pública, Universitat de Barcelona, Barcelona, Spain
¤a Current Address: Immunogenetics Research Laboratory, Department of Genetics, Physical Anthropology and Animal Physiology, BioCruces Health Research Institute, University of the Basque Country-UPV/EHU, Leioa, Basque Country, Spain
¤b Current Address: Genome Facility Core Service, Universitat Pompeu Fabra, Barcelona, Spain ¤c Current Address: Evolutionary Microbial Genomics Unit, Institut Pasteur, Paris
¶ Membership in the CIBERESP Cases and Controls in Pandemic Influenza Working Group is provided in the acknowledgments.
Abstract
While most patients affected by the influenza A(H1N1) pandemic experienced mild symp-toms, a small fraction required hospitalization, often without concomitant factors that could explain such a severe course. We hypothesize that host genetic factors could contribute to aggravate the disease. To test this hypothesis, we compared the allele frequencies of 547,296 genome-wide single nucleotide polymorphisms (SNPs) between 49 severe and 107 mild confirmed influenza A cases, as well as against a general population sample of 549 individuals. When comparing severe vs. mild influenza A cases, only one SNP was close to the conventional p = 5×10⁻⁸. This SNP, rs28454025, sits in an intron of the
GSK233gene, which is involved in a neural development, but seems not to have any con-nections with immunological or inflammatory functions. Indirectly, a previous association reported withCD55was replicated. Although sample sizes are low, we show that the statis-tical power in our design was sufficient to detect highly-penetrant, quasi-Mendelian genetic
OPEN ACCESS
Citation:Garcia-Etxebarria K, Bracho MA, Galán JC, Pumarola T, Castilla J, Ortiz de Lejarazu R, et al. (2015) No Major Host Genetic Risk Factor Contributed to A(H1N1)2009 Influenza Severity. PLoS ONE 10(9): e0135983. doi:10.1371/journal. pone.0135983
Editor:Hiroshi Nishiura, The University of Tokyo, JAPAN
Received:June 15, 2015
Accepted:July 28, 2015
Published:September 17, 2015
Copyright:© 2015 Garcia-Etxebarria et al. This is an open access article distributed under the terms of the
Creative Commons Attribution License, which permits unrestricted use, distribution, and reproduction in any medium, provided the original author and source are credited.
Data Availability Statement:The primary data used in association analyses, namely allele frequencies in cases and controls, have been deposited in the GWAS Central repository as study HGVST1832 (http://www.gwascentral.org/study/HGVST1832) and in the figshare repository (http://dx.doi.org/10.6084/ m9.figshare.1528227).
factors. Hence, and assuming that rs28454025 is likely to be a false positive, no major genetic factor was detected that could explain poor influenza A course.
Introduction
In 2009, the influenza A(H1N1)2009 pandemic swept the globe. Some of its features caused concern, such as a higher mortality risk in infants and children than in seasonal influenza epi-demics, and activity peaks out of the cold season. Although it followed a mild course in most patients, in others it was much more aggressive for then unknown reasons. In Spain, a collec-tion of severe, hospitalized patients was compared to a series of controls (defined as confirmed but mild influenza cases that were treated ambulatorily), and a number of sociodemographic and health risk factors were identified [1]. Yet, 37.2% of the severe cases showed no clinical or sociodemographic risk factor for severe influenza.
Host genetic factors may be a contributor to influenza severity. Two genealogy studies in Utah and Iceland clearly demonstrated familial aggregation of the risk of influenza-associated death [2]. Albright et al. [3] compiled 4855 deaths due to influenza from a Utah database between 1904 and 2004, and observed that the relative risk for relatives dying of influenza was larger than for spouses. Thus, on top of the risk due to cohabitation and shared sociodemo-graphic and environmental factors, the authors concluded that the risk of dying from influenza is heritable. On the contrary, in the 1918 influenza epidemic in Iceland [4], the 455 deaths showed no increased risk for the cases' relatives when compared to spouse's relatives. Notice that the sample in the Icelandic study was an order of magnitude smaller than the Utah sample, and its statistical power was presumably smaller.
Several studies have tackled human genetic variation in relation to influenza. A group of candidate genes includes the pro-inflammatory cytokines and chemokines. Morales-García et al.[5] compared Mexican influenza A patients and matching, co-inhabiting controls and found that single nucleotide polymorphisms (SNPs) in theTNFandLTAgenes contributed to developing the disease, with an OR as high as 27 (95% CI 3–1248) for rs361525AA in
TNF. This allele was also found to be associated with influenza A in Greek patients, and in particular with those developing pneumonia (OR 3.74, 95% CI 1.06–13.25)[6]. However, it was not associated with fatal influenza (regardless of type, and accumulated over 10 influenza seasons) in 105 US children and young adults [7]. Another candidate gene is the interferon-inducible transmembrane proteinIFITM3, which was shown to be essential against the influ-enza A virus in micein vivo. A sample of 53 severe UK patients showed higher frequencies of the minor allele in anIFITM3SNP, namely rs12252, compared to population databases com-prising 3,000–9,000 individuals [8]. Moreover, genetic variation around this SNP revealed the footprints of recent, positive natural selection in Europeans but not in Asians or Africans [8].
A genome-wide association study (GWAS) indicated the complement regulatory protein
CD55as a possible candidate for severe A influenza [9]; indeed, genotype rs2564978T/T in
CD55showed an OR = 1.75 (P = 0.011) in 177 severe vs. 248 mild Chinese A(H1N1) cases [9]. Finally, a GWAS was also performed in 91 severe Mexican patients vs. 98 exposed but asymptomatic controls [10], by using an array designed for genes related with cardiovascu-lar diseases. Four genome regions were identified as putative candidates to contribute to infectivity and/or severity; these regions contained genes for the immunoglobulin-related
FCGR2A, theRPAinteracting protein, and the complement-bindingC1QBPprotein, with ORs up to 2.63.
The goal of the present study is to explore the existence of major genetic determinants of influenza A(H1N1) severity by comparing the genotypes of a dense array of genomewide SNPs in 49 severe and 107 mild influenza patients from Spain, and in a general population sample of 549 individuals. To the best of our knowledge, this is the first attempt to analyze genetic factors associated to influenza infection in a population of European ancestry.
Material and Methods
Samples
Cases were defined as confirmed influenza A(H1N1)2009 patients who had to be admitted to a hospital. Genotypes were successfully obtained for 49 cases (27 from the Hospital Clínico de Valladolid, 17 from Hospital Ramón y Cajal, Madrid, and 5 from Hospital Virgen del Camino, Pamplona, all in Spain; 27 were women). Controls were also confirmed influenza patients with mild symptoms who received ambulatory assistance; they were recruited as part of the Spanish Influenza Case-Control Study cohort during the 2009–2010 first epidemic season of the new virus. 107 controls (56 women) were successfully genotyped: 28 originated from the PIDIRAC primary care influenza network in Catalonia, and 79 from the Red Centinela and Hospital Clínico in Valencia. Additionally, a sample from the general population was used in some com-parisons. It consisted of 549 DNA samples from subjects that self-reported having at least two generations of ancestors born in Spain and without personal or familiar history of chronic dis-eases. These individuals were obtained from the CeGen-PRB2-ISCIII project, and consisted of unrelated healthy adult individuals collected from diverse geographic locations of Spain by Fundacion Publica Galega de Medicina Xenomica. Appropriate written informed consent was obtained from all participants in this study, which was approved by the Clinical Research Eth-ics Committee-Parc de Salut Mar, Barcelona.
Influenza A virus detection and sample genotyping
Samples were divided into two aliquots to extract DNA and RNA separately. To extract DNA, samples were first incubated for an hour with a lysis buffer plus proteinase K to digest the cells membranes, followed by a standard phenol-chloroform purification and ethanol precipitation. RNA was extracted by incubating first with TRIzol reagent (phenol/guanidine isothiocyanate), then adding chloroform followed by a centrifugation step to recover the aqueous phase. We then incubated this with isopropanol for an hour followed by centrifugation and ethanol wash. Finally, the RNA pellet was diluted in RNase-free water. The WHO RT-PCR protocol [11] was followed to confirm infection by influenza A (H1N1)2009 virus.Samples were genotyped with the Affymetrix Axiom Genome-Wide Human CEU
Array, which contains 587,353 genome-wide SNPs and indels.
Statistical analyses
Genotypes were called with the Affymetrix Power Tools 1.14.4 provided by the manufacturer; all samples were analyzed together to avoid array biases. A total of 156 samples (49 cases of influenza A and 107 mild cases) passed the quality controls suggested by the manufacturer. In addition, SNPs that failed in more than the 5% of samples were discarded, with 547,296 SNPs remaining. Allele frequencies have been deposited in GWAS Central as study HGVST1832 (http://www.gwascentral.org/study/HGVST1832) and in the figshare repository (http://dx.doi. org/10.6084/m9.figshare.1528227)
Spain) were used as controls. The significance threshold for multiple test correction was set at 5×10⁻⁸, as suggested by [13]
Population stratification was estimated with two approaches: identity-by-state among indi-viduals was computed with PLINK 1.07 and subsequently plotted with multidimensional scal-ing. Independently, a Bayesian approach to population stratification with Admixture 1.22 [14] was also used. Graphical representations of results were made using the R language [15]
Results
Population structure analysis using identity by state revealed a number of potential outliers: eight samples of severe influenza, 17 cases of mild influenza, and eight controls (Fig 1), which were removed from association analyses. ADMIXTURE analysis (S1 Fig) did not show any dis-cernible pattern, and the optimal number of parental populations was K = 1, implying that cases and controls can be considered as having been sampled from the same population.
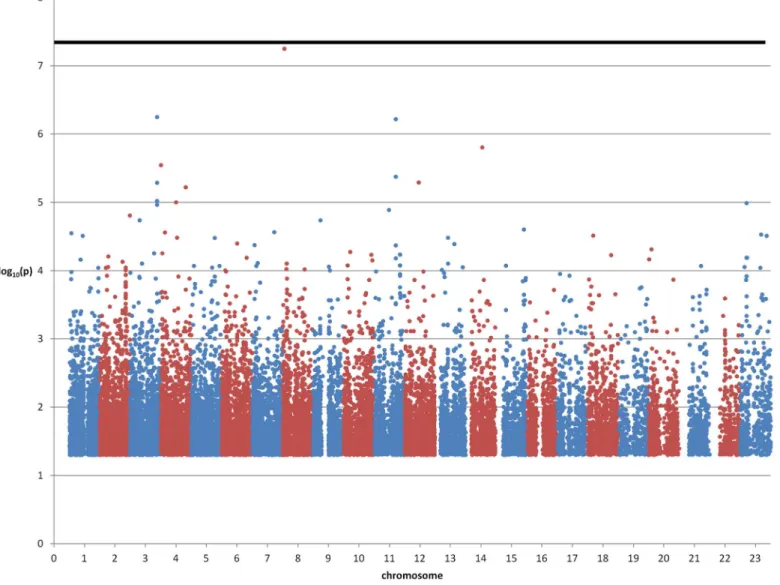
The genome-wide association study between severe influenza A (41 cases) and mild influ-enza A (90 cases) revealed one SNP (rs28454025) slightly above multiple-testing significance level (unadjusted p = 5.595x10⁻⁸; the OR could not be computed since minor allele frequencies were 0.1579 in cases but 0 in controls) as shown inFig 2. This SNP is located in an intron of
Fig 1. Multidimensional scaling based on identity by state distances among severe influenza cases, mild influenza cases, and a general population sample.
theSGK223gene (homolog of rat pragma of Rnd2), which seems to regulate neurite outgrowth.
In addition, 10 SNPs had p<10−5(S1 Table). Three of these SNPs were in introns of
NAA-LADL2(N-acetylated alpha-linked acidic dipeptidase-like 2), at a maximum distance of 67.9 Kb between each other. This gene has been associated with, among other diseases, systemic lupus erythematosus[16] and Kawasaki’s disease[17], both autoimmune disorders. Two other SNPs were in introns ofMAML2(mastermind-like 2 (Drosophila)), a member of the Notch developmental pathway, and apparently unrelated to the immune function. We also found a 14-Kb block of 16 SNPs in thePARD3Bgene (par-3 partitioning defective 3 homolog B (C. ele-gans), involved in neurodevelopment) with p<10−3. The SNPs in this block had odd ratios between 2.1 and 2.9 and were ~1.4Mb downstream fromCTLA4, a costimulatory molecule expressed by activated T cells that has been linked to a number of autoimmune diseases.
Next, we considered a subset of SNPs that were in candidate genes that had been previously associated with influenza A severity [8–10]. Unfortunately, none of the SNPs that had been previously associated were in the array we genotyped; therefore, we selected the SNPs that were
Fig 2. Manhattan plot of severe vs. mild influenza cases. Only p-values<0.05 are shown. The thick horizontal line denotes p = 5×10⁻⁸.
within 100 Kb of the previously associated SNPs. Note that we applied a hypothesis-specific Bonferroni correction, taking into account the number of proxy SNPs (ranging from 2 to 52) we found for each previously associated SNPIFITM3is the gene that has been most consis-tently associated with response to influenza A [8]; and, in particular, the rs12252 SNP. Our array contained 27 SNPs in the vicinity, and only one, namely rs4131943, had a nominally sig-nificant association with influenza A severity (p = 2.1×10⁻³, OR = 2.60 95% CI 1.40
–4.83); note that the hypothesis-specific number of tests was 27, and that the multiple testing correction would yield p = 0.0567. ForCD55[9], within 100 Kb of the reported SNP, only two SNPs were available in our array, one of which, rs2564978, was significantly associated with influenza severity (p = 0.00638, OR = 7.11, 95% CI 1.4–36). Out of 11 SNPs in the vicinity ofFCGR2A
[10], only one had a nominally significant association with influenza severity (rs7551957, p = 0.0288), which did not survive Bonferroni correction. For the SNPs in theRPAIN-C1QBP
region, out of 52 SNPs in the vicinity, only two had p<0.05, with the smallest value (p = 0.0203,
corresponding to rs28447573, which was not the closest to any of the two previously associated SNPs) far from surviving Bonferroni correction. In summary, we indirectly replicated the associ-ation forCD55, that forIFITM3was close to significance, and we could not indirectly replicate the previous associations forFCGR2A,RPAIN, andC1QBP.
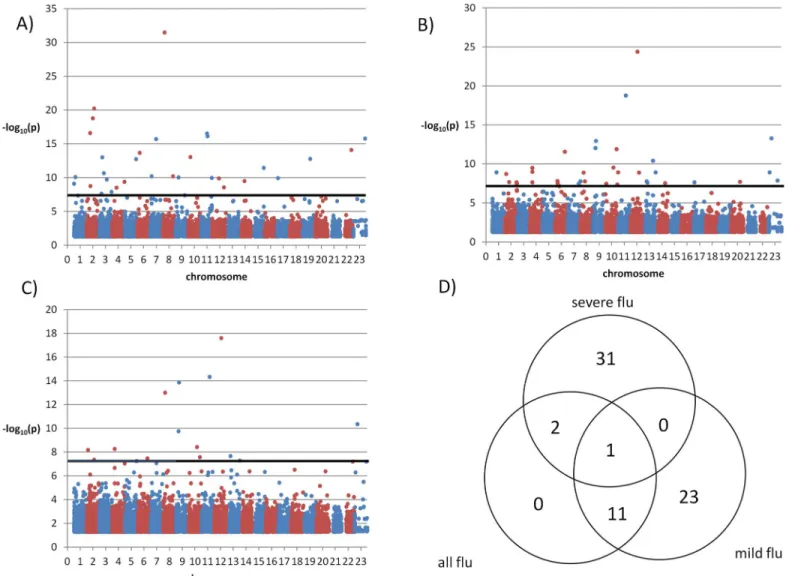
We also compared the two sets of influenza patients to the general population (S2–S4 Tables) and, given the larger sample size of the control population, more SNPs yielded signifi-cant association tests (Fig 3). In the GWAS of severe influenza A against the general population 34 SNPs had p<5×10⁻⁸and were in Hardy-Weinberg equilibrium (p>0.05) (Fig 3A). In the analysis of mild influenza A against the general population 35 SNPs (Fig 3B) met the same con-ditions, and in the analysis of all influenza cases against the general population 14 SNPs had significant differences (Fig 3C). Out of these SNPs, 31 were specific of severe influenza A cases and 23 of mild influenza A cases (Fig 3D). The 34 SNPs detected in the comparison between severe influenza cases and the general population comprised 16 intergenic SNPs, 14 intronic SNPs, two synonymous SNPs, and two nonsynonymous SNPs: rs11551002 in geneAPLP1
(amyloid precursor-like protein 1, involved in neural function), and rs11216131 inBUD13, which participates in the regulation of serum lipid levels.
Next, we turned to the 49 genes that contained or were adjacent to the 34 SNPs with signifi-cant differences between severe cases and the general population (S2 Table). We screened their definitions in the Refseq database and their biological functions according to GO categories for involvement in immunity and inflammation, and the Genetic Association Database and CDC HuGe Published Literature for associations with autoimmune and inflammatory diseases. SNP rs1996377 was 3.09 Mb downstream fromDPP10, which is associated with asthma [18]; and rs28447319 was 51.8 Kb upstream ofB4GALT1, which is upregulated by proinflammatory TNFα[19].
Discussion
In a GWAS for genetic contributors to the severity of influenza A infection, we did not find any SNP with p<5×10⁻⁸; the SNP with the lowest p-value (and one order of magnitude smaller than the next most associated SNP) was rs28454025, which lies in an intron of theSGK223
Previous studies had produced a number of SNPs that were associated with influenza infec-tion or severity. None of those were contained in the array we genotyped, but, by using as prox-ies SNPs in the genomic vicinity, we indirectly replicated the association withCD55, while
IFITM3was close to statistical significance.
When we compared the severe influenza A cases with a much larger sample of the general population, 34 SNPs had significant allele frequency differences (p<5×10⁻⁸) However, the bio-logical plausibility of most of these associations was tenuous (e.g. SNPs with distances>100
Kb from the closest gene, or in or near genes with biological functions unlikely to be related to inflammation or immunity).
Sample sizes in our study were low: 41 severe and 90 mild influenza A cases. Still, it has suf-ficient statistical power to rule out common genetic variants as highly penetrant contributors to poor prognosis in influenza A infection. The prevalence of severe influenza A among influ-enza A cases without obvious risk factors was estimated as 0.26% in a Spanish population[22]. We used this figure and Genetic Power Calculator [23] to estimate that our study had 0.415
Fig 3. Manhattan plots of a general population sample vs.(A) severe influenza cases; (B) mild influenza cases and (C) all influenza cases. Only p-values<0.05 are shown. (D): Venn diagram of SNPs with significant associations with p<5×10⁻⁸when comparing severe influenza cases, mild influenza cases or all influenza cases to a general population sample.
power to detect a recessive variant with an allele frequency of 0.2 and an odds ratio of 25 with α= 5×10⁻⁸and a dominant model; for a recessive model, power increased to 0.805. Admit-tedly, these parameters imply a penetrance sufficiently high so as that familial aggregation of non-cohabiting relatives may have been observed. In particular, in these conditions the relative risk for a sibling would be 1.562 in the dominant model and 2.404 in the recessive model.
In conclusion, our study did not detect what was powered to find, namely one or a few host genes with a major impact in poor influenza course. However, this does not rule out the pres-ence of genes with a more limited contribution.
Supporting Information
S1 Fig. Population stratification analysis from K = 2 to K = 5.Top left, coefficient of varia-tion for each K value.
(PPTX)
S1 Table. SNPs with association p-values<10−5when comparing mild and severe influenza cases.Only rs16954376 remained significant after Bonferroni correction.
(XLSX)
S2 Table. SNPs with significant association p-values (p<5×10⁻⁸) when comparing severe influenza cases against a sample of the general population.
(XLSX)
S3 Table. SNPs with significant association p-values (p<5×10⁻⁸) when comparing mild influenza cases against a sample of the general population.
(XLSX)
S4 Table. SNPs with significant association p-values (p<5×10⁻⁸) when comparing all influenza cases against a sample of the general population.
(XLSX)
Acknowledgments
Castilla y León), V. Martín (CIBERESP, Universidad de León), A. Molina (Instituto de Biome-dicina, Universidad de León), J. Ortiz de Saracho (Hospital del Bierzo), R. Ortiz de Lejarazu (Centro Nacional de Gripe, Valladolid), A. Pueyo, J.L. Viejo (Complejo Asistencial, Burgos), P. Redondo (Servicio Territorial de Sanidad y Bienestar Social, León).Catalonia: A. Agustí, A. Torres, A. Trilla, A. Vilella (Hospital Clínic de Barcelona), J. Alonso, O. Garín (CIBERESP, Universitat Pompeu Fabra, IMIM-Instituto Recerca Hospital del Mar), F. Barbé (Hospital Arnau de Vilanova), M. Baricot, N. Soldevila (CIBERESP), L. Blanch, G. Navarro (Hospital de Sabadell), X. Bonfill, J. López-Contreras, V. Pomar, M.T. Puig (Hospital de Sant Pau), E. Bor-ràs, A. Martínez, Núria Torner (Dirección General de Salud Pública, Generalitat de Catalunya), C. Bravo, F. Moraga (Hospital Vall d'Hebrón), F. Calafell (Universitat Pompeu Fabra), J. Caylà, C. Tortajada (Agencia de Salud Pública de Barcelona), À. Domínguez (CIBERESP, Universitat de Barcelona), I. Garcia, J. Ruiz (Hospital Germans Trias i Pujol), J.J. Garcia (Hospital Sant Joan de Deu), (Universitat Pompeu Fabra), J. Gea, J.P. Horcajada (Hospital del Mar), P. Godoy (CIBERESP, Departament de Salut Generalitat de Catalunya), N. Hayes (Hospital Clínic-CRE-SIB), T. Pumarola (REIPI, Universitat de Barcelona), A. Rosell (Hospital de Bellvitge), M. Sáez (CIBERESP, Universitat de Girona).Madrid: Carlos Álvarez, M. Enríquez, F. Pozo (Hospital 12 de Octubre), J. Astray (Subdirección de Vigilancia, Comunidad de Madrid), F. Baquero, R. Cantón, J. C. Galán (CIBERESP, Hospital Ramón y Cajal), A. Robustillo, M.A. Valdeón (Hos-pital Universitario Ramón y Cajal), E. Córdoba, F. Domínguez, J. García, R. Génova, E. Gil, S. Jiménez, M.A. Lopaz, J. López, F. Martín, M.L. Martínez, M. Ordobás, E. Rodríguez, S. Sánchez, C. Valdés (Area de Epidemiología de la Comunidad de Madrid), J.R. Paño, M. Romero (Hos-pital Universitario La Paz),.Navarra: J. Castilla (CIBERESP, Instituto de Salud Pública de Navarra), P. Fanlo, F. Gil, V. Martínez Artola, M. Ruiz (Complejo Hospitalario de Navarra), J. Gamboa, F. Pérez-Afonso M. Sota, M.E. Ursua, M.T.Virto (Red de Médicos Centinela, Navarra), A. Martinez, L. Martínez (Instituto de Salud Pública, Navarra).Basque Country: U. Aguirre, A. Caspelastegui, P.P. España, S. García (Hospital Galdakao), J. Alustizac (Hospital Mendaro), J.M. Antoñana, I. Astigarraga, J.I. Pijoan, I. Pocheville, M. Santiago, J.I. Villate (Hospital de Cruces), J. Arístegui, A. Escobar, M.I. Garrote (Hospital Basurto), A. Bilbao, C. Garaizar (Fundación Vasca de Innovación e Investigación Sanitarias), G. Cilla, J. Korta, E. Pérez Trallero, C. Sarasqueta (Hospital Donostia), F. Esteban, J.L. Lobo, C. Salado, E. Tato (Hospital Txagorritxu), J.M. Quintana (CIBERESP, Fundación Vasca de Innovación e Investi-gación Sanitarias).
Author Contributions
Conceived and designed the experiments: KGE FGC FC. Performed the experiments: MAB IQ NB MGG. Analyzed the data: KGE FC. Contributed reagents/materials/analysis tools: JCG TP JC ROdL MRD AD FGC. Wrote the paper: KGE FGC FC.
References
1. Gonzalez-Candelas F, Astray J, Alonso J, Castro A, Canton R, Galan JC, et al. Sociodemographic fac-tors and clinical conditions associated to hospitalization in influenza A (H1N1) 2009 virus infected patients in Spain, 2009–2010. PLoS One. 2012; 7: e33139. doi:10.1371/journal.pone.0033139PMID: 22412995
2. Horby P, Nguyen NY, Dunstan SJ, Baillie JK. The role of host genetics in susceptibility to influenza: a systematic review. PLoS One. 2012; 7: e33180. doi:10.1371/journal.pone.0033180PMID:22438897
3. Albright FS, Orlando P, Pavia AT, Jackson GG, Cannon Albright LA. Evidence for a heritable predispo-sition to death due to influenza. J Infect Dis. 2008; 197: 18–24. doi:10.1086/524064PMID:18171280
1918. Proc Natl Acad Sci U S A. 2008; 105: 1303–1308. doi:10.1073/pnas.0707659105PMID: 18216264
5. Morales-Garcia G, Falfan-Valencia R, Garcia-Ramirez RA, Camarena A, Ramirez-Venegas A, Castille-jos-Lopez M, et al. Pandemic influenza A/H1N1 virus infection and TNF, LTA, IL1B, IL6, IL8, and CCL polymorphisms in Mexican population: a case-control study. BMC Infect Dis. 2012; 12: 299. doi:10. 1186/1471-2334-12-299PMID:23148654
6. Antonopoulou A, Baziaka F, Tsaganos T, Raftogiannis M, Koutoukas P, Spyridaki A, et al. Role of tumor necrosis factor gene single nucleotide polymorphisms in the natural course of 2009 influenza A H1N1 virus infection. Int J Infect Dis. 2012; 16: e204–8. doi:10.1016/j.ijid.2011.11.012PMID: 22269998
7. Ferdinands JM, Denison AM, Dowling NF, Jost HA, Gwinn ML, Liu L, et al. A pilot study of host genetic variants associated with influenza-associated deaths among children and young adults. Emerg Infect Dis. 2011; 17: 2294–2302. doi:10.3201/eid1712.111002PMID:22172537
8. Everitt AR, Clare S, Pertel T, John SP, Wash RS, Smith SE, et al. IFITM3 restricts the morbidity and mortality associated with influenza. Nature. 2012; 484: 519–523. doi:10.1038/nature10921PMID: 22446628
9. Zhou J, To KK, Dong H, Cheng ZS, Lau CC, Poon VK, et al. A functional variation in CD55 increases the severity of 2009 pandemic H1N1 influenza A virus infection. J Infect Dis. 2012; 206: 495–503. doi: 10.1093/infdis/jis378PMID:22693232
10. Zúñiga J, Buendia-Roldan I, Zhao Y, Jimenez L, Torres D, Romo J, et al. Genetic variants associated with severe pneumonia in A/H1N1 influenza infection. Eur Respir J. 2012; 39: 604–610. doi:10.1183/ 09031936.00020611PMID:21737555
11. WHO. CDC protocol of realtime RTPCR for influenza A (H1N1). World Health Organization; Available: http://www.who.int/csr/resources/publications/swineflu/realtimeptpcr/en/.
12. Purcell S, Neale B, Todd-Brown K, Thomas L, Ferreira MA, Bender D, et al. PLINK: a tool set for whole-genome association and population-based linkage analyses. Am J Hum Genet. 2007; 81: 559–75. doi: 10.1086/519795PMID:17701901
13. Johnson RC, Nelson GW, Troyer JL, Lautenberger JA, Kessing BD, Winkler CA, et al. Accounting for multiple comparisons in a genome-wide association study (GWAS). BMC Genomics. 2010; 11: 724. doi:10.1186/1471-2164-11-724PMID:21176216
14. Alexander DH, Novembre J, Lange K. Fast model-based estimation of ancestry in unrelated individuals. Genome Res. 2009; 19: 1655–1664. doi:10.1101/gr.094052.109PMID:19648217
15. R core team. R: A Language and Environment for Statistical Computing. Vienna, Austria: R Founda-tion for Statistical Computing; 2012.
16. Chung SA, Taylor KE, Graham RR, Nititham J, Lee AT, Ortmann WA, et al. Differential genetic associa-tions for systemic lupus erythematosus based on anti-dsDNA autoantibody production. PLoS Genet. 2011; 7: e1001323. doi:10.1371/journal.pgen.1001323PMID:21408207
17. Burgner D, Davila S, Breunis WB, Ng SB, Li Y, Bonnard C, et al. A genome-wide association study identifies novel and functionally related susceptibility Loci for Kawasaki disease. PLoS Genet. 2009; 5: e1000319. doi:10.1371/journal.pgen.1000319PMID:19132087
18. Rogers AJ, Raby BA, Lasky-Su JA, Murphy A, Lazarus R, Klanderman BJ, et al. Assessing the repro-ducibility of asthma candidate gene associations, using genome-wide data. Am J Respir Crit Care Med. 2009; 179: 1084–90. doi:10.1164/rccm.200812-1860OCPMID:19264973
19. Radhakrishnan P, Chachadi V, Lin M-F, Singh R, Kannagi R, Cheng P-W. TNFαenhances the motility
and invasiveness of prostatic cancer cells by stimulating the expression of selective glycosyl- and sulfo-transferase genes involved in the synthesis of selectin ligands. Biochem Biophys Res Commun. 2011; 409: 436–41. doi:10.1016/j.bbrc.2011.05.019PMID:21596021
20. Tanaka H, Katoh H, Negishi M. Pragmin, a novel effector of Rnd2 GTPase, stimulates RhoA activity. J Biol Chem. 2006; 281: 10355–64. doi:10.1074/jbc.M511314200PMID:16481321
21. O’Donnell CJ, Cupples LA, D’Agostino RB, Fox CS, Hoffmann U, Hwang S-J, et al. Genome-wide asso-ciation study for subclinical atherosclerosis in major arterial territories in the NHLBI’s Framingham Heart Study. BMC Med Genet. 2007; 8 Suppl 1: S4. doi:10.1186/1471-2350-8-S1-S4PMID:17903303
22. Esteban-Vasallo MD, Domínguez-Berjón MF, Aerny-Perreten N, Astray-Mochales J, Martín-Martínez F, Gènova-Maleras R. Pandemic influenza A (H1N1) 2009 in Madrid, Spain: incidence and characteris-tics in immigrant and native population. Eur J Public Health. 2012; 22: 792–6. doi:10.1093/eurpub/ ckr171PMID:22158997