Heterologous Expression of the
AtDREB1A
Gene in Transgenic Peanut-Conferred
Tolerance to Drought and Salinity Stresses
Tanmoy Sarkar, Radhakrishnan Thankappan*, Abhay Kumar, Gyan P. Mishra, Jentilal Ramjibhai Dobaria
Crop Improvement Division, Directorate of Groundnut Research, Junagadh, Gujarat, India
Abstract
Research on genetic transformation in various crop plants using theDREB1A
transcription factor has shown better abiotic stress tolerance in transgenic crops. TheAtDREB1A transgenic peanut (Arachis hypogaeaL. cv. GG 20), which was previously developed, was characterized in terms of its physio-biochemical, molecular and growth parameters. The tolerance of this transgenic peanut to drought and salinity stresses was evaluated at the seedling (18 days old) and maturity stages. Transgenic peanut lines showed improved tolerance to both stresses over wild-type, as observed by delayed and less severe wilting of leaves and by improved growth parameters that were correlated with physio-biochemical parameters such as proline content, total chlorophyll content, osmotic potential, electrolytic leakage and relative water content. The expression pattern of the
AtDREB1A gene evaluated using qPCR at different time points demonstrated that transgene expression was induced within two hours of stress imposition. The better performance of transgenic AtDREB1Apeanut at the seedling stage and the improved growth parameters were due to the expression of the transgene, which is a transcription factor, and the possible up-regulation of various stress-inducible, downstream genes in the signal transduction pathway under abiotic stress.
Introduction
Peanut, or groundnut (Arachis hypogaea L.), is an important oil-yielding, leguminous cash crop, which is cultivated in the semi-arid tropical and sub-tropical regions of the world between 40
˚
N and 40˚
S [1]. The crop is generally cultivated in low-input farming systems, primarily in the developing countries of OPEN ACCESSCitation:Sarkar T, Thankappan R, Kumar A, Mishra GP, Dobaria JR (2014) Heterologous Expression of theAtDREB1AGene in Transgenic Peanut-Conferred Tolerance to Drought and Salinity Stresses. PLoS ONE 9(12): e110507. doi:10.1371/journal.pone.0110507
Editor:Jin-Song Zhang, Institute of Genetics and Developmental Biology, Chinese Academy of Sciences, China
Received:June 2, 2014
Accepted:September 16, 2014
Published:December 29, 2014
Copyright:ß2014 Sarkar et al. This is an open-access article distributed under the terms of the Creative Commons Attribution License, which permits unrestricted use, distribution, and repro-duction in any medium, provided the original author and source are credited.
Data Availability:The authors confirm that all data underlying the findings are fully available without restriction. All relevant data are within the paper and its Supporting Information files.
Funding:This work was funded by the Indian Council of Agricultural Research, New Delhi, India, under the project entitled ‘‘ICAR Network Project on Transgenic Crops.’’ The funders had no role in study design, data collection and analysis, decision to publish, or preparation of the manuscript.
Africa and Asia [2]. Across the world, it is cultivated over approximately 20–25 million ha in total, yielding 35–40 million tons of pods annually. India, the second largest peanut producer in the world, cultivated approximately 5–6 million ha, yielding 6–7 million tons of pods, during 2011–2012 [3,4]. Water-deficit and soil-salinity conditions are considered to be complex abiotic stresses that affect both the growth and productivity of peanut crops [5] by disturbing the integrity of plant membrane, pigment content, osmotic adjustments, water retention capacity and photosynthetic activity [6–9].
Approximately 70% of the global peanut-growing areas are located in semi-arid regions, where drought is a key environmental constraint limiting peanut production. According to a recent estimate, global peanut productivity incurred an annual loss of approximately 6 million tons due to drought alone [2]. Similarly, the global salinity-affected area is approximately 830 million ha [10]. In India alone, salinity affects approximately 7.61 million ha [11], an issue that deserves major attention. Ensuring food security for the burgeoning world population is nearly impossible without considerably increasing the crop
production in such marginal areas of the world [12]. It is therefore necessary to develop abiotic stress-tolerant peanut varieties that can be cultivated in the vast drought-prone and salinity-affected areas of the world [13,14].
Because abiotic stress tolerance is a polygenic trait, developing abiotic stress-tolerant varieties through traditional breeding approaches is a difficult task. Not only that, very limited success in the genetic improvement of cultivated peanuts through conventional and marker-assisted breeding methods is also attributed mainly to the genetic isolation of the tetraploid (or amphidiploid) peanut from its wild diploid ancestors and highly conserved genome with very low polymorphism [15,16].
Moreover, molecular breeding approaches are not widely attempted due to the difficulty in foreground and background selections. Linkage drag and only minor quantitative trait loci (QTLs) are reported for improved water use efficiency and its components [2,17]. Ultimately, a transgenic approach could be a viable option to address this problem [18]. Globally, transgenic work for abiotic stress tolerance involves mostly the crops having cash market such as rice, maize, tomato or tobacco. Although peanut is quite critical to the livelihoods of over 650 million most food-insecure poor people living in the dryland areas of Africa and South Asia but this grain legume is not very ‘‘attractive’’ to the private sector industries [2].
The complex nature of drought and salinity responses likely involves different gene expression which could be regulated using genes encoding transcription factors (TFs) controlling gene expression under abiotic stress conditions [19,20]. One interesting approach could be based on genetic modification of the crop of interest by introducing stress tolerance genes such as TFs, as single-action genes may not be sufficient to confer the desired abiotic stress tolerance [20].
Dehydration-responsive element-binding proteins (DREBs) are one of the most important classes of TFs, which are transcriptionally up-regulated during abiotic stress imposition [21]. TFs recognize a specific DNA sequence in the promoter
Abiotic Stress Tolerance inAtDREB1ATransgenic Peanut
region of targeted stress responsive genes and activate the expression of those genes [22]. The DREBs, which belong to the group of ethylene responsive factors (ERF), are involved in the regulation of signal transduction pathways under low temperature, salinity and dehydration conditions [8,23–25].
AtDREB1A, a class of DREBfromArabidopsis thaliana, recognizes dehydration responsive elements/C-repeat elements (DRE/CRT) of the promoters of many downstream stress-inducible genes under various abiotic stresses [19,26–27]. Transgenics over-expressing the DREBgroup of TFs is an efficient tool for regulating the expression of many abiotic stress-responsive genes [8,18,19] and it have been reported to enhance the tolerance in various crops [2,28–30]. Breeding efforts to improve the drought tolerance in peanut have been undertaken by mostly focusing on improving the water use efficiency, whereas for salinity tolerance not much is reported [31–32].
Available reports on AtDREB1Atransgenic peanuts have used a Spanish-type cultivar named JL 24 [5,33–34], which has been phased out of cultivation in India. Here, we characterize a transgenic peanut with theAtDREB1Aheterologous transgene, under the control of the stress-inducible rd29A promoter, for its tolerance to drought and salinity stresses. We utilized the Virginia Bunch variety GG20, which is high yielding, bold-seeded, and one of the most widely grown varieties in India.
Materials and Methods
Plant Materials
Homozygous lines of three single-copy transgenic events in the T2generation (viz.
D1, D2 and D3) of the peanut cv. GG 20, developed using Agrobacterium tumefaciensmediated genetic transformation [35], were used for the experiments.
Imposition of Drought and Salinity Stresses
To evaluate tolerance to polyethylene glycol (PEG)-induced drought stress and NaCl-induced salinity stress, the physio-biochemical parameters under laboratory conditions and growth-parameters under glasshouse conditions (containment facility) were studied for both transgenic (T) and wild-type (WT) lines. The seeds were sown in a soil-sand mix (1:1), and the 15-day-old plants were transferred to Hoagland’s solution and kept in an incubation room for 3 d at 28
˚
C for adaptation and further growth. The experiment was conducted in three replicates and data was recorded for three plants per replication. Water deficit stress and salinity stress were created by supplementing the Hoagland’s solution with 0, 10, 15, 20% PEG or 0, 100, 150 and 200 mM NaCl. The plants were grown for 7 d under water deficit stress in PEG-supplemented medium and for 12 d under salinity stress in NaCl-supplemented medium.for recovery to normal physiological conditions. After recovery, the plants were transferred to earthen pots containing soil-sand mix (1:1), kept in a glasshouse, and grown to maturity. During the stress treatments and recovery period in Hoagland’s solution, visual observations were made to compare the severity of the wilting of leaves and the rate of recovery of the T and WT lines.
Analysis of Growth Parameters
The growth parameters including shoot length, root length and root volume were recorded at maturity after harvesting (approximately 115–120 days after sowing). When the plants were completely dried, traits including the dry weight of pods, kernel weight, root weight, shoot weight, and total biomass were measured. The harvest index (HI) and root-shoot ratio were calculated thereafter.
Physio-Biochemical Characterization
Physio-biochemical parameters viz. proline content, osmotic potential, relative water content (RWC), electrolytic leakage (EL) and total chlorophyll content were analyzed from the uppermost fully expanded leaves of seedlings that were collected prior to, during and just before removal of the stress.
Electrolytic leakage (EL)
EL was analyzed according to Wang et al. [36] by which fresh leaf discs (1 cm diameter) were washed with distilled water, blotted to dry and placed in 25 mL distilled water under continuous shaking for 2 h. The initial electrical
conductivity (EC1) was measured using a pH/EC/TDS Meter (HI991301, HANNA, USA). The leaf discs were then boiled for 30 min in a water bath and cooled to 25
˚
C, and the final electrical conductivity (EC2) was measured. The percent leakage of electrolytes was calculated using the formula (EC1/EC2)6100%.
Relative water content (RWC)
The RWC of fresh leaf discs (1 cm dia.) from the T and WT plants was measured. First, the fresh weights (FW) of leaf disks were recorded. Next, the pre-weighed discs were floated in water in petri-plates for 8 h, after which the turgid weight (TW) of the hydrated leaf discs was recorded. The leaf discs were then dried in a hot air oven at 80
˚
C for 72 h and weighed until a consistent dry weight (DW) was obtained. RWC was calculated using the formula RWC 5(TW–DW)/(FW–DW)6100, as described by Barrs and Weatherey [37].
Total chlorophyll content
Total chlorophyll content in the leaf tissue was determined using the
dimethylsulfoxide (DMSO) method described by Hiscox and Israelstam [38]. Fifty milligrams of leaf tissue were placed in a plastic vial containing 2 mL DMSO (protected from light) and incubated in a water bath at 65
˚
C for 12 h. Absorbance of the extract was read at 645 and 663 nm using a spectrophotometer, and the total chlorophyll content was calculated as (mg/g FW) 57[(20.26OD645)+Abiotic Stress Tolerance inAtDREB1ATransgenic Peanut
(8.026OD663)] 6V/(10006W), where ‘V’ is the volume of extract and ‘W’ is
the weight of tissue in grams.
Osmotic potential
Osmotic potential was analyzed according to Bhauso et al. [4], with minor modifications. Leaf tissue samples (100 mg) of T and WT plants were first frozen in liquid nitrogen, thawed in 1.5 mL microfuge tubes at room temperature (RT) for 2 h, and then centrifuged at 12000 rpm for 10 min to collect the cell sap. The osmotic potential was estimated using a direct reading Vapor Pressure
Osmometer (WESCOR, Model 5500, USA).
Proline content
The proline content of the leaves was estimated according to Bates et al. [39]. Leaves of WT and T seedlings (100 mg) were homogenized using a mortar and pestle with 5 mL of 3% sulfosalicylic acid and centrifuged at 5000 g for 10– 15 min. The supernatant was collected and diluted to 5 mL with 3% sulfosalicylic acid. Two milliliters of glacial acetic acid and 2 mL acid ninhydrin were added to 2 mL of the supernatant and mixed well. The mixture was boiled in a water bath for 1 h and cooled. Then, 4 mL toluene was added and allowed to stand for 2– 3 min for color development. The absorbance of the solution was recorded spectrophotometrically at 520 nm. A blank containing 2 mL of 3% sulfosalicylic acid without sample was also run simultaneously. The proline content was calculated according to the proline standard (100 mg/mL in 3% sulfosalicylic acid).
Quantitative Expression of the Transgene in Transgenics Exposed
to Drought and Salinity Stresses by qPCR
AtDREB1A gene expressions were analyzed at the transcript level in the leaf samples of all the T lines (D1, D2 and D3) exposed to a water deficit (20% PEG) and salinity stress (200 mM NaCl) for 16 h. Leaf samples were collected at 2 h intervals starting before the imposition of both salinity and drought stresses until the 16thh of stress imposition. Total RNA was extracted using a Quiagen RNeasy kit, and cDNAs were prepared using a first strand cDNA synthesis kit (Fermentas, USA). Then, semi-quantitative RT-PCR was performed in triplicate with gene-specific primers (F: 59-CCT CAG GCG GTG ATT ATA TTC C-39, R: 59-ACG ACC CGC CGG TTT C-39) using a Quantifast SYBR Green PCR Kit (Qiagen, GmbH) and a step one Real-Time PCR system (Applied Biosystems California, USA). The relative quantification of AtDREB1A was normalized with respect to the housekeeping gene 18S rRNA as an internal control using the primers (F: 59 -GGC TCA AGC CGA TGG AAG T-39, R: 59AGC ACG ACA GGG TTT AAC AAG A-39) on the Real-Time PCR system.
Comparative fold expression of the transgene was measured according to the 2 -DDC
Tmethod [8,40], and DCTwas calculated by subtracting 18S rRNA CT from AtDREB1A CT in a given sample. The DCTvalue at t50 h, i.e., before stress
subtracting theDCTof the calibrator from theDCTvalues at different time points.
Each reaction was performed in 20 mL (volume) and consisted of 1x SYBR Green Master mix, 20 pmol of each primer and 100 ng of diluted cDNA template.
Statistical Analysis
Statistical analysis was performed using the mean value and standard error (SE) of three replicates per analysis. Significance of a treatment effect was determined by performing a one-way ANOVA using SPSS 11.0 (Statistical Package For Social Sciences, SPSS Inc., Illinois) and a 5% probability level according to Tukey’s test. The correlation coefficient was determined using PAST (PAlaeontological STatistics, ver. 1.89).
Results and Discussion
Phenotypically, all three T lines (D1, D2 and D3) were found to be similar to WT under controlled conditions, with no growth or developmental abnormality. This indicated that the insertion of the transgene did not disrupt any major
endogenous functional gene(s).
Physio-Biochemical Characterization under Drought and Salinity
Stress
Changes in proline content
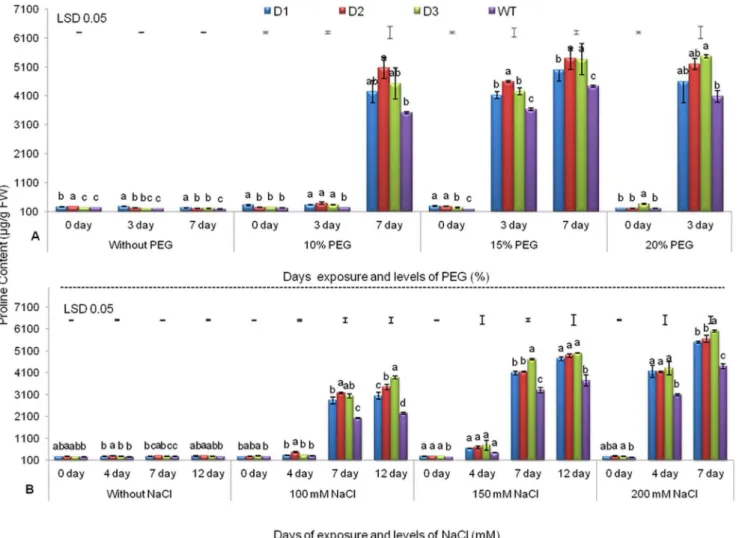
Proline is known to be accumulated under water deficit and salinity stresses [5,7,18] and is thought to protect the plant from cellular dehydration. It is an important component of cell wall proteins, which protect membrane integrity and photosynthetic machinery [18,41]. Under drought stress levels corresponding to 10% and 15% PEG, increases in proline accumulation were recorded on the 7th and 3rdd, respectively. However, at 20% PEG, all three T lines exhibited 11–25% more proline (4598–5463 mg/g FW) on the 3rd d compared to WT (4011mg/g FW) (Fig. 1A). Similar observations have been previously reported in peanut [34] and tomato [41], expressing AtDREB1AandBcZAT12genes, respectively. Similar patterns of proline accumulation were also observed in maize and tall fescue, expressing molybdenum cofactor sulfurase andDREB1A/CBF3 genes, respectively, under drought stress [42,43].
At various levels of NaCl-induced salinity stress (i.e., 100, 150 and 200 mM NaCl), proline content was relatively low up to the 4thd, but drastic increases were observed on the 7th d onwards. However, in T lines, at various salinity levels, significantly higher levels of proline were recorded on the 7th and 12th d. At 200 mM NaCl, on the 7thd, all T lines exhibited 19–26% (5491 to 5997mg/g FW) more proline accumulation than WT (4394 mg/g FW) (Fig. 1B). Significantly higher proline accumulation has also been observed under increasing salinity stress in Populus tomentosa and tobacco, which express AhDREB1 and SbSOS1
transgenes, respectively [7,44].
Abiotic Stress Tolerance inAtDREB1ATransgenic Peanut
Moreover, under both drought and salinity stresses, high levels of proline accumulation were recorded in T compared to WT which may be a major factor responsible for the tolerance of T peanut lines. This could be due to the up-regulation of some endogenous gene(s) by expression of theAtDREB1Atransgene [45,46], although further studies are required to confirm this possibility.
Changes in osmotic potential
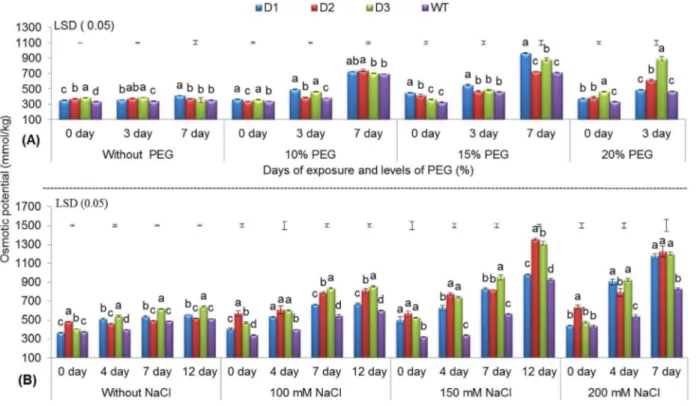
In general, increased osmotic potential under abiotic stress conditions confers plants with a higher water retention capacity, a lower rate of water loss, and higher water use efficiency [47]. Under drought stress, a gradual increase in osmotic potential was recorded, and T peanut lines showed better osmotic adjustment than WT during the 3rdand 7th d of stress imposition. In the T line D3, better osmotic adjustment was apparent, as revealed by the significantly higher osmotic potential compared with the D1 and D2 lines and with WT at 20% PEG on the 3rd
Fig. 1. Proline Content of three transgenic lines and WT.Under various levels of PEG (A) and NaCl (B) with increasing days of stress exposure. Values represent mean activities (n53)¡SE atP50.05. Means followed by the same lower case letters within a column are not significantly different.
d (Fig. 2A). Mackova´ et al. [48] also observed better osmotic adjustment due to the ectopic expression of the CKX1 gene in tobacco.
For NaCl-induced salinity stress (i.e., 100, 150, and 200 mM NaCl), two of the T lines (D2 and D3) showed better osmotic adjustment than WT with increasing NaCl concentration and durations of stress exposure. Overall, the T lines exhibited 31.04 to 41.07% higher osmotic potential than WT on the 4thand 7thd when exposed to 200 mM NaCl (Fig. 2B). This result was supported by the observations made for OsNHX1 and TaSRHPtransgene containing maize [49] and Arabidopsis [9] respectively.
A gradual increase in osmotic potential was observed with increasing PEG and NaCl concentrations for all durations of exposure across all T and WT peanut lines. However, T lines showed better osmotic adjustment than WT under stress conditions by more efficiently increasing their osmotic potential (Fig. 2). An increase in osmotic potential is an effective mechanism adopted by plants that allows them to adapt to environmental constraints by accumulating osmolytes, such as amino acids, quaternary amines, sugar alcohols and various sugars [50].
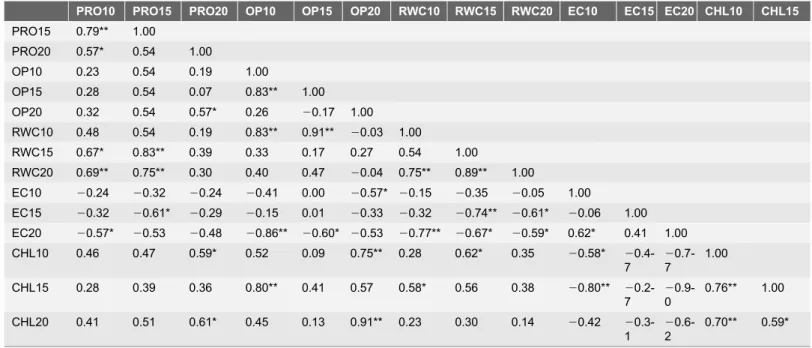
In the present investigation, both osmotic potential and free proline content were elevated with increasing levels of PEG and NaCl-induced stresses. This supports the hypothesis that there was a positive correlation between osmotic potential and proline content at 20% PEG after the 3rdd of treatment (r50.57,
Fig. 2. Osmotic potential of three transgenic lines and WT.Under various levels of PEG (A) and NaCl (B) with increasing days of stress exposure (refer toFig. 1).
doi:10.1371/journal.pone.0110507.g002
Abiotic Stress Tolerance inAtDREB1ATransgenic Peanut
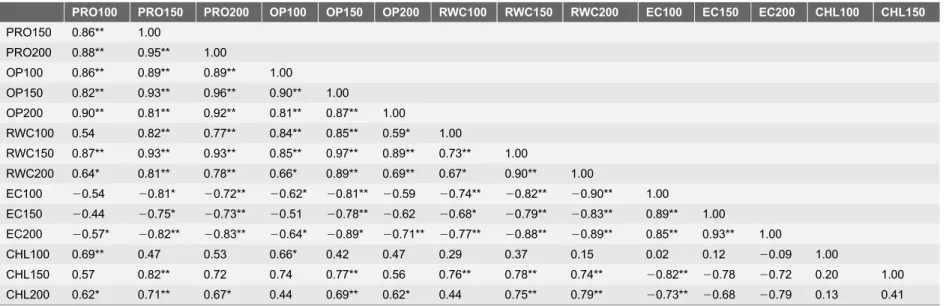
Table 1) and at 150 and 200 mM NaCl after the 7th d of treatment (r.0.90, Table 2). Similar relationships were observed in tomato under water deficit stress [51]. Therefore, free proline accumulation could be one of the reasons for the enhancement in the osmotic potential of both AtDREB1A transgenic and WT peanut plants.
Changes in RWC
Relative water content is a physiological index that is used to evaluate the water retention capacity because it acts as an appropriate parameter to measure water status and osmotic adjustments of plants under abiotic stresses [18,52,53]. It was observed that even under unstressed conditions, the T peanut lines exhibited significantly more RWC than WT. Moreover, with increased durations of drought stress (10, 15 and 20% PEG), a steady decline in RWC was recorded in WT compared to T plants. The WT and the T lines (D1, D2 and D3) showed 20.84, 62.60, 62.09 and 38.09% RWC (at 20% PEG), respectively, on the 3rdd(S1A Fig.).
At 100 mM NaCl, with increased durations of stress, relatively smaller reductions in RWC were observed (in both T and WT). However, a sharp reduction was observed for WT compared with T at 150 mM NaCl on the 7thand 12thd. At higher NaCl (200 mM), on the 7thd, WT and T lines (D1, D2 and D3) exhibited 38.01, 58.61, 48.28 and 61.11% RWC, respectively (S1B Fig.).
Significant positive correlations between osmotic potential and RWC under 10% PEG (r50.83) and 150 mM NaCl (r50.97), were observed after the 3rd d (Table 1) and 7thd of treatment (Table 2). Similarly, Calcagno et al. [54] reported
Table 1.Correlation coefficient (r) between the different physio-biochemical parameters under various concentration of PEG after 3 days of treatments.
PRO10 PRO15 PRO20 OP10 OP15 OP20 RWC10 RWC15 RWC20 EC10 EC15 EC20 CHL10 CHL15 PRO15 0.79** 1.00
PRO20 0.57* 0.54 1.00
OP10 0.23 0.54 0.19 1.00
OP15 0.28 0.54 0.07 0.83** 1.00 OP20 0.32 0.54 0.57* 0.26 20.17 1.00 RWC10 0.48 0.54 0.19 0.83** 0.91** 20.03 1.00
RWC15 0.67* 0.83** 0.39 0.33 0.17 0.27 0.54 1.00
RWC20 0.69** 0.75** 0.30 0.40 0.47 20.04 0.75** 0.89** 1.00
EC10 20.24 20.32 20.24 20.41 0.00 20.57* 20.15 20.35 20.05 1.00
EC15 20.32 20.61* 20.29 20.15 0.01 20.33 20.32 20.74** 20.61* 20.06 1.00 EC20 20.57* 20.53 20.48 20.86** 20.60* 20.53 20.77** 20.67* 20.59* 0.62* 0.41 1.00 CHL10 0.46 0.47 0.59* 0.52 0.09 0.75** 0.28 0.62* 0.35 20.58* 2
0.4-7
2 0.7-7
1.00
CHL15 0.28 0.39 0.36 0.80** 0.41 0.57 0.58* 0.56 0.38 20.80** 2 0.2-7
2 0.9-0
0.76** 1.00
CHL20 0.41 0.51 0.61* 0.45 0.13 0.91** 0.23 0.30 0.14 20.42 2 0.3-1
2 0.6-2
0.70** 0.59*
For each parameter, average values of threeAtDREB1Atransgenic peanut lines along with WT were used. Where: PRO-proline, OP-osmotic potential, RWC-relative water content, EC-electrolytic leakage, CHL-chlorophyll content. The letters indicate the parameters followed by concentration of PEG followed by days of exposure to PEG (e.g. PRO10, Proline content at 10% PEG).* indicates a significant correlation: *P#0.05, and **P#0.01.
Table 2.Correlation coefficient (r) between the different physio-biochemical parameters under various concentration of NaCl after 7 days of treatments.
PRO100 PRO150 PRO200 OP100 OP150 OP200 RWC100 RWC150 RWC200 EC100 EC150 EC200 CHL100 CHL150
PRO150 0.86** 1.00
PRO200 0.88** 0.95** 1.00
OP100 0.86** 0.89** 0.89** 1.00
OP150 0.82** 0.93** 0.96** 0.90** 1.00
OP200 0.90** 0.81** 0.92** 0.81** 0.87** 1.00
RWC100 0.54 0.82** 0.77** 0.84** 0.85** 0.59* 1.00
RWC150 0.87** 0.93** 0.93** 0.85** 0.97** 0.89** 0.73** 1.00
RWC200 0.64* 0.81** 0.78** 0.66* 0.89** 0.69** 0.67* 0.90** 1.00
EC100 20.54 20.81* 20.72** 20.62* 20.81** 20.59 20.74** 20.82** 20.90** 1.00
EC150 20.44 20.75* 20.73** 20.51 20.78** 20.62 20.68* 20.79** 20.83** 0.89** 1.00
EC200 20.57* 20.82** 20.83** 20.64* 20.89* 20.71** 20.77** 20.88** 20.89** 0.85** 0.93** 1.00
CHL100 0.69** 0.47 0.53 0.66* 0.42 0.47 0.29 0.37 0.15 0.02 0.12 20.09 1.00
CHL150 0.57 0.82** 0.72 0.74 0.77** 0.56 0.76** 0.78** 0.74** 20.82** 20.78 20.72 0.20 1.00 CHL200 0.62* 0.71** 0.67* 0.44 0.69** 0.62* 0.44 0.75** 0.79** 20.73** 20.68 20.79 0.13 0.41 For each parameter, average values of threeAtDREB1Atransgenic peanut lines along with WT were used. The letters indicate the parameters followed by concentration of NaCl followed by days of exposure to NaCl (e.g. PRO 100, Proline content at 100mM NaCl) (Refer toTable 1).
doi:10.1371/journal.pone.0110507.t002
Abiotic
Stress
T
olerance
in
AtDREB1A
T
ransgenic
Peanut
PLOS
ONE
|
DOI:10.13
71/journal.p
one.01
10507
December
29,
2014
10
/
a close relationship between osmotic potential and RWC inSolanum lycopersicum
under water deficit stress.
Thus, a steady reduction in RWC was recorded with increasing PEG and NaCl concentrations across T peanut lines, but the reduction was more prominent in WT. This result implies that the T lines could effectively retain more water content in their tissues than WT under increasing durations of both drought and salinity. Similar results have been reported in other transgenic crops, including maize [42], tomato [55] and tobacco [56] for drought stress and tobacco [7] and pigeonpea [57] for salinity stress.
Transgenic rice expressing theAtDREB1A, exhibited closure of its stomata that was correlated with its reduced water loss during transpiration under drought stress compared to WT [8]. Likewise, in our study, T lines retained more RWC, which may be due toAtDREB1Agene expression and its subsequent regulation of stomatal behavior during stress conditions, [8,34] which requires further investigation.
Changes in electrolytic leakage
In a plant system, the cell membrane is one of the first targets of any abiotic stress, and electrolyte leakage generally reflects the membrane’s stability and integrity [52]. A significant increase in electrical conductivity (EC) was recorded in WT on the 7thd (at 10% and 15% PEG) compared to T lines. However, at 20% PEG, on the 3rdd itself, the T lines (D1, D2, and D3) exhibited 14.37 to 32.06% less EC than WT (S2A Fig.). On a similar note, reduced EC in various T plants was observed, indicating the re-establishment of membrane integrity [54,57].
Progressive increases in EC were noted with increased concentrations and durations of salinity exposure across all T and WT lines. On the 7thd at 200 mM NaCl, WT demonstrated 61.89% EC which represents 11.23 to 38.64% higher EC than the T lines (S2B Fig.). Large negative correlations under 15% PEG (r520.95, Table 3) and under 200 mM NaCl (r520.83, Table 2) after the 7thd were observed between electrolyte leakage and proline content, suggesting that proline acts as an antioxidant and helps retain membrane stability. Similarly, a significant
Table 3.Correlation coefficient (r) between the different physio-biochemical parameters under various concentration of PEG after 7 days of treatments.
PRO10 PRO15 OP10 OP15 RWC10 RWC15 EC10 EC15 CHL10 PRO15 0.71** 1.00
OP10 0.44 0.30 1.00
OP15 0.44 0.28 0.99** 1.00
RWC10 0.44 0.68* 0.59* 0.62** 1.00
RWC15 0.44 0.44 0.27 0.28 0.69* 1.00
EC10 20.59* 20.80** 20.63** 20.58* 20.67* 20.67* 1.00
EC15 20.67* 20.95** 20.31 20.26 20.54 20.37 0.84** 1.00
CHL10 0.57* 0.71** 0.68* 0.63* 0.45 0.35 20.90** 20.79 1.00
CHL15 0.42 0.62* 0.80** 0.75** 0.44 0.19 20.80** 20.69 0.93**
For each parameter, average values of threeAtDREB1Atransgenic peanut lines along with WT were used (Refer toTable 1).
negative correlation has been observed between proline content and electrolytic leakage in Brassica juncea under heat stress [58].
AtDREB1Atransgenic peanut lines showed significantly less EC compared to WT. The difference in EC between WT and T lines increased with the progression of drought and salinity stresses. Similar results were also observed in other T plants, including BcZAT12 tomato [55],mtlD eggplant [52] and VTE1 tobacco [56] under dehydration stress and SbSOS1 tobacco [7],MdNHX1apple [59] and
AhCMO cotton [60] under salinity stress.
Changes in total chlorophyll content
Leaf chlorophyll content directly impacts the photosynthetic rate of plants [18]. Osmotic and oxidative stresses generate extensive reactive oxygen species (ROS), which have detrimental effects on both the photosynthetic machinery and the total chlorophyll content of leaves. In addition, under drought stress (at 20% PEG), a significant decrease in chlorophyll was recorded in WT on the 3rdd(S3A Fig.). Chlorophyll reduction under abiotic stress symbolizes osmotic/oxidative stress, which may have resulted from pigment photo-oxidation and chlorophyll degradation [55,61]. Moreover it is also reported that the ectopic expression of various genes (viz.Annexin, VTE1 and mtlD) helps in the retention of a greater chlorophyll content in T under dehydration stress [56,62].
At the various salinity levels, a significant reduction in total chlorophyll in WT compared to T was observed. At 200 mM NaCl, the T line revealed 3.1–8.0% less of a reduction in total chlorophyll than WT on the 7thd (S3B Fig.). It means T lines were able to retain more chlorophyll across various drought and salinity levels, which also implies its better photosynthetic capacities, resulting in improved HI. Likewise, transgenic PeDREB2tobacco, mtlD eggplant and mtlD
peanut also showed less chlorophyll reduction under salinity stress [4,63,64]. Proline, which acts as a powerful scavenger of free radicals in plant metabolism, has a buffering capacity with redox potential, in addition to protecting the photosynthetic pigments [18,41]. Thus, a significant increase in proline content in the AtDREB1Alines compared with WT may also be one reason for higher chlorophyll retention in T under both salinity and drought stresses (Table 3, 4), although this idea requires further confirmation.
Physio-biochemical parameters, such as proline content, osmotic potential, RWC and chlorophyll content, were positively correlated, whereas electrolytic leakage was negatively correlated in T and WT peanuts under both drought and salinity stresses (Tables 1,2).
Variation in the Levels of the Physio-Biochemical Response
Among T- lines, significantly different levels of physio-biochemical responses were observed under both salinity and water deficit stresses, which may be due to a positional difference of the transgene integration into the T-line genome [65–67]. Similar types of variations have also been observed in the level of tolerance to abiotic stress, transgene expression, agronomic traits, dry-matter weight and mannitol accumulation in various T plants [4,8,68]. Moreover, factors such as
Abiotic Stress Tolerance inAtDREB1ATransgenic Peanut
the tissue culture regime may have conferred a positive pleiotropic effect in T peanut, and/or differential regulation of stress responsive genes under the influence of the AtDREB1Atranscription factor may have caused the improved
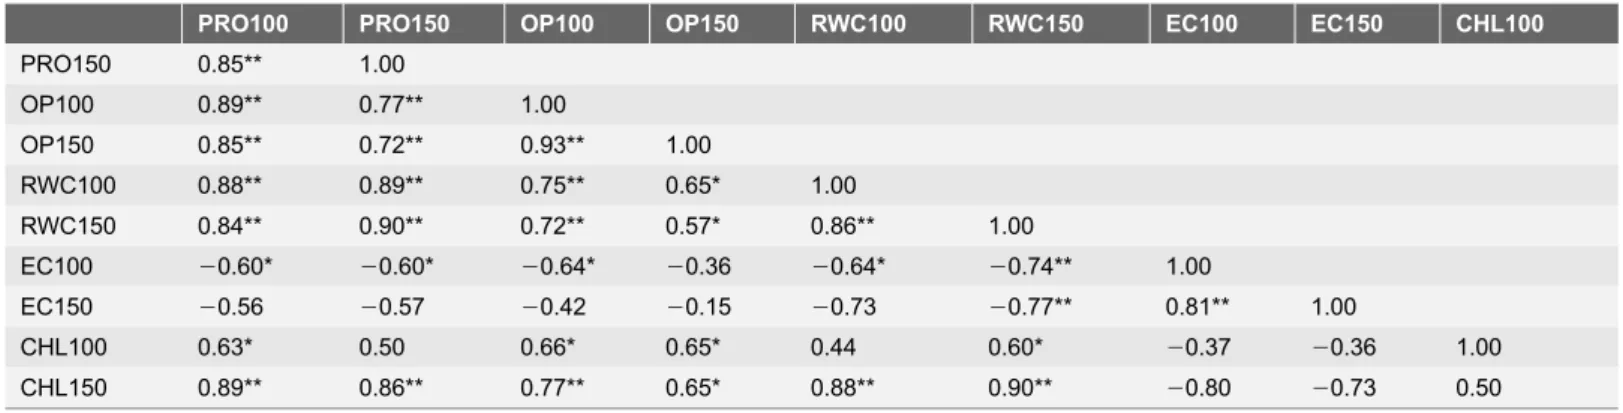
Table 4.Correlation coefficient (r) between the different physio-biochemical parameters under various concentration of NaCl after 12 days of treatments.
PRO100 PRO150 OP100 OP150 RWC100 RWC150 EC100 EC150 CHL100 PRO150 0.85** 1.00
OP100 0.89** 0.77** 1.00
OP150 0.85** 0.72** 0.93** 1.00
RWC100 0.88** 0.89** 0.75** 0.65* 1.00
RWC150 0.84** 0.90** 0.72** 0.57* 0.86** 1.00
EC100 20.60* 20.60* 20.64* 20.36 20.64* 20.74** 1.00
EC150 20.56 20.57 20.42 20.15 20.73 20.77** 0.81** 1.00
CHL100 0.63* 0.50 0.66* 0.65* 0.44 0.60* 20.37 20.36 1.00
CHL150 0.89** 0.86** 0.77** 0.65* 0.88** 0.90** 20.80 20.73 0.50
For each parameter, average values of threeAtDREB1Atransgenic peanut lines along with WT were used (Refer toTable 1).
doi:10.1371/journal.pone.0110507.t004
Fig. 3. Quantitative real-time PCR analysis of expression patterns ofAtDREB1Atransgene in the leaves of transgenic lines at different time points and in response to various stresses.Values represent mean activities (n53)¡SD. Bars denote fold expression as compared to the expression level at 0thh. Means followed by the same lower case letters within a column are not significantly different (P#0.05).
physio-biochemical and growth parameters, even under unstressed condition, as was observed in AtDREB1A transgenic rice [18].
Quantitative Expression of the
AtDREB1A
Gene under Drought
and Salinity Stress
Quantitative real-time PCR was carried out to confirm expression of the heterologous AtDREB1Agene in T lines (D1, D2 and D3), and differential expression of the transgene was observed at various time points during both drought and salinity stresses. Within two h of drought (20% PEG) and salinity (200 mM NaCl) stress imposition, AtDREB1A gene expression increased more than 2-fold (Fig. 3). However, under drought stress, consistent increases in transgene expression were recorded from the 10thh, and the maximum was recorded at the 16th h (.10-fold). Under salinity stress, transgene expression reached a maximum at the 6thh (.5.52-fold), and a gradual declining trend was recorded subsequently until the 16th h.
All the three T lines showed similar pattern of transgene expression with minute variations in 16 h treatment regime. However T line D3 showed the highest level of AtDREB1A transcript under both the stresses. The strong response of
AtDREB1A gene under both the stimuli indicated that it possibly plays a role of central regulator in the signal transduction pathway that is triggered by drought and salinity stresses [9].
However, heterologous expression of theDgWRKY3 and ThbZIP1 genes in tobacco, under drought and salinity stresses revealed that transgene expression was more profound under drought compared to salinity stress [46,69], whereas the reverse phenomenon was reported inTaSRHP A. thaliana[9]. The differential pattern of AtDREB1A expression in peanut, under both stresses, may be
responsible for the tolerance of the T plants, characterized by less wilting and a subsequent speedy recovery, after the withdrawal of stress. Even for other crop plants, different levels of abiotic stress tolerance in T expressing various
heterologous genes (AtDREB1A, LbDREB, DgWRKY3, PgDREB2A and ThbZIP1) were reported [24,43,46,69,70].
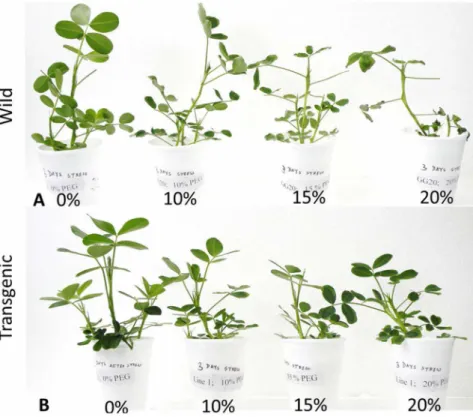
Visual Observations during Drought and Salinity Stresses
During stress imposition, visual observations on wilting and its recovery rate after the withdrawal of stress were recorded for both T and WT. At 15% PEG, WT exhibited wilting on the 3rdd, whereas T did not show wilting symptoms until the 5thd (Fig. 4). Similarly, at 150 mM NaCl, WT and T showed wilting on the 6th and 10thd, respectively (S4 Fig.). Moreover, at 20% PEG and 200 mM NaCl, in WT, wilting was recorded after the 1stand 3rdd respectively; whereas for T wilting was observed after the 2ndand 6thd, respectively (Fig. 4andS4 Fig.). The severity of wilting was more pronounced in WT, and during recovery, T recovered at a faster rate than WT (S5 Fig.).
Abiotic Stress Tolerance inAtDREB1ATransgenic Peanut
To save the plants form further wilting and subsequent death, both stresses were withdrawn, and seedlings were recovered by transferring them to Hoagland’s solution. The upper 3–4 leaves of the T plants remained either un-wilted or partially wilted. However, all leaves of the WT remained wilted, even after the 6th d of stress withdrawal (20% PEG and 200 mM NaCl) (S5 Fig.). Similarly, the expression of the heterologous transgenes in tall fescue (DREB1A/CBF3), rice (AtDREB1A), and soybean (AtDREB1A) also displayed a delay in the curling of leaves under stress and a rapid recovery in T plants upon withdrawal of stress [18,22,43].
In our studies, even under unstressed conditions, significantly improved physio-biochemical traits were observed in the various T lines over WT (Figs. 1 and 2, S1 and S3 Figs.). Similar results have been reported for theAtDREB1A
soybean [22] and other plant species [19,71]. This could be due to the basal level of AtDREB1A expression during unstressed conditions, which is under the regulatory control of the stress-inducible rd29A promoter. However, upon stress imposition, there was a rapid induction and a higher level of transgene expression [22].
Furthermore, results of the RT-PCR analysis also showed a basal level of transgene expression at the transcript level under unstressed conditions (data not shown). Despite the low level of activity under unstressed conditions, the rd29A Fig. 4. Seedlings of wild type (A) and transgenic line (B) exposed to 0, 10, 15, 20% PEG for 3 days.
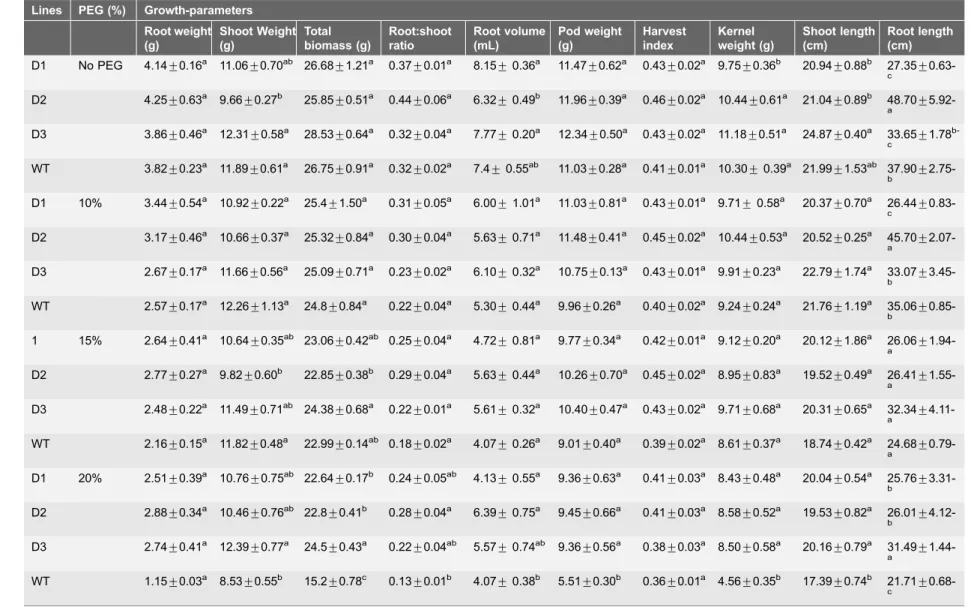
Table 5.Growth-parameters of transgenic and WT plants under drought-stress.
Lines PEG (%) Growth-parameters Root weight (g) Shoot Weight (g) Total biomass (g) Root:shoot ratio Root volume (mL) Pod weight (g) Harvest index Kernel weight (g) Shoot length (cm) Root length (cm)
D1 No PEG 4.14¡0.16a 11.06¡0.70ab 26.68¡1.21a 0.37¡0.01a 8.15¡0.36a 11.47¡0.62a 0.43¡0.02a 9.75¡0.36b 20.94¡0.88b 27.35¡
0.63-c
D2 4.25¡0.63a 9.66¡0.27b 25.85¡0.51a 0.44¡0.06a 6.32¡0.49b 11.96¡0.39a 0.46¡0.02a 10.44¡0.61a 21.04¡0.89b 48.70¡ 5.92-a
D3 3.86¡0.46a 12.31¡0.58a 28.53¡0.64a 0.32¡0.04a 7.77¡0.20a 12.34¡0.50a 0.43¡0.02a 11.18¡0.51a 24.87¡0.40a 33.65¡1.78
b-c
WT 3.82¡0.23a 11.89¡0.61a 26.75¡0.91a 0.32¡0.02a 7.4¡0.55ab 11.03¡0.28a 0.41¡0.01a 10.30¡0.39a 21.99¡1.53ab 37.90¡ 2.75-b
D1 10% 3.44¡0.54a 10.92¡0.22a 25.4¡1.50a 0.31¡0.05a 6.00¡1.01a 11.03¡0.81a 0.43¡0.01a 9.71¡0.58a 20.37¡0.70a 26.44¡ 0.83-c
D2 3.17¡0.46a 10.66¡0.37a 25.32¡0.84a 0.30¡0.04a 5.63¡0.71a 11.48¡0.41a 0.45¡0.02a 10.44¡0.53a 20.52¡0.25a 45.70¡
2.07-a
D3 2.67¡0.17a 11.66¡0.56a 25.09¡0.71a 0.23¡0.02a 6.10¡0.32a 10.75¡0.13a 0.43¡0.01a 9.91¡0.23a 22.79¡1.74a 33.07¡ 3.45-b
WT 2.57¡0.17a 12.26
¡1.13a 24.8
¡0.84a 0.22
¡0.04a 5.30
¡0.44a 9.96
¡0.26a 0.40
¡0.02a 9.24
¡0.24a 21.76
¡1.19a 35.06 ¡
0.85-b
1 15% 2.64¡0.41a 10.64¡0.35ab 23.06¡0.42ab 0.25¡0.04a 4.72¡0.81a 9.77¡0.34a 0.42¡0.01a 9.12¡0.20a 20.12¡1.86a 26.06¡
1.94-a
D2 2.77¡0.27a 9.82¡0.60b 22.85¡0.38b 0.29¡0.04a 5.63¡0.44a 10.26¡0.70a 0.45¡0.02a 8.95¡0.83a 19.52¡0.49a 26.41¡ 1.55-a
D3 2.48¡0.22a 11.49¡0.71ab 24.38¡0.68a 0.22¡0.01a 5.61¡0.32a 10.40¡0.47a 0.43¡0.02a 9.71¡0.68a 20.31¡0.65a 32.34¡
4.11-a
WT 2.16¡0.15a 11.82¡0.48a 22.99¡0.14ab 0.18¡0.02a 4.07¡0.26a 9.01¡0.40a 0.39¡0.02a 8.61¡0.37a 18.74¡0.42a 24.68¡
0.79-a
D1 20% 2.51¡0.39a 10.76¡0.75ab 22.64¡0.17b 0.24¡0.05ab 4.13¡0.55a 9.36¡0.63a 0.41¡0.03a 8.43¡0.48a 20.04¡0.54a 25.76¡ 3.31-b
D2 2.88¡0.34a 10.46¡0.76ab 22.8¡0.41b 0.28¡0.04a 6.39¡0.75a 9.45¡0.66a 0.41¡0.03a 8.58¡0.52a 19.53¡0.82a 26.01¡
4.12-b
D3 2.74¡0.41a 12.39¡0.77a 24.5¡0.43a 0.22¡0.04ab 5.57¡0.74ab 9.36¡0.56a 0.38¡0.03a 8.50¡0.58a 20.16¡0.79a 31.49¡ 1.44-a
WT 1.15¡0.03a 8.53¡0.55b 15.2¡0.78c 0.13¡0.01b 4.07¡0.38b 5.51¡0.30b 0.36¡0.01a 4.56¡0.35b 17.39¡0.74b 21.71¡ 0.68-c
The data are mean of three replicates¡SE; Means followed by the same lower case letters within a column are not significantly different (P#0.05).
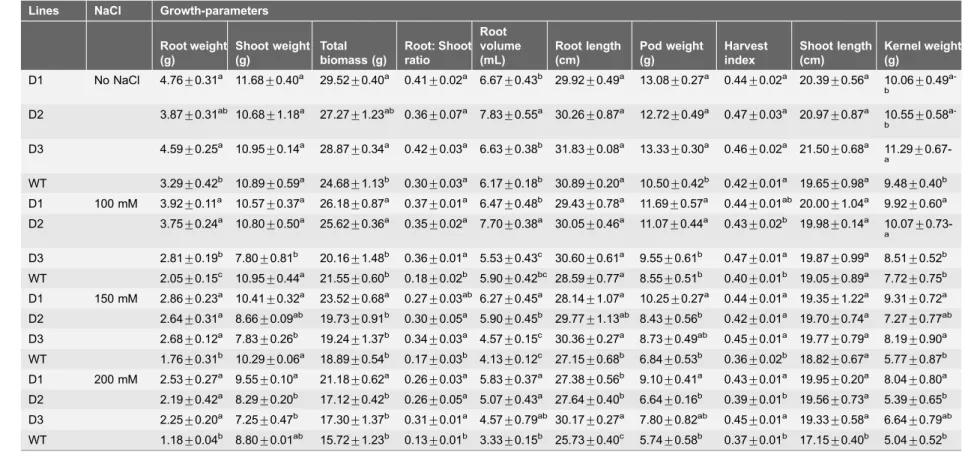
Table 6.Growth-parameters of transgenic and WT plants under salinity-stress.
Lines NaCl Growth-parameters Root weight (g) Shoot weight (g) Total biomass (g) Root: Shoot ratio Root volume (mL) Root length (cm) Pod weight (g) Harvest index Shoot length (cm) Kernel weight (g)
D1 No NaCl 4.76¡0.31a 11.68¡0.40a 29.52¡0.40a 0.41¡0.02a 6.67¡0.43b 29.92¡0.49a 13.08¡0.27a 0.44¡0.02a 20.39¡0.56a 10.06¡0.49 a-b
D2 3.87¡0.31ab 10.68¡1.18a 27.27¡1.23ab 0.36¡0.07a 7.83¡0.55a 30.26¡0.87a 12.72¡0.49a 0.47¡0.03a 20.97¡0.87a 10.55¡0.58 a-b
D3 4.59¡0.25a 10.95¡0.14a 28.87¡0.34a 0.42¡0.03a 6.63¡0.38b 31.83¡0.08a 13.33¡0.30a 0.46¡0.02a 21.50¡0.68a 11.29¡
0.67-a
WT 3.29¡0.42b 10.89¡0.59a 24.68¡1.13b 0.30¡0.03a 6.17¡0.18b 30.89¡0.20a 10.50¡0.42b 0.42¡0.01a 19.65¡0.98a 9.48¡0.40b
D1 100 mM 3.92¡0.11a 10.57¡0.37a 26.18¡0.87a 0.37¡0.01a 6.47¡0.48b 29.43¡0.78a 11.69¡0.57a 0.44¡0.01ab 20.00¡1.04a 9.92¡0.60a
D2 3.75¡0.24a 10.80
¡0.50a 25.62
¡0.36a 0.35
¡0.02a 7.70
¡0.38a 30.05
¡0.46a 11.07
¡0.44a 0.43
¡0.02b 19.98
¡0.14a 10.07 ¡
0.73-a
D3 2.81¡0.19b 7.80¡0.81b 20.16¡1.48b 0.36¡0.01a 5.53¡0.43c 30.60¡0.61a 9.55¡0.61b 0.47¡0.01a 19.87¡0.99a 8.51¡0.52b WT 2.05¡0.15c 10.95¡0.44a 21.55¡0.60b 0.18¡0.02b 5.90¡0.42bc 28.59¡0.77a 8.55¡0.51b 0.40¡0.01b 19.05¡0.89a 7.72¡0.75b D1 150 mM 2.86¡0.23a 10.41¡0.32a 23.52¡0.68a 0.27¡0.03ab 6.27¡0.45a 28.14¡1.07a 10.25¡0.27a 0.44¡0.01a 19.35¡1.22a 9.31¡0.72a
D2 2.64¡0.31a 8.66¡0.09ab 19.73¡0.91b 0.30¡0.05a 5.90¡0.45b 29.77¡1.13ab 8.43¡0.56b 0.42¡0.01a 19.70¡0.74a 7.27¡0.77ab
D3 2.68¡0.12a 7.83
¡0.26b 19.24
¡1.37b 0.34
¡0.03a 4.57
¡0.15c 30.36
¡0.27a 8.73
¡0.49ab 0.45
¡0.01a 19.77
¡0.79a 8.19 ¡0.90a
WT 1.76¡0.31b 10.29¡0.06a 18.89¡0.54b 0.17¡0.03b 4.13¡0.12c 27.15¡0.68b 6.84¡0.53b 0.36¡0.02b 18.82¡0.67a 5.77¡0.87b D1 200 mM 2.53¡0.27a 9.55¡0.10a 21.18¡0.62a 0.26¡0.03a 5.83¡0.37a 27.38¡0.56b 9.10¡0.41a 0.43¡0.01a 19.95¡0.20a 8.04¡0.80a D2 2.19¡0.42a 8.29¡0.20b 17.12¡0.42b 0.26¡0.05a 5.07¡0.43a 27.64¡0.40b 6.64¡0.16b 0.39¡0.01b 19.56¡0.73a 5.39¡0.65b
D3 2.25¡0.20a 7.25¡0.47b 17.30¡1.37b 0.31¡0.01a 4.57¡0.79ab 30.17¡0.27a 7.80¡0.82ab 0.45¡0.01a 19.33¡0.58a 6.64¡0.79ab
WT 1.18¡0.04b 8.80
¡0.01ab 15.72
¡1.23b 0.13
¡0.01b 3.33
¡0.15b 25.73
¡0.40c 5.74
¡0.58b 0.37
¡0.01b 17.15
¡0.40b 5.04 ¡0.52b
The data are mean of three replicates¡SE; Means followed by the same lower case letters within a column are not significantly different (P#0.05).
promoter is still considered stress-inducible and has a higher level of expression under stress compared to the 35S promoter [26].
Changes in Growth Parameters under Drought and Salinity
Stresses
Better growth parameters of various plant species over-expressing PgDREB2A
[24], GsZP1[72],DREB1A/1B, [8] and mtlD [4] genes under various abiotic stresses have been reported. For drought stress (up to 15% PEG), no significant difference in the various growth parameters was observed among T and WT (Table 5) as also reported forAtDREB1Asoybean [23]. At 20% PEG, the three T exhibited significantly improved growth parameters, including pod weight, shoot weight, total biomass, kernel weight, root length, and shoot length, compared with
Table 7.Correlation coefficient (r) between different growth- and physio-biochemical parameters under 20% PEG after 3 days of treatment.
RW SW PW TB HI R:S PRO CHL RWC EC
SW 0.48 1.00
PW 0.77** 0.41 1.00
TB 0.84** 0.78** 0.87** 1.00
HI 0.32 20.30 0.73** 0.31 1.00
R:S 0.92** 0.12 0.72** 0.64* 0.53 1.00
PRO 0.28 0.61* 0.46 0.58* 0.12 0.07 1.00
CHL 0.55 0.75** 0.52 0.73** 0.02 0.31 0.61* 1.00
RWC 0.65* 0.23 0.82** 0.67* 0.64* 0.69** 0.30 0.14 1.00
EC 20.65* 20.74** 20.76** 20.88** 20.25 20.42 20.48 20.62* 20.59* 1.00
OP 0.46 0.69** 0.43 0.64* 20.02 0.21 0.57* 0.91** 20.04 20.53
For each parameter, average values of threeAtDREB1Atransgenic peanut lines along with WT were used. Where: RW-root-weight, SW-shoot-weight, PW-pod-weight, TB- total biomass, HI-harvest index, R:S-root:shoot ratio, PRO- proline, OP-osmotic potential, RWC- relative water content, EC- electrolytic leakage, CHL-chlorophyll content. *Indicates a significant correlation: *P#0.05, and **P#0.01.
doi:10.1371/journal.pone.0110507.t007
Table 8.Correlation coefficient (r) between the various growth- and physio-biochemical parameters under 200 mM NaCl after 7 days of treatment.
RW SW PW TB HI R:S PRO CHL RWC EC
SW 0.19 1.00
PW 0.74** 0.56 1.00
TB 0.75** 0.72** 0.96** 1.00
HI 0.60* 0.15 0.87** 0.71** 1.00
R:S 0.94** 20.13 0.57* 0.52 0.58* 1.00
PRO 0.61* 20.25 0.48 0.34 0.68* 0.70** 1.00
CHL 0.51 0.13 0.76** 0.62* 0.86** 0.46 0.67* 1.00
RWC 0.81** 0.08 0.84** 0.72** 0.91** 0.79** 0.78** 0.80** 1.00
EC 20.66* 0.01 20.72** 20.58* 20.86** 20.67* 20.83** 20.79** 20.89** 1.00
OP 0.63* 20.03 0.52 0.45 0.58* 0.64* 0.92** 0.61* 0.69** 20.71**
For each parameter, average values of threeAtDREB1Atransgenic peanut lines along with WT were used (Refer toTable 7).
doi:10.1371/journal.pone.0110507.t008
Abiotic Stress Tolerance inAtDREB1ATransgenic Peanut
WT. Moreover, under various stress conditions, an improved root-shoot ratio was recorded for T lines (Table 5) which might be because of the stress-inducible expression of AtDREB1Agene [33,73]. Furthermore, in tobacco Ban et al. [70] observed more profound expression of LbDREBtransgene in the roots compared to the leaves at 200 mM NaCl and 20% PEG-induced stresses.
Various levels of drought stress (10 and 15% PEG) did not induce any significant adverse effect on the growth parameters in either T or WT (Table 5). However, highly detrimental effects of PEG (20%) were recorded on various growth parameters of WT compared with the T lines. Similar conclusions were reported by Jagana et al. [73] for peanut expressing the AtDREB1Agene under drought stress. Significantly higher root weight, root-shoot ratio and HI were observed for T across the various concentrations of salinity with increasing days of exposure (Table 6). The improvement in the growth parameters of T peanut were in agreement with the observation made by Datta et al. [8].
In this study, at 20% PEG, both T and WT exhibited efficient partitioning of total biomass, with more biomass in the roots (r50.84) and pods (r50.87) than in the shoots (r50.78) (Table 7). Similarly, at 200 mM NaCl, more biomass was found in the roots (r50.75) and pods (r50.96) than in the shoots (r50.72) (Table 8). This result confirms the observations onAtDREB1Atransgenic peanut and WT under drought stress [73].
Under both drought (20% PEG) and salinity stresses (200 mM NaCl),
significant positive correlations were observed between RWC and the root-shoot ratio (r50.69 and 0.79 respectively) and between RWC and pod weight (r50.82 and 0.84 respectively) (Table 7 and 8). Similar relationships have also been reported between RWC and root biomass in apple [74], and between RWC and grain yield in winter wheat [75]. This reiterates the fact that improvement in the RWC has direct positive effect on the overall growth of the T plant.
Under 20% PEG, chlorophyll content was found to be positively correlated with shoot weight (r50.75, Table 7), indicating an accumulation of above-ground biomass. Similar relationship was established inSAG12:ipt transgenicArabidopsis
under flood conditions [76]. However, under 200 mM NaCl, chlorophyll content was positively correlated with pod weight (r50.76, Table 8), which indicates higher yield. Such results were also reported in AtDREB1Arice under drought stress [18]. In our study, T lines exhibited stress-inducible expression of the
AtDREB1A gene, which may have led to less wilting of the leaves and the speedy recovery of seedlings. Moreover, better drought and salinity stress tolerance and improved physio-biochemical parameters in T peanut may have improved its growth performance.
Conclusions
plants showed elevated levels of proline, which resulted in better osmotic adjustments characterized by increased osmotic potential. This might be
responsible for a higher water retention capacity, a lower level of ion leakage due to improved membrane integrity, and better protection of photosynthetic mechanisms. However, better retention of leaf chlorophyll content in T compared with WT could be related to higher above-ground biomass accumulation [76], which could be due to the improved rate of photosynthesis and subsequently improved productivity in T under various abiotic stresses [18].
Nevertheless, the exact mechanisms and network ofAtDREB1A-induced regulation of native, downstream, stress-inducible genes that are responsible for improved physio-biochemical outcomes and growth parameters under various stresses are yet to be fully elucidated. Further analysis is required to determine the expression pattern of theAtDREB1Agene in different tissues of the T, which may reveal the reasons behind improved abiotic stress tolerance and root-shoot ratio of T over WT. Although many T peanut lines with varying degrees of improved abiotic stress tolerance have been developed around the world by numerous researchers, but to date, no commercial varieties have been developed [17]. Of the three T lines studied, D3 showed improved, combined tolerance to drought and salinity stresses, which can be used for further agronomic field trials.
Subsequently, the D3 line can also be utilized in crop improvement programs as a valuable pre-breeding resource.
Supporting Information
S1 Fig. Relative Water Content of three transgenic lines and WT.Under various levels of PEG (A) and NaCl (B) with increasing days of stress exposure (refer to Fig. 1).
doi:10.1371/journal.pone.0110507.s001 (PPT)
S2 Fig. Electrolytic Leakage of three transgenic lines and WT. Under various levels of PEG (A) and NaCl (B) with increasing of days of stress exposure (refer to Fig. 1).
doi:10.1371/journal.pone.0110507.s002 (PPT)
S3 Fig. Total Chlorophyll Content of three transgenic lines and WT. Under various levels of PEG (A) and NaCl (B) with increasing days of stress exposure (refer to Fig. 1).
doi:10.1371/journal.pone.0110507.s003 (PPT)
S4 Fig. Seedlings of wild type (WT) and transgenic (T) exposed to 0 mM (A), 100 mM (B), 150 mM (C), 200 mM (D) for 6 days.
doi:10.1371/journal.pone.0110507.s004 (PPT)
S5 Fig. Recovery of wild type (WT) and transgenic (T) lines in Hoagland’s solution.Recovery after 6 days following exposure to 20% PEG for 3 days (A) and
Abiotic Stress Tolerance inAtDREB1ATransgenic Peanut
recovery of WT and T in Hoagland’s solution after 6 days following exposure to 200 mM NaCl for 7 days (B).
doi:10.1371/journal.pone.0110507.s005 (PPT)
Acknowledgments
The authors thank Dr. K.C. Bansal, Director, National Bureau of Plant Genetic Resources (NBPGR), and the ICAR-NPTC, New Delhi, India for providing the AtDREB1A gene construct. Appreciation is also given to Mr. Nawade B.D. and Mr. K.K. Patel of Directorate of Groundnut Research DGR, Junagadh, India for their lab assistance.
Author Contributions
Conceived and designed the experiments: RT TS AK. Performed the experiments: TS JRD. Analyzed the data: TS RT AK JRD GPM. Contributed reagents/materials/ analysis tools: TS RT. Wrote the paper: TS RT AK GPM.
References
1. Shoba D, Manivannan N, Vindhiyavarman P, Nigam SN(2012) SSR markers associated for late leaf spot disease resistance by bulked segregant analysis in groundnut (Arachis hypogaeaL.). Euphytica 188: 265–272.
2. Bhatnagar-Mathur P, Rao JS, Vadez V, Dumbala SR, Rathore A, et al.(2014) Transgenic peanut overexpressing theDREB1Atranscription factor has higher yields under drought stress. Mol Breed 33: 327–340.
3. FAO(2012) Food and Agricultural Organization of the United Nation. FAO statistical database. Available: http://faostat.fao.org/faostat/collections?Subset5agriculture.
4. Bhauso TD, Radhakrishnan T, Kumar A, Mishra GP, Dobaria JR, et al.(2014) Over-expression of bacterialmtlDgene confers enhanced tolerance to salt-stress and water-deficit stress in transgenic peanut (Arachis hypogaea) through accumulation of mannitol. Aust J Crop Sci 8(3): 413–421.
5. Bhatnagar-Mathur P, Devi MJ, Vadez V, Sharma KK(2009) Differential antioxidative responses in transgenic peanut bear no relationship to their superior transpiration efficiency under drought stress. J Plant Physiol 166: 1207–1217.
6. Benjamin JG, Nielsen DC(2006) Water deficit effects on root distribution of soybean, field pea and chickpea. Field Crops Res 97: 248–253.
7. Yadav NS, Shukla PS, Jha A, Agarwal PK, Jha B (2012) The SbSOS1 gene from the extreme halophyteSalicornia brachiataenhances Na+loading in xylem and confers salt tolerance in transgenic
tobacco. BMC Plant Biol 12: 188.
8. Datta K, Baisakh N, Ganguly M, Krishnan S, Shinozaki KY, et al. (2012) Overexpression of
Arabidopsisand Rice stress genes’ inducible transcription factor confers drought and salinity tolerance to rice. Plant Biotech J 10: 579–586.
9. Hou X, Liang Y, He X, Shen Y, Huang Z(2013) A novel ABA-responsiveTaSRHPgene from wheat contributes to enhanced resistance to salt stress inArabidopsis thalianaplant. Mol Biol Rep 31: 791– 801.
11. Singh R, Issar D, Zala PV, Nautiyal PC(2007) Variation in sensitivity to salinity in groundnut cultivars during seed germination and early seedling growth. J SAT Agri Res 5(1).
12. Bartels D(2001) Targeting detoxification pathways: an efficient approach to obtain plants with multiple stress tolerance. Trends Plant Sci 6: 284–286.
13. Akcay UC, Ercan O, Kavas M, Yildiz L, Yilmaz C, et al.(2010) Drought-induced oxidative damage and antioxidant responses in peanut (Arachis hypogaeaL.) seedlings. Plant Growth Regul 61: 21–28.
14. Hasthanasombut S, Supaibulwatana K, Mii M, Nakamura I(2011) Genetic manipulation of Japonica rice using theOsBADH1gene from Indica rice to improve salinity tolerance. Plant Cell Tiss Organ Cult 104: 79–89.
15. Sharma KK, Ortiz R(2000) Program for the application of the genetic engineering for crop improvement in the semi-arid tropics. In Vitro Cell Dev-Pl 36: 83–92.
16. Varshney RK, Graner A, Sorrells ME (2005) Genic microsatellite markers in plants: features and applications. Trends Biotechnol 23: 48–55.
17. Holbrook CC, Ozias-Akins P, Chu Y, Guo B(2011) Impact of molecular genetic research on peanut cultivar development. Agronomy 1: 3–17.
18. Ravikumar G, Manimaran P, Voleti SR, Subrahmanyam D, Sundaram RM, et al.(2014) Stress-inducible expression ofAtDREB1Atranscription factor greatly improves drought stress tolerance in transgenic Indica rice. Transgen Res doi 10.1007/s11248-013-9776-6
19. Kasuga M, Liu Q, Miura S, Yamaguchi-Shinozaki K, Shinozaki K(1999) Improving plant drought, salt, and freezing tolerance by gene transfer of a single stress inducible transcription factor. Nat Biotech 17: 287–291.
20. Bhatnagar-Mathur P, Vadez V, Sharma KK(2008) Transgenic approaches for abiotic stress tolerance in plants: retrospect and prospects. Plant Cell Rep 27: 411–424.
21. Liu Q, Kasuga M, Sakuma Y, Abe H, Miura S, et al.(1998) Two transcription factors,DREB1and
DREB2, with anEREBP/AP2DNA binding domain separate two cellular signal transduction pathways in drought-and low temperature-responsive gene expression, respectively, in Arabidopsis. Plant Cell 10: 1391–1406.
22. Rolla AADP, Carvalho JDFC, Pagliarini RF, Engels C, Rio AD, et al.(2014) Phenotyping soybean plants transformed withrd29A:AtDREB1Afor drought tolerance in the greenhouse and field. Transgen Res 23: 75–87.
23. Agarwal PK, Agarwal P, Reddy MK, Sopory SK(2006) Role ofDREBtranscription factors in abiotic and biotic stress tolerance in plants. Plant Cell Rep 25(12): 263–1274.
24. Agarwal P, Agarwal PK, Joshi AJ, Sopory SK, Reddy MK(2010) Overexpression ofPgDREB2A
transcription factor enhances abiotic stress tolerance and activates downstream tress-responsive genes. Mol Biol Rep 37: 1125–1135.
25. Pandey B, Sharma P, Saini M, Pandey DM, Sharma I (2014) Isolation and characterization of Dehydration-Responsive Element-Binding Factor 2 (DREB2) from Indian wheat (Triticum aestivumL.) cultivars. Aust J Crop Sci 8(1): 44–54.
26. Kasuga M, Miura S, Shinozaki K, Shinozaki KY(2004) A Combination of theArabidopsis DREB1A
gene and stress-induciblerd29Apromoter improved drought-and low-temperature stress tolerance in tobacco by gene transfer. Plant Cell Physiol 45: 346–350.
27. Maruyama K, Sakamura Y, Kasuga M, Ito Y, Seki M, et al. (2004) Identification of cold-inducible downstream genes ofArabidopsis DREB1A/CBF3transcriptional factor using two microarray systems. Plant J 38: 982–993.
28. Behnam B, Kikuchi A, Toprak FC, Yamanaka S, Kasuga M, et al.(2006) TheArabidopsis DREB1A
gene driven by the stress-inducible rd29A promoter increases salt-stress tolerance in proportion to its copy number in tetrasomic tetraploid potato (Solanum tuberosum). Plant Biotechnol J 23: 169–177.
29. Xiao H, Siddiqua M, Braybrook S, Nassuth A(2006) Three grape CBF/DREB1 genes respond to low temperature, drought and abscisic acid. Plant Cell Environ 29: 1410–1421.
30. Morran S, Eini O, Pyvovarenko T, Parent B, Singh R, et al.(2011) Improvement of stress tolerance of wheat and barley by modulation of expression ofDREB/CBFfactors. Plant Biotech J 9: 230–249.
Abiotic Stress Tolerance inAtDREB1ATransgenic Peanut
31. Wright GC, Rao RCN, Farquhar GD(1994) Water-use efficiency and carbon isotope discrimination in peanut under water deficit conditions. Crop Sci 34: 92–97.
32. Krishnamurthy L, Vadez V, Devi MJ, Serraj R, Nigam SN, et al. (2007) Variation in transpiration efficiency and its related traits in a groundnut (Arachis hypogaeaL.) mapping population. Field Crops Res 103: 189–187.
33. Vadez V, Rao S, Sharma KK, Bhatnagar-Mathur P, Devi MJ(2007)DREB1Aallows for more water uptake in groundnut by a large modification in the root/shoot ratio under water deficit. J SAT Agri Res 5: 1–5.
34. Bhatnagar-Mathur P, Devi MJ, Reddy DS, Lavanya M, Vadez V, et al. (2007) Stress-inducible expression ofAtDREB1Ain transgenic peanut (Arachis hypogaeaL.) increases transpiration efficiency under water-limiting conditions. Plant Cell Rep 26: 2071–2082.
35. Sarkar T, Radhakrishnan T, Kumar A, Mishra GP, Dobaraia JR (2013) AtDREB1A transgenic groundnut shows tolerance to drought and salinity stresses. In: Proceedings of National Conference of Plant Physiology (13–16 December, 2013), Junagadh- Gujarat, India. pp. 383.
36. Wang Z, Zhang Y, Huang Z, Huang L(2008) Antioxidative response of metal-accumulator and non-accumulator plants under cadmium stress. Plant Soil 310: 137–149.
37. Barrs HD, Weatherley PE (1962) A re-examination of the relative turgidity technique for estimating water deficits in leaves. Aust J Biol Sci 24: 519–570.
38. Hiscox JD, Israelstam GF(1979) A method for the extraction of chlorophyll from leaf tissue without maceration. Can J Bot 57: 1332–133.
39. Bates R, Waldren RP, Teare ID(1973) A rapid determination of free proline for water stress studies. Plant Soil 39: 205–207.
40. Livak K, Schmittgen TD(2001) Analysis of relative gene expression data using real-time quantitative PCR and the 2-DDC
Tmethod. Method 25: 402–408.
41. Rai AC, Singh M, Shah K (2012) Effect of water withdrawal on formation of free radical, proline accumulation and activities of antioxidant enzymes inZAT12-transformed transgenic tomato plants. Plant Physiol Biochem 61: 108–114.
42. Lu Y, Li Y, Zhang J, Xiao Y, Yue Y, et al.(2013) Overexpression ofArabidopsismolybdenum cofactor sulfurase gene confers drought tolerance in maize (Zea maysL.). PLoS ONE 8(1): e 52126. doi:10.1371/ journal.pone.0052126
43. Zhao J, Ren W, Zhi D, Wang L, Xia G(2007) ArabidopsisDREB1A/CBF3bestowed transgenic tall fescue increased tolerance to drought stress. Plant Cell Rep 26: 1521–1528.
44. Du N, Liu X, Li Y, Chen S, Zhang J, et al. (2012) Genetic transformation ofPopulus tomentosato improve salt tolerance. Plant Cell Tiss Organ Cult 108: 181–189.
45. Bouaziz D, Pirrello J, Charfeddine M, Hammami A, Jbir R, et al.(2013) Overexpression ofStDREB1
transcription factor increases tolerance to salt in transgenic potato plant. Mol Biotechnol 54(3): 803–817.
46. Liu QL, Zhong M, Li S, Pan YZ, Jiang BB, et al. (2013) Overexpression of a chrysanthemum transcription factor geneDgWRKY3, in tobacco enhances tolerance to salt stress. Plant Physiol Biochem 69: 27–33.
47. Mao X, Zhang H, Qian X, Li A, Zhao G, et al.(2012)TaNAC2, a NAC-type wheat transcription factor conferring enhanced multiple abiotic stress tolerances inArabidopsis. J Exp Bot 63(8): 2933–2946.
48. Mackova´ H, Hronkova´ M, Dobra´ J, Turecˇkova´ V, Nova´k O, et al.(2013) Enhanced drought and heat stress tolerance of tobacco plants with ectopically enhanced cytokinin oxidase/dehydrogenase gene expression. J Exp Bot 64(10): 2805–2815.
49. Chen M, Chen QJ, Niu XG, Zhang R, Lin HQ, et al.(2007) Expression ofOsNHX1gene in maize confers salt tolerance and promotes plant growth in the field. Plant Soil Environ 53(11): 490–498.
50. Reguera M, Peleg Z, Blumwald E(2012) Targeting metabolic pathways for genetic engineering abiotic stress-tolerance in crops. BBA Gene Regul Mech 1819: 186–194.
52. Khare N, Goyary D, Singh NK, Shah P, Rathore M, et al.(2010) Transgenic tomato cv. Pusa Uphar expressing a bacterial mannitol-1-phosphate dehydrogenase gene confers abiotic stress tolerance. Plant Cell Tiss Organ Cult 103: 267–277.
53. Pardo JM(2010) Biotechnology of water and salinity stress tolerance. Curr Opin Biotechnol 21: 185–19.
54. Calcagno AM, Rivas M, Castrillo M (2011) Structural, physiological and metabolic integrated responses of two tomato (Solanum lycopersicumL.) cultivars during leaf rehydration. Aust J Crop Sci 5(6): 695–701.
55. Rai AC, Singh M, Shah K(2013) Engineering drought tolerant tomato plants over-expressingBcZAT12
gene encoding a C2H2zinc finger transcription factor. Phytochemistry 85: 44–50.
56. Liu X, Hua X, Guo J, Qi D, Wang L, et al.(2008) Enhanced tolerance to drought stress in transgenic tobacco plants overexpressingVTE1for increased tocopherol production fromArabidopsis thaliana. Biotechnol Lett 30: 1275–1280.
57. Surekha CH, Kumari KN, Aruna LV, Suneetha G, Arundhati A, et al.(2014) Expression of theVigna aconitifolia P5CSF129Agene in transgenic pigeonpea enhances proline accumulation and salt tolerance. Plant Cell Tiss Organ Cult 116: 27–36.
58. Wilson RA, Sangha MK, Banga SS, Atwal AK, Gupta S(2014) Heat stress tolerance in relation to oxidative stress and antioxidants inBrassica juncea. J Environ Biol 35(2): 383–387.
59. Li C, Wei Z, Liang D, Zhou S, Li Y, et al. (2013) Enhanced salt resistance in apple plants overexpressing aMalusvacuolar Na+/H+antiporter gene is associated with differences in stomatal
behaviour and photosynthesis. Plant Physiol Biochem 70: 164–173.
60. Zhang H, Dong H, Li W, Sun Y, Chen S, et al.(2009) Increased glycine betaine synthesis and salinity tolerance inAhCMOtransgenic cotton lines. Mol Breed 23: 289–298.
61. Farooq M, Wahid A, Kobayashi N, Fujita D, Basra SMA (2009) Plant drought stress: effects, mechanisms and manage-ment. Agron Sustain Dev 29: 185–212.
62. Jami SK, Clark GB, Turlapati SA, Handley C, Roux SJ, et al.(2008) Ectopic expression of an annexin fromBrassica junceaconfers tolerance to abiotic and biotic stress treatments in transgenic tobacco. Plant Physiol Biochem 46: 1019–1030.
63. Chen J, Xia X, Yin W(2009) Expression profiling and functional characterization of aDREB2-type gene fromPopulus euphratica.Biochem Bioph Res Co 378(3): 483–487.
64. Prabhavathi V, Yadav JS, Kumar PA, Rajam MV(2002) Abiotic stress tolerance in transgenic eggplant (Solanum melongenaL.) by introduction of bacterialmannitol 1-phosphate dehydrogenasegene. Mol Breed 9: 137–147.
65. Fobert PR, Miki BL, Iyer VN(1991) Detection of gene regulatory signals in plants revealed by T-DNA-mediated fusions. Plant Mol Biol 17: 837–851.
66. Goldsbrough A, Bevan M (1991) New patterns of gene activity in plants detected using an Agrobacterium vector. Plant Mol Biol 16: 263–269.
67. Bhat SR, Srinivasan S(2002) Molecular and genetic analyses of transgenic plants: considerations and approaches. Plant Sci 163(4): 673–68.
68. Prabhavathi V, Rajam MV (2007) Mannitol-accumulating transgenic eggplants exhibit enhanced resistance to fungal wilts. Plant Sci 173: 50–54.
69. Wang Y, Gao C, Liang Y, Wang C, Yang C, et al.(2010) A novelbZIPgene fromTamarix hispida
mediates physiological responses to salt stress in tobacco plants. J Plant Physiol 167: 222–230.
70. Ban Q, Liu G, Wang YA (2011) DREB gene from Limonium bicolor mediates molecular and physiological responses to copper stress in transgenic tobacco. J Plant Physiol 168: 449–458.
71. Rai GK, Rai NP, Rathaur S, Kumar S, Singh M (2013) Expression ofrd29A::AtDREB1A/CBF3 in tomato alleviates drought-induced oxidative stress by regulating key enzymatic and non-enzymatic antioxidants. Plant Physiol Biochem 69: 90–100.
72. Tang L, Cai H, Ji W, Luo X, Wang Z, et al. (2013) Overexpression ofGsZFP1enhances salt and drought tolerance in transgenic alfalfa (Medicago sativa. L.) Plant Physiol Biochem 71: 22–30.
Abiotic Stress Tolerance inAtDREB1ATransgenic Peanut
73. Jagana SR, Vadez V, Bhatnagar-Mathur P, Narasu ML, Sharma KK(2012) Better root:shoot ratio conferred enhanced harvest index in transgenic groundnut overexpressing therd29A:DREB1Agene under intermittent drought stress in an outdoor lysimetric dry-down trial. J SAT Agri Res 10: 1–7.
74. Pe´rez JCD, Shackel KA, Sutter EG(1995) Effects of in vitro-formed roots and acclimatization on water status and gas exchange of tissue-cultured apple shoots. J Amer Soc Hort Sci 120(3): 435–440.
75. Tahara M, Carver BF, Johnson RC, Smith EL (1990) Relationship between relative water content during reproductive development and winter wheat grain yield. Euphytica 49(3): 255–262.
76. Huynh LN, Toai TV, Streeter J, Banowetz G (2005) Regulation of flooding tolerance ofSAG12:ipt Arabidopsisplants by cytokinin. J Exp Bot 56(415): 1397–1407.