RESEARCH ARTICLE
Task-Driven Activity Reduces the Cortical
Activity Space of the Brain: Experiment and
Whole-Brain Modeling
Adrián Ponce-Alvarez1☯*, Biyu J. He2☯, Patric Hagmann3,4, Gustavo Deco1,5
1Center for Brain and Cognition, Computational Neuroscience Group, Department of Information and Communication Technologies, Universitat Pompeu Fabra, Barcelona, Spain,2National Institute of Neurological Disorders and Stroke, National Institutes of Health, Bethesda, Maryland, United States of America,3Department of Radiology, Lausanne University Hospital and University of Lausanne (CHUV-UNIL), Lausanne, Switzerland,4Signal Processing Lab 5, Ecole Polytechnique Fédérale de Lausanne (EPFL), Lausanne, Switzerland,5Institució Catalana de la Recerca i Estudis Avançats (ICREA), Universitat Pompeu Fabra, Barcelona, Spain
☯These authors contributed equally to this work. *[email protected]
Abstract
How a stimulus or a task alters the spontaneous dynamics of the brain remains a fundamen-tal open question in neuroscience. One of the most robust hallmarks of task/stimulus-driven brain dynamics is the decrease of variability with respect to the spontaneous level, an effect seen across multiple experimental conditions and in brain signals observed at different spa-tiotemporal scales. Recently, it was observed that the trial-to-trial variability and temporal variance of functional magnetic resonance imaging (fMRI) signals decrease in the task-driven activity. Here we examined the dynamics of a large-scale model of the human cortex to provide a mechanistic understanding of these observations. The model allows computing the statistics of synaptic activity in the spontaneous condition and in putative tasks deter-mined by external inputs to a given subset of brain regions. We demonstrated that external inputs decrease the variance, increase the covariances, and decrease the autocovariance of synaptic activity as a consequence of single node and large-scale network dynamics. Altogether, these changes in network statistics imply a reduction of entropy, meaning that the spontaneous synaptic activity outlines a larger multidimensional activity space than
does the task-driven activity. We tested this model’s prediction on fMRI signals from healthy
humans acquired during rest and task conditions and found a significant decrease of entropy in the stimulus-driven activity. Altogether, our study proposes a mechanism for increasing the information capacity of brain networks by enlarging the volume of possible activity configurations at rest and reliably settling into a confined stimulus-driven state to allow better transmission of stimulus-related information.
OPEN ACCESS
Citation:Ponce-Alvarez A, He BJ, Hagmann P, Deco G (2015) Task-Driven Activity Reduces the Cortical Activity Space of the Brain: Experiment and Whole-Brain Modeling. PLoS Comput Biol 11(8): e1004445. doi:10.1371/journal.pcbi.1004445
Editor:Lyle J. Graham, Université Paris Descartes, Centre National de la Recherche Scientifique, FRANCE
Received:January 27, 2015
Accepted:July 10, 2015
Published:August 28, 2015
Copyright:This is an open access article, free of all copyright, and may be freely reproduced, distributed, transmitted, modified, built upon, or otherwise used by anyone for any lawful purpose. The work is made available under theCreative Commons CC0public domain dedication.
Data Availability Statement:All relevant data are within the paper and its Supporting Information files.
Author Summary
Task- or stimulus-related changes of brain dynamics have been the subject of intense inves-tigation during the last years. One of the most robust hallmarks of task/stimulus-driven brain dynamics, as measured using diverse recording techniques, is the decrease of variabil-ity with respect to the spontaneous level. This has led several researchers to focus on the sec-ond-order statistics of evoked activity and to study their functional consequences for information processing. In particular, it was observed that the trial-to-trial variability (related to variable responses to an identical stimulus from one presentation to the next) and the temporal variance of functional magnetic resonance imaging (fMRI) signals decrease in the task-driven activity. Here, we built a computational model of the whole brain to understand how local and large-scale brain dynamics contribute to these effects. The model allowed us to derive equations for the network statistics of both spontaneous and evoked activity. We observed that, as a consequence of single node and network dynam-ics, stimulus input impacts network statistics in such a way that the entropy of the stimulus-driven activity is lower than that during spontaneous activity. We confirmed this model pre-diction using empirical fMRI data and we further discuss its functional implications.
Introduction
How spontaneous brain dynamics are altered under stimulation or task conditions remains an important open question in neuroscience. Empirically, one of the most robust hallmarks of task-driven brain activity is the decrease of variability following an external stimulus input, a phenomenon observed across a variety of species, cortical areas, tasks, stimulus and attentional conditions, and using brain signals observed across multiple spatiotemporal scales including neuronal membrane potentials, neuronal firing rates, field potentials and functional magnetic resonance imaging (fMRI) signals [1–5]. A recent fMRI study showed that trial-by-trial
vari-ability of BOLD signals decreases following stimulus onset in a visual detection task and that the magnitude of variability reduction was correlated with the magnitude of trial-averaged response [3]. Moreover, the temporal variance of BOLD signals is significantly smaller during the same task as compared with the resting condition [6]—an effect that has also been reported
in brain field potentials, neuronal membrane potentials, and neuronal spiking activity [7–9]. This suggests that the multidimensional space outlined by cortical activity is reduced following the stimulus onset [10].
Yet, a detailed mechanistic explanation of these effects is still lacking. In the present work we aimed to model the empirical observations of the fMRI study of [3], by studying the effect of external inputs on the first- and second- order statistics of a large-scale model of the brain [11]. This model is composed ofNlocal E-I nodes, with one excitatory and one inhibitory neural sub-populations, representingNbrain regions that are interconnected through an empirical large-scale connectivity matrix obtained using diffusion imaging data of healthy human subjects [12]. The dynamics of each of the E-I nodes follows the mean field equations derived by [13] and the excitatory firing rate is clamped around 3 Hz by adjusting the connection weight from the I pop-ulation to the E poppop-ulation, a procedure known as Feedback Inhibition Control (FIC) [11]. This large-scale model has been shown to provide an efficient description of resting-state fMRI func-tional connectivity together with realistic stimulus-evoked activity [11]. Here we assumed that different tasks can be modeled by sets of inputs that co-activate different brain regions. Further-more, we focused on synaptic activity, since it has been shown that BOLD signals relate to local field potentials (LFPs) more closely than to neuronal firing rates [14–17].
Using this model we observed that, as a consequence of single node and network dynamics, the application of an external input impacts the network statistics, so that the entropy of the stimulus-evoked activity is lower than that during spontaneous activity. We confirmed this model prediction using empirical fMRI data and further discussed its functional implications.
Results
In this work, we examined how external stimulation impacts the statistics of both single E-I nodes and a large-scale model composed of interconnected E-I nodes. A priori, the nonlinear and stochastic nature of the dynamical equations hinders analytical progress, and the calcula-tion of the network’s statistics relies on numerical simulations of the stochastic differential equations (SDEs), which are time consuming and subject to sampling issues. But, in the case of weak noise, one can linearize the stochastic fluctuations and derive deterministic differential equations for the network’s statistics. This so-calledlinear noise approximationis described in
the Methods section. In the following, unless otherwise specified, we used this method to approximate the network’s covariances, autocovariances, and power spectral densities both in
the spontaneous condition and when an external input is applied to the network.
Response of an isolated node
We first evaluated the variability of the synaptic activity of single E-I nodes (Fig 1A). We calcu-lated two types of variability:i) the variance across stochastic realizations of synaptic activity (trial-by-trial variance), notedσ2, andii) the autocovariance (temporal variance) of synaptic
activity, defined as the covariance of the synaptic activity with itself at pairs of time points and notedFu(t+τ,t). Explicitly these statistics are given by:
s2
¼Var½u ¼½uðtÞ huðtÞi2
; ð1Þ
Fuðtþt;tÞ ¼h½uðtþtÞ huðtþtÞi:½uðtÞ huðtÞii; ð2Þ
whereuis the synaptic activity and the angle brackets<.>denote the average over stochastic model realizations (i.e. the average over simulated trials). The autocovariance measures the strength of the influence of the past dynamics of the system on its future dynamics [its normal-ized version,Fu(t+τ,t)/Fu(t,t), which is insensitive to the absolute amount offluctuation, is the
autocorrelation function (ACF)]. The equations governing these statistics can be analytically calculated by assuming that the noise is sufficiently weak to allow for a linearized treatment of thefluctuations orlinear noise approximation(seeMethods).
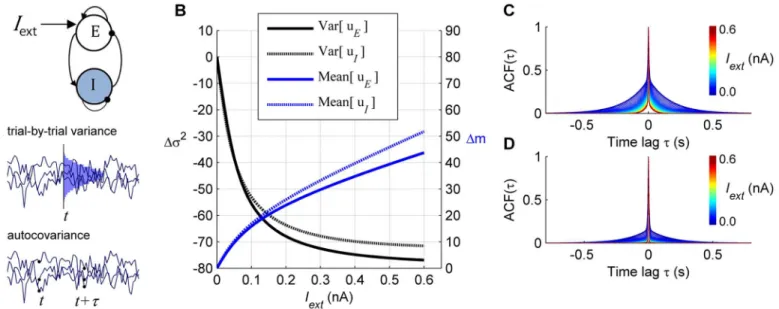
We examined how the application of an external stimulusIextto the E population (Fig 1A) changes the variability of synaptic activity. The stationary trial-by-trial variance of the synaptic activity under external input was compared to its stationary spontaneous level (Iext= 0), and the relative change was quantified by:
Ds2
ðIextÞ ¼100
s2ð IextÞ
s2ð0Þ 1
: ð3Þ
The relative change of the mean synaptic activity (Δm) was also computed:
DmðIextÞ ¼100
mðIextÞ
mð0Þ 1
: ð4Þ
populations. InS1 Textwe explicitly solved the equations for the variance and showed that the decrease of synaptic activity’s variance in response to an external input is determined by
non-linearities and connectivity parameters (see alsoS1 Fig).
Moreover, the external input reduces the spread of the autocorrelation function (ACF) of the synaptic activity of both E and I populations (Fig 1C and 1D). In conclusion, application of an external input attenuates the trial-by-trial fluctuations and shortens the temporal memory of the synaptic activity of an E-I local node.
Response of the large-scale network
We next evaluated the first- and second-order statistics of task-driven activity in a large-scale network composed of local E-I nodes interconnected through empirically derived anatomical connectivity (seeMethods; see also [11]). The model has a single free parameterGthat deter-mines the strength of connectivity, called global coupling parameter (seeMethods), which in the following is fixed toG= 2.15, this value falls in the range ofGvalues (between 1–4.45) for
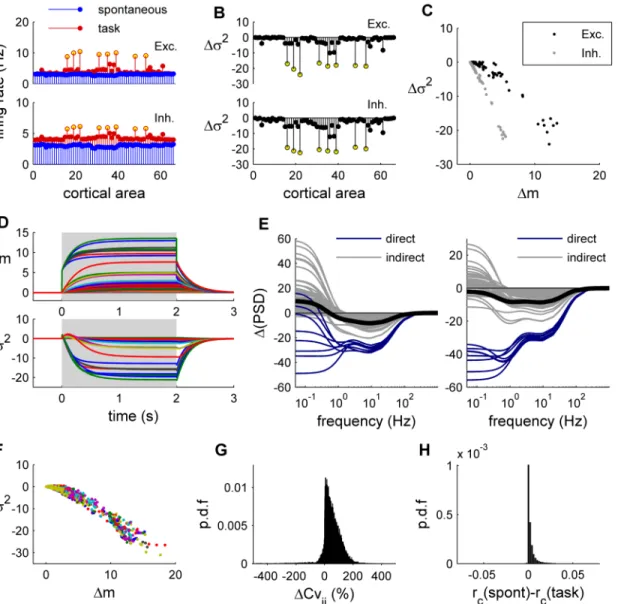
which the model fits closely to the resting-state functional connectivity of fMRI data [11]. Given the previous results for an isolated node, we predict that external inputs to local nodes propagate through the dynamical system, reducing the trial-by-trial variance of other nodes in the network via direct or indirect pathways.Fig 2Ashows the response of the large-scale net-work when eight brain regions receive an external input (equal toIext= 0.02 nA). To simulate the results of [3], in which human subjects performed a visual detection task, the selected brain regions receiving external inputs are related to visual processing. Two observations can be made: First, as expected from the response of isolated nodes, trial-by-trial variance reduces under simulated task condition for nodes directly receiving external inputs (Fig 2B). Second, Fig 1. Response of a single local node. A:Top: Architecture of a local node composed of one excitatory (E) and one inhibitory (I) neural population. In the stimulated condition an external inputIextis applied to the E population.Middle: The trial-by-trial variability describes the variance of synaptic activity at timet
across stochastic realizations, i.e. simulation trials. Here, three trials are shown (the distribution of synaptic activity at timetis shown inblue. In the stationary regime, the trial-by-trial variance is independent of time.Bottom: The temporal variability describes the covariance of the synaptic activity with itself at pairs of time points,tandt+τ, averaged across stochastic realizations, i.e. simulation trials. Here, three trials are shown. In the stationary regime, the temporal
variance is a function ofτonly.B:Application of an external input increases the mean in both E and I populations (blue) while it reduces the synaptic
trial-by-trial variance of both populations with respect to the spontaneous state (black). The amount of change of the variance was given byΔσ2(Iext) = 100x[σ2(Iext)– σ2(0)]/σ2(0).C–D:The application of the external input reduces the autocorrelation ACF(τ) of the excitatory population for the E population (C) and the I population (D). The colors indicate the intensity of the applied external inputIext.
consistent with the above prediction, many nodes not directly receiving external inputs also exhibit trial-by-trial variance reduction upon external stimulation to (other nodes in) the net-work. Notably, the change of trial-by-trial variance with respect to the spontaneous activity (Δσ2) is negative for all nodes (Fig 2B) andΔσ2is negatively related to the change of synaptic
activityΔm (Fig 2C). This negative relation is consistent with the empirically observed negative Fig 2. Response of the whole-brain network. A:Spontaneous (blue) and evoked (red) activity of the network for the excitatory populations (top) and the inhibitory populations (bottom). The yellow dots indicate the eight brain regions receiving the external input, which are: r/lLOCC, r/lMT, r/lPCAL, r/lST.B: Trial-by-trial variance change (Δσ2) with respect to the spontaneous condition for the excitatory populations (top) and the inhibitory populations (bottom). Yellow dots indicate the eight brain regions receiving the external input.C:Relation between the amount of mean synaptic change (Δm) and the amount of variance change (Δσ2) for the excitatory populations (black) and the inhibitory populations (gray).D:Temporal dynamics ofΔm (top) andΔσ2(bottom). Each line traces the time evolution ofΔm (orΔσ2) of each brain region. The shaded area indicates the application of the stimulus.E:The stimulus-induced relative
change of the power spectral density (ΔPSD) was computed for the excitatory populations (left) and the inhibitory populations (right).Blue: brain regions receiving a direct external input;gray: brain regions receiving an indirect external input;black: average across brain regions.F:The relation betweenΔm and
Δσ2is shown for 20 random stimulations constructed by randomly selecting eight nodes to which and external input is imposed (each color represents a given stimulation).G:Probability density function (p.d.f) of the relative change of the covariances between excitatory nodes. For each pair of nodes (i,j) we calculate the relative difference between the spontaneous covariance and the covariance evoked in the 20 random stimulations.H:Change of the correlations between excitatory nodes. For each pair of nodes (i,j) we calculate the difference between the spontaneous correlation coefficient and the correlation coefficient evoked in the 20 random stimulations.
doi:10.1371/journal.pcbi.1004445.g002
correlation between the magnitude of variability reduction and the amplitude of evoked response in fMRI signals [3]. This relation is expected for a large variety of connectivity matri-ces, since it arises from the propagation of the stimulus to nodes separated by direct and indi-rect links. However, using synthetic connectivities with different levels of clustering, we found that the relation holds for connectivity matrices with low or intermediate clustering, as it is the case of human connectomes, but it breaks for excessively clustered connectivity matrices for which recurrent connections highly dominate (seeS2 Fig).
The temporal dynamics of the model (Fig 2D) show that, during the application of the stim-ulus, the mean synaptic activity increases, while its variance decreases, and, after a period of relaxation of ~1–2 s, the system settles into a stable stimulus-evoked state. In the stationary spontaneous and stimulus-induced states, the power spectral density (PSD) of fluctuations of the system in the presence of stochastic perturbations can be calculated using the linear approximation (seeMethods,Eq 26). The change of variance in the frequency domain is given by the relative change of the power spectral density (ΔPSD) in the task-driven synaptic activity with respect to the spontaneous condition, defined as:
DPSD¼100 PSDtask
PSDspont 1
" #
: ð5Þ
Interestingly, the effect of imposing an external input is different for different frequencies and, as a result of network interactions, the PSDs of the brain regions are differently affected by the external input (Fig 2E). For both excitatory and inhibitory units, most of the brain regions directly receiving the external input showed reduced power in frequencies lower than 100 Hz, with a maximal reduction at ~9Hz (9.65 Hz for excitatory units; 7.42 Hz for inhibitory units), but those not directly receiving external input showed increased power in frequencies below 0.9 Hz and decreased power in frequencies between 0.9 and 100 Hz, with a maximal reduction at ~9Hz (9.35 Hz for excitatory units; 8.42 Hz for inhibitory units). These results are consistent with empirical electrophysiological findings of prominent desynchronization in alpha/beta fre-quency ranges during task performance [18] and human ECoG observations of decreased power in<1 Hz range only in task-relevant brain regions [7].
To show that the above results are not specific to the particular hypothetical“visual”task, we produced a large set of hypothetical tasks, by imposing an external input (equal to 0.02 nA) to the excitatory population of 8 randomly selected brain regions. The negative relation betweenΔσ2andΔm was found for all tested stimuli (Fig 2F). Interestingly, while the external
stimulus highly impacts the covariances with respect to the spontaneous case (Fig 2G), with a tendency to increase them, it only slightly changes the correlations between nodes (Fig 2H). This indicates that functional connectivity amongst nodes, classically measured using correla-tion matrices, is not dramatically changed by imposing an external stimulus.
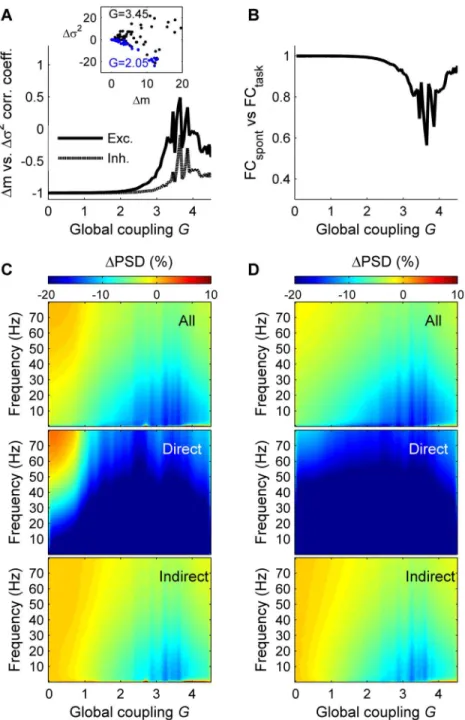
We next allowed the global parameterGto vary and observed that the above results are qualitatively the same for a large parameter space (withinG= 1 and 3) (Fig 3), namely thatΔσ2
andΔm are negatively related (Fig 3A), that the task-driven functional connectivity is very sim-ilar to the spontaneous functional connectivity (Fig 3B), and that the input prominently reduces the power of frequency fluctuations lower than 40 Hz (Fig 3C and 3D). Within this parameter range the model captures both the observed behavior of the stimulus-driven activity and the resting functional connectivity (as shown previously in [11]). In contrast, forG>3, the model correctly predicts the resting functional connectivity, but the behavior of the stimulus-driven activity is not consistent with the empirical observations.
Fig 3. Network response vs. global coupling. A:Correlation coefficient between the amount of mean synaptic change (Δm) and the amount of variance change (Δσ2) as a function ofG, for the excitatory populations (solid line) and for the inhibitory populations (dashed line). The inset shows the relation between
Δm andΔσ2forG= 2.05 (blue) andG= 3.45 (black) for the excitatory populations.B:Similarity (correlation coefficient) between the spontaneous and the task-evoked functional connectivity matrices as a function of the global coupling (G).C:Relative change of the power spectral density (ΔPSD) in the stimulated condition compared to the spontaneous condition, as a function ofG, for the excitatory populations.Top:ΔPSD averaged across the excitatory populations of all brain areas.Middle:ΔPSD averaged across the excitatory
populations of the brain areas directly receiving the external input.Bottom:ΔPSD averaged across the
excitatory populations of the brain areas indirectly receiving the external input.D:same as C for the inhibitory populations. In A–D the brain regions receiving the external input are: r/lLOCC, r/lMT, r/lPCAL, r/lST.
doi:10.1371/journal.pcbi.1004445.g003
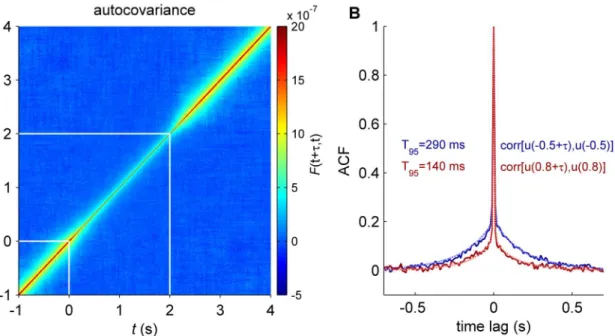
was applied at timet= 0 and lasted for 2 s. We used direct stochastic simulations of the net-work to estimate the time evolution of the autocovariance (Fig 4A). During the application of the external input, the temporal correlation length is reduced. To quantify this effect we calcu-lated the characteristic time scale of the ACF, noted T95, given by the time lag at which its value is equal to 0.05 (i.e. 95% percent of correlation decay). T95was calculated using the linear approximation (Eqs (21–24)) in stationary spontaneous and stimulus conditions (Fig 4B). We found that temporal correlations lasted more than twice as long in the spontaneous state than in the task state (for the excitatory synaptic activity: T95= 290 ms vs. T95= 140 ms; for the inhibitory synaptic activity: T95= 170 ms vs. T95= 30 ms). Hence, the temporal memory of the synaptic activity of the large-scale model is shortened after the stimulus onset.
Simulated BOLD dynamics
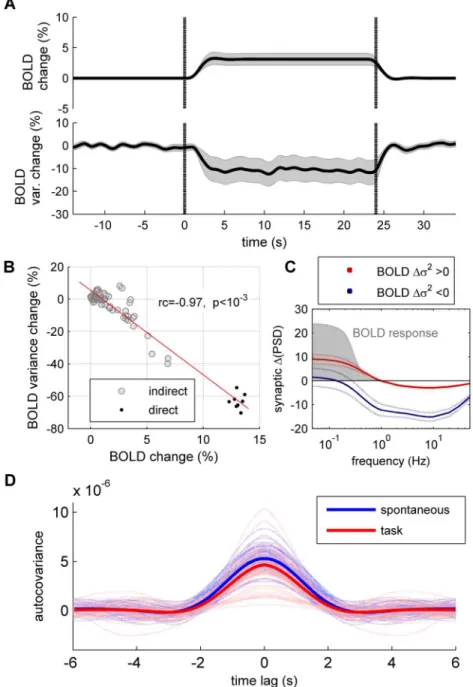
Up to now we have focused on the dynamics of the synaptic activity. Because BOLD fMRI is widely used to study brain dynamics under both resting state and cognitive tasks, an important question pertains to whether the previous results apply to the dynamics of BOLD signals. To test this, we used a hemodynamic model to convert the total synaptic activity (the sum of excit-atory and inhibitory synaptic activity) into BOLD activity. We used the Balloon-Windkessel model for the Hemodynamic response that describes the transduction of neural activity to BOLD changes, though non-linear dynamic equations of blood flow and deoxyhemoglobin content [19]. The model parameters were chosen as in [3]. Using this nonlinear model we found that an external stimulus input increases the trial-averaged BOLD activity, while reduc-ing the averaged trial-by-trial variance of BOLD signals (Fig 5A), leading to a linear negative relation between the relative change of trial-averaged BOLD activity and the relative change of its trial-by-trial variance during the application of the external input (Fig 5B). However, the rel-ative change of variance is positive for some of the brain regions (23 over 66). In the model, this is due to the low-pass filtering of the hemodynamic model, since the Balloon-Windkessel model acts as low-pass filter of the synaptic activity that passes frequencies under 1 Hz [20,21]. As shown inFig 2E, the stimulus-induced decrease of the synaptic variance is not negative for all brain regions for frequencies under 1 Hz. As a consequence, those brain regions for which the synaptic activity presents an elevation of the spectral power under 1Hz have a positive rela-tive change of the variance of the BOLD activity (Fig 5C). The stimulus-induced reduction of the autocovariance (Fig 5D) is moderate for the same reason: the memory of the BOLD signal is highly dominated by the slow hemodynamic response.
Entropy reduction and relative entropy
We next investigated the functional implications of the change in network statistics induced by external inputs. To this end, we calculated the differential entropyHof the synaptic activity. The differential entropy is an extension of the Shannon entropy for a continuous random vari-able and it is related to the volume occupied by the continuous random varivari-able.Hcan be eas-ily calculated for a multivariate normal distribution, an assumption that is met in our case for the level of noise used in this study (S3 Fig). In such cases,Hdepends on the covariance matrix which can be calculated using the linear noise approximation (seeMethods). We evaluated the differential entropy of the spontaneous activity and of the stimulus-driven activity for different model tasks determined by external inputs to a given subset of brain regions (Fig 6A). We found that external stimulation systematically reduces the entropy of the synaptic activity (Fig 6B).
uncertainty is produced by the dynamical system due to the intrinsic noise of each node propa-gating into the network. To answer this question we calculated the Kullback-Leibler divergence (KLD), also called relative entropy, between the distribution of intrinsic noise and the distribu-tion of synaptic activity. Because the intrinsic noises are normally distributed with covariance
Qnand the distribution of synaptic activity is normally distributed (for weak noise) with
covarianceCv, the KLD can be calculated usingEq (32)(seeMethods). We found that the
rela-tive entropy of the spontaneous synaptic activity is systematically higher than that of the stimu-lus-driven synaptic activity, indicating that in the spontaneous state the dynamical system adds more uncertainty to the intrinsic stochastic process than it does in the stimulated condition (Fig 6C).
Thus far we have considered that the intrinsic noise of each brain region is independent between nodes (i.e.,Qnis diagonal). However, it is reasonable to think that during a task and
even at rest different brain regions share some noise, possibly due to shared sensory/proprio-ceptive background inputs. We thus calculated the entropy and the relative entropy in the case of non-diagonal noise covariance matrices. As for the diagonal case, we found that the stimu-lus-driven synaptic activity has lower differential entropy and lower relative entropy than the spontaneous activity (S4 Fig). Thus, external stimulation reduces the entropy of synaptic activ-ity even in the presence of common noise.
Entropy reduction of fMRI signals
We tested the model prediction of higher entropy in the spontaneous activity than in the task-driven activity using empirical data from [3]. The data consists of fMRI time-series from 33 ROIs, covering five cortical networks, as well as the hippocampus, thalamus and cerebellum, acquired in 17 healthy subjects (seeMethods). Each subject completed 8 fMRI runs, each last-ing ~7 min, includlast-ing 4 runs in restlast-ing-state conditions and 4 runs in a visual detection task Fig 4. Time correlations. A:The autocovariance function was calculated for each time step timetand averaged across excitatory populations of all brain regions. The stimulus was presented att= 0 at last for 2 s (white lines).B:The averaged autocorrelation function (ACF) of excitatory synaptic activity at two different times,t= 0.5 s (spontaneous,blue) andt= 0.8 s (stimulus period,red). Solid lines are results from simulations and the dottedblueandredlines corresponded to the linear approximation in the stationary regime for the spontaneous and stimulus conditions, respectively. T95represents the characteristic
time-scale: the time lag at which the ACF is equal to 0.05. In this simulation the brain regions receiving the external input are: r/lLOCC, r/lMT, r/lPCAL, r/lST.
doi:10.1371/journal.pcbi.1004445.g004
Fig 5. Spontaneous and evoked dynamics of simulated BOLD signals. A:The BOLD activity was simulated in response to a stimulus application for 800 trials.Top: evolution of the trial-averaged BOLD activity relative change, with respect to the spontaneous period (before the stimulus onset), averaged across brain regions.Bottom: BOLD trial-by-trial variance relative change, with respect to the spontaneous period, averaged across brain regions. Shaded areas represent 95% confidence intervals. Vertical dotted lines indicate the onset and offset of the stimulus.B:Relation between the amount of mean BOLD change and the amount of variance change of BOLD signals, averaged over the period betweent= 5s andt= 23s, for the brain regions receiving directly (black) and indirectly (gray) the external input.C:Averaged change in power spectral density of the summed E-I synaptic activity (ΔPSD) separately for those brain regions that show an
increase (red) or a decrease (blue) of variance in the simulated BOLD signal. The shaded area indicates the response function of the BOLD model, given by the amplitude of the BOLD signal in response to cosine inputs of different frequencies, i.e. zi = cos(ωt).D:Autocovariance of the BOLD signals of individual brain
regions in the spontaneous condition (light blue) and in the stimulated condition (light red). The
autocovariance averaged across brain regions is shown inbluefor the spontaneous condition and inredfor the stimulated condition. In A–C the brain regions receiving the external input are: r/lLOCC, r/lMT, r/lPCAL, r/ lST.
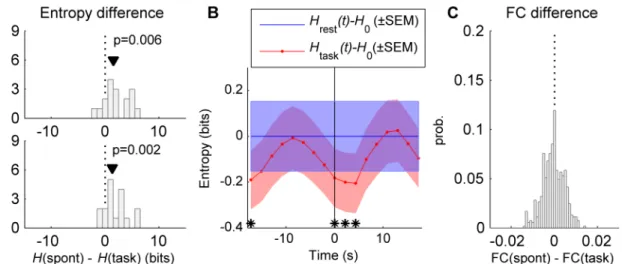
condition. Each task run contains 20 stimulus presentations that the subject was to detect by pressing a button as quickly as possible. The inter-stimulus interval ranged from 17.3–30.2 s. First, for each subject and condition, we concatenated the time-series of the different runs and estimated the entropy using two methods: i) by assuming normality and usingEq (30), and ii) by using the Nilsson-Kleijn non-parametric estimator (seeMethods). Using both methods, we found that the differential entropy in the resting activity is significantly higher than that of the task-driven activity (p<0.01, Wilcoxon signed-rank test) (Fig 7A). Second, we performed a time-resolved analysis in which the differential entropy was calculated using sliding windows of 5 frames (10.8 s) shifted in steps of 1 frame (2.16 s). UsingEq (30), we computed the time course of the differential entropy, averaged across subjects, in the task condition,Htask(t), and during rest,Hrest(t) (Fig 7B). The entropy values were referenced to the rest entropyH0 Fig 6. Entropy and relative entropy. A:The input noise (with covarianceQn) propagates through the dynamical system and generates an output covarianceCvbetween the system’s state variables (i.e. synaptic activity). The differential entropy of the input process (noise) and the output process (synaptic activity) is determined by the corresponding covariance of inputs and outputs. The differential entropy of the inputs and the one of the outputs of the large-scale model were compared in the spontaneous and task (stimulated) conditions.B:The differential entropyHof the large-scale model was calculated in both the spontaneous state and for many (500) random stimulations constructed by imposing an external input (equal to 0.02 nA) to the excitatory population of 8 randomly selected brain regions. The spontaneous entropy is 1–3 bits larger than the entropy in the task-evoked condition, for both excitatory (blue) and inhibitory (green) synaptic activity.C:The relative entropy was measured as the amount of entropy of the synaptic activity that cannot be accounted for by the noise inputs. It is given by the Kullback-Leibler divergence (KLD) between the input stochastic process and the observed synaptic activity. The relative entropy is larger in the spontaneous state than in the stimulated condition, for both excitatory (blue) and inhibitory (green) synaptic activity. In (B) and (C) the noise covarianceQnis diagonal (i.e., intrinsic noise is uncorrelated).
doi:10.1371/journal.pcbi.1004445.g006
averaged across subjects and across time windows, i.e.H0 ¼ 1
T
XT
t¼1HrestðtÞ, whereTis the
total number of time steps in a run. When the task data was aligned to the stimulus onset, we found that the differential entropy significantly decreases after the stimulus onset (p<0.01, pairedt-test) and, after ~8 s, it recovers its resting levelH0(the significant difference at–17.3 s is due to the previous stimulus).
Interestingly, the resting-state functional connectivity and the task functional connectivity were very similar, with differences in correlation coefficients ranging between ±0.02 (Fig 7C), a feature that is captured by the model (seeFig 2H).
Reduction of the cortical activity space
The above results show that the task-driven synaptic activity has lower trial-by-trial variance, lower temporal variance, and lower entropy than the spontaneous synaptic activity. Altogether, this indicates that the space occupied by the synaptic activity is reduced when external inputs are impinging upon the network. To illustrate this effect, we represented the synaptic activity at a given time point or in a given trial as a point in the state space.Fig 8Ashows the simulated synaptic activity of three brain regions in a three-dimensional space defined by the activity of these brain regions when no external input is applied (spontaneous condition) and when an external input is applied (task condition). The mean activity was removed for each brain region; thus, here, the activity represents deviations from the mean. In the spontaneous condi-tion, the network explores a volume of the state space that is larger than the volume explored Fig 7. Entropy of fMRI signals. A:The differential entropyH(spont) of the resting fMRI BOLD activity was compared with the differential entropyH(task) of the task-driven fMRI BOLD activity. The differential entropy was estimated with two different methods: assuming that fMRI signals are represented by a multivariate Gaussian process (top) and using the Nilsson-Kleijn non-parametric estimator (bottom). The black triangle indicates the median of the entropy differenceH(spont)–H(task) (p: p-value for the Wilcoxon signed-rank test for zero median).B:Peristimulus time resolved differential entropy. The differential entropy was calculated in windows of 5 frames, moved in steps of 1 frame, usingEq (30), in both rest [Hrest(t)] and task [Htask(t)] conditions and then averaged
across subjects. Entropy values were referenced toH0, i.e. the entropy averaged across subjects and time windows of 5 frames in rest condition. For task
activity the data was aligned to the stimulus onset (vertical line) and the entropy was averaged over stimulus presentations in the period between 17.3 s before the stimulus onset and 17.3 s after the stimulus onset; for rest activity, the entropy was averaged over equivalent periods. Theblueandredshaded areas indicate the SEM of [Htask(t)–H0] and [Hrest(t)–H0], respectively. The stars indicate the windows during whichHtask(t) is significantly different than
Hrest(t) (p<0.01, pairedt-test).C:distribution of the difference between the correlation coefficients of the functional connectivity (FC) of resting activity,
averaged across subjects, and the FC of task activity, averaged across subjects.
in the task condition. In the temporal domain, the space occupied by the synaptic activity is also reduced in the task condition compared to the spontaneous condition (Fig 8B). This is shown by plotting the synaptic activity of a given brain regioniin the three-dimensional space, or Poincaré map, defined as the synaptic activity in three different time pointst,t+τ, andt+2τ.
The volume of the space in the Poincaré map outlined by the spontaneous synaptic activity is larger than that occupied by the task-driven synaptic activity.
Discussion
We have shown that external stimulation to a large-scale brain model attenuates the synaptic fluctuations, increases the covariances, and reduces temporal memory in brain regions receiv-ing the input directly or indirectly through the anatomical connectivity. Furthermore, we showed that the spontaneous activity has more entropy and more relative entropy than the task-driven activity. More entropy and more relative entropy means that the brain network produces a larger number of possible activity configurations that are not explained by the intrinsic noise. In other words, as shown inFig 8and in accordance with empirical observa-tions, the multi-dimensional synaptic activity space is larger in the spontaneous state than under external inputs.
Information capacity and transmission
Reducing the space occupied by the synaptic activity, as a consequence of reducing the trial-by-trial and the temporal variability and increasing covariances, has relevant implications for Fig 8. Reduction of the cortical activity space. A:The excitatory synaptic activity of three brain regions, in spontaneous (blue) and task (red) conditions, is plotted in a three-dimensional space: each dot represents the vector Xi,j,k(t) = [x,y,z], where x = ui(t), y = uj(t), z = uk(t), andi,j, andkdenotes three brain
regions. For this particular model task eight brain regions receive an external input; here, regionireceives a direct external input while regionsjandkreceive indirect inputs through large-scale connections. The ellipses represent the 95% confidence of the distribution projected onto two-dimensional planes.B:The excitatory synaptic activity of a single brain regioni, in spontaneous (blue) and task (red) conditions, is plotted in a three-dimensional Poincaré map: each dot represents the vector X = [x,y,z], where x = ui(t), y = ui(t+τ), z = ui(t+2τ), andτ= 200ms. The ellipses represent the 95% confidence of the distribution projected onto two-dimensional planes.
doi:10.1371/journal.pcbi.1004445.g008
information processing. It has been shown that temporal variance and entropy of BOLD sig-nals change with chronological age and that young adults who are also faster and more consis-tent performers exhibited significantly higher brain variability across tasks [22–24]. In
addition, the reduction of trial-by-trial variability is highly predictive of better performance [4]. These observations are likely complementary. Indeed, in the view of Information Theory, the mutual information between the brain activity and a given stimulus can be decomposed as the difference between the entropy of the full set of response patterns for all stimuli (total entropy) and the entropy conditioned to one stimulus (evoked entropy). Thus, there are two ways of increasing the information carried by the brain activity: by increasing the total entropy or by decreasing the evoked entropy. There is growing evidence that the entropy at rest is an upper bound of the total entropy, since stimulus-evoked patterns reoccur during spontaneous activity [10,25,26]. In other words, more variability at rest is associated with a larger repertoire of potential brain states and greater information capacity [27] while the ability to reliably settle in a stimulus-evoked brain state allows better transmission of the information about the stimulus.
Information Theory provides quantification of the amount of potential information that is available given the distribution of brain activity. How the brain decodes this available informa-tion is a topic of active research. Classificainforma-tion of multivariate fMRI patterns has been used to decode different stimuli or behavioral conditions from the fMRI signals [28–30]. In this
con-text, the reduction of trial-by-trial variability under task would improve the discriminability of the fMRI multivariate patterns, which in turn improves the decoding performance. Moreover, if multivariate patterns have to be estimated using short time windows, as is likely during dynamical task processing, reducing the temporal correlations of the fluctuations would improve the estimation of the patterns (since the reduction of the autocorrelation leads to an increase of the effective number of independent samples within the time window). It is possible that the brain uses similar coding schemes to efficiently represent the incoming sensory infor-mation and evolving mental states, although exactly how such decoding schemes are imple-mented by neural systems remains an open question.
The link between synaptic activity and BOLD signals
In the present study we focused on the dynamics of the synaptic activity to model the empirical BOLD fMRI signals. Concentrating on the synaptic activity is justified since it has been shown that BOLD signals relate more closely to Local Field Potentials (LPF) rather than neuronal fir-ing rates [14–17]). As in previous studies of large-scale models [11,21,31], we converted the synaptic activity into simulated BOLD signals via a non-linear hemodynamic model, known as the Balloon-Windkessel model [19]. We found prominent stimulus-induced decrease of BOLD variance and a negative correlation between the relative change of trial-averaged BOLD responses and the relative change of trial-by-trial BOLD variance, as reported empirically by [3]. This supports a previous conclusion [3] that the observed BOLD variability reduction is unlikely to be an effect of the nonlinearities in the hemodynamic response but rather is likely due to the underlying synaptic activity.
the present model is due to the low-pass filtering of the hemodynamic model that suppresses the fluctuations frequencies above 1 Hz. Indeed, consistent with previous empirical observa-tions using human ECoG recordings [7], the present model shows a prominent task-induced decrease of synaptic variance for frequencies>1Hz, but, for frequencies<1Hz, this is mostly evident in directly activated brain regions only. This suggests that the present dynamic mean field model might be too simple to reconcile these two features and should be extended to consistently reproduce the change of spectral power in both synaptic and BOLD activities. Another alternative is that the hemodynamic model needs to be refined to completely describe the neurovascular coupling between the BOLD signal and the synaptic activity at different fre-quencies. Indeed, experimental evidence shows that BOLD fluctuations correlate with broad-band LFP signals and that the alpha (8–12 Hz), beta (18–30 Hz), and gamma (40–100 Hz)
LFP bands were informative about the spontaneous BOLD signals from an individual brain area [32].
Mechanism of variability reduction in the stimulus-evoked activity
The mechanism underlying stimulus-induced decrease of neural variability has been recently studied in theoretical works. Among the proposed mechanisms, spontaneous multi-stability has received much attention [5,33,34]. Under this scenario, the spontaneous activity of local neural networks with an underlying clustered connectivity is highly variable due to transitions through multiple spontaneous states. These transitions render the spontaneous activity more heterogeneous, but are suppressed when a stimulus stabilizes the network in a single evoked state and, as a result, the variability decreases in the stimulus-driven activity. This scenario naturally predicts an important feature of spontaneous activity, namely that the different spontaneous states are similar to the stimulus-evoked states [35,36], a phenomenon reported in studies of neuronal membrane potentials and spiking activity at the microcircuit level [10,
25] and in resting-state fMRI studies at large-scale network level [26,37–40]. By contrast, in the present study, the reduction of variability is due to single node synaptic dynamics (Fig 1) without the need of multi-stability originating from clustered connections. We showed that variance decrease results from nonlinearities and local E-I connectivity (seeS1 Text). When the local nodes interact through long-range connections a pattern of stimulus-induced vari-ance reduction is observed as a result of direct and indirect inputs—a phenomenon that is
expected for a large variety of connectivities, as soon as large-scale recurrent connections do not strongly dominate (S2 Fig). The model for local nodes presented herein is a mean-field model that describes the mesoscopic dynamics of synaptic activity. This model can be
extended by introducing multi-stability in the local dynamics, a direction that requires further investigation.
Rest vs. task functional connectivity
In the present data and model the functional connectivity is only slightly changed between rest and task. Several studies have reported high similarity between resting and task-related func-tional connectivity [37–40]; however, other studies have demonstrated reorganization of
func-tional networks during task performance [41–43]. Brain dynamics might be engaged into task activity through diverse mechanisms. Here we modeled task-driven activity by imposing sets of inputs that co-activate different brain regions. There are other possible models for task effects on the brain, such as neuromodulation-mediated changes of network parameters that modify the neural excitability, the synaptic efficacy, or the gating of inputs. How these mechanisms alter the statistics of task-driven activity in a large-scale model have only recently been exam-ined and awaits further investigation [44–46].
Time-varying inputs
Finally, we here focused on the effect of imposing a stationary input to the large-scale brain model. A natural extension of the present work would be to study the effect of time-varying (sinusoidal) inputs and compute the frequency-dependent response function of different net-work statistics. Considering an input of small amplitude would allow to linearize the response and to study the eventual resonances. Moreover, these resonances may be partly determined by transmission delays, given by the experimental distance matrix between the different brain regions, a scenario that is not consider in the present work.
Conclusion
In conclusion, we have shown that the stimulus-driven shrinkage of cortical activity space can be understood as a property of mesoscopic dynamics embedded in large-scale brain networks, a property that has important implications for information processing.
Methods
Ethics statement
This research was conducted in agreement with the Code of Ethics of the World Medical Asso-ciation (Declaration of Helsinki) and informed consent was obtained from all subjects before performing the study, in accordance with institutional guidelines. The study design was approved by the Human Studies Committee of Washington University in St. Louis and the local Ethics Committee of Lausanne University.
Empirical fMRI data collection and analysis
Blood-oxygen-level dependent (BOLD) fMRI data (4x4x4 mm3voxels, TE 25 ms, TR 2.16 s) were acquired in 17 normal right-handed young adults (9 females, age 18–27 years) using a 3T
Siemens Allegra MR scanner. All subjects gave informed consent in accordance with guidelines set by the Human Studies Committee of Washington University in St. Louis. Each subject com-pleted 8 fMRI runs, each 194 frames (~7 min) in duration. They consisted of two alternating run types. The first run type was a resting-state study in which a white crosshair was presented in the center of a black screen. Subjects were instructed to look at the crosshair, remain still, and to not fall asleep. The second run type was a task study in which the identical crosshair was presented, but now it occasionally changed from white to dark gray for a period of 250 ms, at times unpredictable to the subjects, with an inter-stimulus interval of 17.3–30.2 sec. The
sub-jects were instructed to press a button with their right index finger as quickly as possible when they saw the crosshair dim. This data set has been previously used in [3,6,47]. Thirty-three regions of interest (ROIs) covering five cortical networks—the attention, default-mode, motor, saliency and visual networks, as well as the hippocampus, thalamus and cerebellum were defined based on previous task-related functional neuroimaging studies. The preprocessing of the fMRI data and definition of ROIs are described in detail in [3].
Large-scale cortical dynamic mean field model
We used the model of [11] to describe the global dynamics of the whole cortex. This model binds the dynamics ofNlocal nodes, composed of excitatory—inhibitory subnetworks (E—I
and there are given by:
ui ðEÞ¼
I0;EþwEESi ðEÞþ
GX
j
CijS ðEÞ
j wEI;iSi ðIÞþ
Iext;i; ð6Þ
ui ðIÞ¼I
0;IþwIESi
ðEÞ w
IISi
ðIÞ; ð7Þ
ri ðEÞ¼
FEðui
ðEÞÞ ¼ aEuiðEÞ bE
1 expð d
EðaEuiðEÞ bEÞÞ
; ð8Þ
ri ðIÞ¼
FIðui
ðIÞÞ ¼ aIui
ðIÞ b
I
1 expð d
IðaIuiðIÞ bIÞÞ
; ð9Þ
dSiðEÞ
dt ¼ SiðEÞ
tE þ ð1 Si ðEÞÞg
ri
ðEÞþbZðEÞ
i ðtÞ; ð10Þ
dSi ðIÞ
dt ¼ Si
ðIÞ
tI þri
ðIÞþbZðIÞ
i ðtÞ; ð11Þ
whereSEi;Idenotes the average excitatory or inhibitory synaptic gating variable (i.e., fraction of
open channels) at the local areai(i2[1,. . .,N]). In Eqs10and11ZiðEÞðtÞandZðiIÞðtÞare
uncor-related Gaussian noises and the noise amplitude at each node isβ= 0.01.riE;Idenotes the
popu-lationfiring rate of the excitatory (E) or inhibitory (I) population in the brain areai. The populationfiring rates are sigmoid functions (FIandFE) of the input synaptic currents to the excitatory or inhibitory populationiis given byuEi;I. Synaptic currents are the sum of i) local
currents within the local E—I networks, ii) excitatory currents from the other local nodes, and
iii) external inputsIext. The local currents in nodeiare the sum of constants inputs to excit-atory and inhibitory populations, notedI0,EandI0,I, respectively, local excitatory-to-excitatory currentswEES
ðEÞ
i , local inhibitory-to-excitatory currentswEI;iS ðIÞ
i , local excitatory-to-inhibitory
currentswIES ðEÞ
i , and local inhibitory-to-inhibitory currentswIIS ðIÞ
i . The weights of these local
connections are given by:wEE= 0.21;wIE= 0.15;wII= 1; and the feedback inhibition weight, wEI,i, is adjusted for each nodeiso that thefiring rate of the local excitatory neural population is clamped around 3Hz, whenever nodes are connected or not—this regulation is known as
Feedback Inhibition Control (FIC) and the algorithm to achieve it is described in [11]. It has been shown that the FIC constrain leads to a better prediction of the resting functional connec-tivity and a more realistic network evoked acconnec-tivity [11]. Local E—I networks interact through excitatory connections given by theN-by-Nanatomical connectivity matrix, notedC. The con-nectivity matrix is scaled by a single global parameter,G, that changes the network from weakly to strongly connected and determines the dynamical state of the system. As shown in [11] the model has one single stablefixed point of lowfiring activity in all cortical areas, for all values of Gwithin the region where the FIC regulation can be achieved. For larger values of G, long-range interactions are too strong to be compensated by FIC and the activity diverges. Finally, Iextrepresents external stimulation for simulating task evoked activity: it is zero for all neural populations under resting state condition, andIext>0 for those populations excited in the task condition.
The values of all parameters are taken from [11] and are presented inS1 Table.
Structural connectivity matrix
Neuroanatomical structure was obtained using Diffusion Spectrum Imaging (DSI) data and tractography from five healthy right-handed male human subjects [12]. The grey matter was subdivided into 998 regions of interest (ROIs) which are grouped into 33 cortical regions per hemisphere (66 areas in total) according to anatomical landmarks (S2 Table). White matter tractography was used to estimate the fiber tract density connecting each pair of ROIs, aver-aged across subjects. Anatomical connectivity among the 66 cortical regions was calculated by summing all incoming fiber strengths to the corresponding ROIs of the target region, and dividing it by its region-dependent number of ROIs, resulting in a non-symmetric connectivity matrix. This normalization by the number of ROIs—which have approximately the same sur-face on the cortex, i.e. the same number of neurons—is required because neuronal activity is
sensitive to the number of incoming fibers per neuron in the target region. As the dynamical model of one region already takes into account the effect of its internal connectivity (see below), the connection of a region to itself was set to 0 in the connectivity matrix for the simulations.
Linear noise approximation
In the following we derive approximated equations for the statistics of the gating variables and the synaptic activity. To estimate the network’s statistics, we assume that the noise is
suffi-ciently weak so that the state variables fluctuate around their mean value and, by linearizing the equations, we concentrate on linear fluctuations. In this way, we express the system of sto-chastic differential Eqs (6–11) in terms of the first- and second-order statistics of the distribu-tion of synaptic gating variables:mðimÞ, the expected mean gating variable of a given local neural
population of typem(wherem = EorI) of the cortical areai, andPðijmnÞ, the covariance between
gating variables of neural populations of typemandnof local cortical areasiandj, respec-tively. The statistics are defined as:
mðimÞðtÞ ¼ S ðmÞ i ðtÞ
D E
; ð12Þ
PijðmnÞðtÞ ¼ S ðmÞ
i ðtÞ m
ðmÞ i ðtÞ
h i
SðjnÞðtÞ m ðnÞ j ðtÞ
h i
D E
; ð13Þ
where the angular brackets<.>denote the average over realizations or“trials”. Note that, for
the model, a“trial”means a realization of the system of differential Eqs (6–11). In vector form, the system of equations writes:
d dt
~SðEÞ
~SðIÞ
!
¼ f
ðEÞ ~SðEÞ;~SðIÞ
fðIÞð~SðEÞ;~SðIÞÞ
!
þ~ZðtÞ; ð14Þ
where~S¼~SðEÞ;~SðIÞ
¼ Sð1EÞ;. . .;S
ðEÞ N ;S
ðIÞ
1 ;. . .;S
ðIÞ N
n o
,~Zis uncorrelated Gaussian noise,
fi
ðEÞ ~SðEÞ;~SðIÞ
¼ Sð EÞ i
tE þ ð1 Si ðEÞÞg
FðEÞðui
ðEÞÞ, andf i
ðIÞ ~SðEÞ;~SðIÞ
¼ Sð IÞ i
tI þF
ðIÞð
ui ðIÞÞfor
i= 1,..,N.
In the following we use a linear approximation of the fluctuations. As shown in [11], Taylor expanding~Saround~m ¼~S
, i.e.SðimÞ¼m ðmÞ
i þdS
ðmÞ
i , up to thefirst order, we obtain the
around the mean. For the mean values:
dmðiEÞ
dt ¼ d dt ~S
ðEÞ i
D E
¼ m
ðEÞ i
tE þ ð1 mi ðEÞÞg
FEðui
ðEÞÞ; ð15Þ
dmðiIÞ
dt ¼ d dt ~S
ðIÞ i
D E
¼ m
ðIÞ i
tI þFIðui
ðIÞÞ; ð16Þ
whereui(m)is the mean input current to the neural populationm=E,Iof cortical areai, defined as:
~u¼ ~u
ðEÞ
~uðIÞ
!
¼W~Sþ~I0þ~Iext; ð17Þ
whereWis a block matrix defined as:
W¼ wEEINþG:C Dð~wEIÞ wIEIN wIIIN
" #
;
whereCis theNxNanatomical matrix,Gthe global coupling parameter,INis theNxNidentity matrix,Dð~wEIÞis aNxNdiagonal matrix containing the weights of the feedback inhibitionwEI,
ias diagonal elements, and~I0and~Iextare the vectors containing the constant and external
inputs.
LetPbeing the covariance matrix between gating variables~S.Pis a block matrix defined as:
P¼ P
ðEEÞ PðEIÞ
PðIEÞ PðIIÞ
" #
:
The differential equation of the covariance matrix is [11]:
dP
dt ¼APþPA
T
þQn; ð18Þ
where the superscriptTis the transpose,Qnis the covariance matrix of the noise, given by
Qn¼~ZðtÞ~ZðtÞT
, andAis the Jacobian matrix given byfirst-order partial derivative of the nonlinear functionfwith respect to each variableS, evaluated at~m.Ais a block matrix defined as:
A¼ A
ðEEÞ AðEIÞ
AðIEÞ AðIIÞ
" #
;
where
AðijmnÞ¼
@fiðmÞð~mÞ
@SðjnÞ
( )
:
Note that the Jacobian matrix depends on the point~mat which it is evaluated.
The synaptic input variables~uare a linear combination of the gating variables~Sand, thus, covariance matrix between synaptic input variables~uis given by:
Cv¼WPWT: ð19Þ
Knowledge of the Jacobian matrix and the stationary covariance gives the stationary autoco-variance of the gating variables~S, defined as the covariance of the process with itself at pairs of time points and given as:
FSðtþt;tÞ ¼ ~SðtþtÞ ~mðtþtÞ~
SðtÞ ~mðtÞ
T
D E
: ð20Þ
In the stationary regimeFS(t+τ,t) depends only onτand is given by:
FSðtÞ ¼etAF
Sð0Þ ¼e
tAP; ð21Þ
where the exponential matrix is defined as:
etA¼IþtAþ1 2!ðtAÞ
2
þ1 3!ðtAÞ
3
þ. . . ð22Þ
The stationary autocovariance of the synaptic input variables~uis, thus, given by:
FuðtÞ ¼WFSðtÞWT: ð23Þ
The autocorrelation function (ACF) of thei-th synaptic input variable is given by:
ACFiðtÞ ¼Fu;iðtÞ=Fu;ið0Þ: ð24Þ
Finally, the power spectral density (PSD) of fluctuations around the fixed points is also determined by the Jacobian matrix. The cross-spectrum of the gating variables~Sis given as [11]:
PSðoÞ ¼d~SðoÞd~SðoÞy
¼ðAþioÞ 1Qn AT io 1
; ð25Þ
whered~SðoÞis the Fourier transform ofd~SðtÞand the superscript†is the conjugate transpose.
The cross-spectrum of the synaptic input variables~uis, thus, given by:
PuðoÞ ¼d~uðoÞdu~ðoÞy
¼WPSðoÞWy: ð26Þ
The PSD of synaptic activity as a function of the frequencyωis given by the diagonal of ∏u(ω).
Note that the different network’s statistics (variances, covariances, and PSD) are determined
by the Jacobian matrixAthat depends on the state of the nonlinear system (the elements of the
Aare derivatives evaluated at~m). Because the application of an external input changes the state of the system, therefore changing the derivatives, the network’s statistics are also changed. In other words, the nonlinear nature of the system renders the network’s statistics
state-dependent.
In summary, to get the stationary network’s statistics we simulated the deterministic Eqs
(15–18) and, once the stationary values of the mean synaptic gating variables (~m), the covari-ance matrix (P), and the Jacobian matrix (A) were reached all other statistics were computed using Eqs19–26. All differential equations used in the present study were solved using the Euler’s method with a time step equal to dt= 0.1 ms. The total number of simulation steps was
Differential entropy
Once we have obtained the linear prediction of the covariance we can estimate the extent of all possible configurations of the network given by the differential entropyH, which expresses the entropy of a continuous variable withn-dimensional probability density function (p.d.f.)f, and writes:
HðfÞ ¼
ð
D
fð~xÞlnfð~xÞd~x; ð27Þ
whereD2Rnis the support set off, i.e.,D= {x|f(x)>0}. The entropy is related to the spread
of the p.d.f., i.e., it relates to the volume occupied by a continuous random variable. The volume of the support setDis defined as:
VolðDÞ ¼
ð
D
dx1dx2. . .dxn: ð28Þ
The volume of the smallest set that contains most of the p.d.f is approximately 2nH(f)[48]. Thus, low entropy implies that the random variable is confined to a small effectiven -dimen-sional volume and high entropy indicates that the random variable is widely dispersed.
For an-dimensional normal distribution (μ,∑) with covariance matrix∑, the differential entropy in bits is given by the following form [48]:
H¼12ln½ð2peÞndetð ÞS lnð2Þ ¼ n
2lnð2Þð1þlnð2pÞÞ þ 1
2lnð2ÞdetðSÞ; ð29Þ
where det(S) is the determinant of the covariance matrix. We also calculated the differential entropy for the fMRI time-series used in [3]. For these empirical data we used two different cal-culations of the differential entropy. Thefirst measure assumes that the data follows an -dimensional multivariate normal distribution (n= 33) and is given by,first, estimating the covariance matrix of the fMRI signals for each subject (averaged across runs of the same condi-tion, rest or task), notedS^, second, calculating the determinant ofS^as the product of thek non-zero singular values (λ) to elude singularity, and,finally, calculating the entropy as fol-lows:
H¼2 k
lnð2Þð1þlnð2pÞÞ þ 1
2lnð2Þ
Xk
j¼1
lnðljÞ: ð30Þ
For 16/17 subjects we found thatk= 29 for both rest and task. For only one subject we found thatk=n= 33 for both rest and task. As a second measure we used the Nilsson-Kleijn non-parametric estimator that does not assume normality and calculates the differential entropy based on nearest neighbors of a sample set [49]. Both ways of calculating the differen-tial entropyHgave very similar results: the values ofHobtained using the two methods were highly correlated (rc= 0.91 for rest data andrc= 0.90 for task data).
Relative entropy
Following [50], we defined the relative entropy as the Kullback-Leibler divergence between the intrinsic noise and the synaptic activity of the network. In its general form the Kullback-Leibler
divergence between two distributionsfandgis defined as:
KLD¼
ð flnf
g: ð31Þ
The intrinsic noise and the synaptic activity are normally distributed (seeS3 Fig) and, in this case, it can be shown that the relative entropy between the intrinsic noise and the synaptic activity writes [50]:
KLDð~u;~ZÞ ¼1
2 traceðQ
1
n CvÞ ln
detðCvÞ
detðQnÞ
2N
=
lnð2Þ: ð32ÞThe relative entropy can be seen as the amount of uncertainty that is produced by the dynamical system.
Supporting Information
S1 Text. Appendix: Isolated node case.
(PDF)
S1 Table. Parameters of dynamic mean-field model.
(DOC)
S2 Table. Names and abbreviations of the brain regions considered in the human connec-tome from Hagmann et al. (2008) (in alphabetical order).
(DOC)
S1 Fig. Effect of an external input onσE2for an isolated E-I node. A:transfer functions of
the E and I populations,FE(uE) andFI(uI), and their derivatives,F0EðuEÞandF
0
IðuIÞ. The cir-cles indicate the corresponding values in the spontaneous condition (Iext= 0).B:s2Eas a func-tion ofIext, using the solution given by the linear noise approximation (equation A19, seeS1
Text) and using the approximated expression in equation A20 (seeS1 Text). Parameters:wEE= wIE= 0.15.C:The spontaneous excitatoryfiring rate (rE0) is shown in color-code in the param-eter space {wEE,wIE}. For all tested couples of parameters {wEE,wIE}, except for the parameter region delimited by the white lines,s2
Eis a decreasing function ofIext. The insets show the dependence ofs2
EonIextfor two points of the parameter space (green:wEE= 0.2,wIE= 0.15; orange:wEE= 0.6,wIE= 1.15).
(TIF)
S2 Fig. Response of modular networks.The response of the large-scale model was examined
populations. We found a graded negative relation betweenΔm andΔσ2for nearly random and
moderately clustered connectivities, but this relation does not hold for highly clustered connec-tivities.
(TIF)
S3 Fig. Distribution of synaptic activity.The joint density distribution of the simulated excit-atory synaptic activity from two example model brain regionsxandyis shown in color code during spontaneous (left) and evoked (right) conditions. The data was obtained by simulating the large-scale model using the system of stochastic differential Eqs (6–11), with noise intensity equal toβ= 0.01. The individual distributions ofxandy(empty bars) are excellently fitted by Gaussian distributions (solid gray lines).
(TIF)
S4 Fig. Entropy and relative entropy under correlated noise. A:As inFig 6, we calculated the differential entropy (H) and the relative entropy (KLD), but using different random non-diago-nal noise covariance matrices and fixing the stimulation pattern (the brain regions receiving the external input are: r/lLOCC, r/lMT, r/lPCAL, r/lST). In this analysis, we constructed non-diagonal random noise covariance matrices by, first, generating 500 realizations of a multivari-ate2N-dimensional Gaussian process with diagonal covariance equal toQn= (βdt)2I2N, thus
obtaining 2Ntime series of 500 steps, and, second, the sample covariance of these time series was calculated and used as a random non-diagonal (due to sample errors) noise covariance. We found that the evoked synaptic activity has lower differential entropy (B) and lower relative entropy (C) than the spontaneous activity, for both excitatory (blue) and inhibitory (green) synaptic activity. Parameters:N= 66,β= 0.01, dt= 0.1 ms.
(TIF)
S1 Dataset. BOLD fMRI data (TR 2.16 s) acquired in 17 subjects.Each subject completed 8
fMRI runs (4 rest runs and 4 task runs). Each run has 194 frames. The ASCII fileRest_fMRI containsTrows corresponding to all frames for all runs and all subjects in the rest condition (T= 194×4×17). It hasN+1 columns: columns 1–Ncorrespond to the BOLD activity for each
of theNROIs and the last column indicates the subject number (N= 33). The ASCII file Task_fMRIcontainsTrows corresponding to all frames for all runs and all subjects in the task condition (T= 194×4×17). It hasN+2 columns: columns 1–Ncorrespond to the BOLD activity for each of theNROIs, columnN+1 indicates the subject number, and a value 1 in columnN +2 indicates the onset of the stimulus. For each run the first 4 volumes were removed. The labels of the brain regions are contained in file33ROIs_labels.txt.
(ZIP)
S2 Dataset. The ASCII fileStruct_Conncontains the 66-by-66 structural connectivity
matrix, obtained using Diffusion Spectrum Imaging (DSI) data and tractography from five healthy right-handed male human subjects [12].The labels of the brain regions are contained in file66ROIs_labels.txt.
(ZIP)
Acknowledgments
We thank M. E. Raichle for sharing the fMRI dataset.
Author Contributions
Conceived and designed the experiments: BJH PH. Performed the experiments: BJH PH. Ana-lyzed the data: APA BJH. Wrote the paper: APA BJH GD. Built the Model: APA and GD.
References
1. Monier C, Chavane F, Baudot P, Graham LJ, Fregnac Y. Orientation and direction selectivity of synap-tic inputs in visual corsynap-tical neurons: a diversity of combinations produces spike tuning. Neuron. 2003; 37: 663–680. PMID:12597863
2. Churchland MM, Yu BM, Cunningham JP, Sugrue LP, Cohen MR, Corrado GS, et al. Stimulus onset quenches neural variability: a widespread cortical phenomenon. Nat Neurosci. 2010; 13(3): 369–378. doi:10.1038/nn.2501PMID:20173745
3. He BJ. Spontaneous and task-evoked brain activity negatively interact. J Neurosci. 2013; 33(11): 4672–4682. doi:10.1523/JNEUROSCI.2922-12.2013PMID:23486941
4. He BJ, Zempel JM. Average is Optimal: An Inverted-U Relationship between Trial-to-Trial Brain Activity and Behavioral Performance. PLoS Comput Biol. 2013; 9: e1003348. doi:10.1371/journal.pcbi. 1003348PMID:24244146
5. Ponce-Alvarez A, Thiele A, Albright TD, Stoner GR, Deco G. Stimulus-dependent variability and noise correlations in cortical MT neurons. Proc Natl Acad Sci USA. 2013; 110: 13162–13167. doi:10.1073/ pnas.1300098110PMID:23878209
6. He BJ. Scale-Free Properties of the Functional Magnetic Resonance Imaging Signal during Rest and Task. J Neurosci. 2011; 31: 13786–13795. doi:10.1523/JNEUROSCI.2111-11.2011PMID:21957241
7. He BJ, Zempel JM, Snyder AZ, Raichle ME. The temporal structures and functional significance of scale-free brain activity. Neuron. 2010; 66: 353–369. PMID:20471349
8. Poulet JF, Petersen CC. Internal brain state regulates membrane potential synchrony in barrel cortex of behaving mice. Nature. 2008; 454: 881–885. doi:10.1038/nature07150PMID:18633351
9. Oram MV. Visual stimulation decorrelates neuronal activity. J Neurophysiol. 2011; 105: 942–957. doi:
10.1152/jn.00711.2009PMID:20861439
10. Luczak A, Bartho P, Harris KD. Spontaneous events outline the realm of possible sensory responses in neocortical populations. Neuron. 2009; 62: 413–425. PMID:19447096
11. Deco G, Ponce-Alvarez A, Hagmann P, Romani GL, Mantini D, Corbetta M. How local excitation— inhi-bition ratio impacts the whole brain dynamics. J Neurosci. 2014; 34(23): 7886–7898. doi:10.1523/ JNEUROSCI.5068-13.2014PMID:24899711
12. Hagmann P, Cammoun L, Gigandet X, Meuli R, Honey C, Wedeen VJ, et al. Mapping the structural core of human cerebral cortex. PLoS Biol. 2008; 6: e159. doi:10.1371/journal.pbio.0060159PMID:
18597554
13. Wong K, Wang X. A recurrent network mechanism of time integration in perceptual decisions. J Neu-rosci. 2006; 26: 1314–1328. PMID:16436619
14. Logothetis NK, Pauls J, Augath M, Trinath T, Oeltermann A. Neurophysiological investigation of the basis of the fMRI signal. Nature. 2001; 412: 150–157. PMID:11449264
15. Thomsen K, Offenhauser N, Lauritzen M. Principal neuron spiking: neither necessary nor sufficient for cerebral blood flow in rat cerebellum. J Physiol. 2004; 560: 181–189. PMID:15272036
16. Viswanathan A, Freeman RD. Neurometabolic coupling in cerebral cortex reflects synaptic more than spiking activity. Nat Neurosci. 2007; 10: 1308–1312. PMID:17828254
17. Rauch A, Rainer G, Logothetis NK. The effect of a serotonin-induced dissociation between spiking and perisynaptic activity on BOLD functional MRI. Proc Natl Acad Sci USA. 2008; 105: 6759–6764. doi:10. 1073/pnas.0800312105PMID:18456837
18. Niedermeyer E, Lopes da Silva F. Electroencephalography: basic principles, clinical applications, and related fields. Philadelphia, PA: Lippincott Williams & Wilkins; 2005.
19. Friston K, Harrison L, Penny W. Dynamic causal modelling. Neuroimage. 2003; 19: 1273–1302. PMID:
12948688
20. Robinson PA, Drysdale PM, Van der Merwe H, Kyriakou E, Rigozzi MK, Germanoska B, et al. BOLD responses to stimuli: Dependence on frequency, stimulus form, amplitude, and repetition rate. Neuro-image. 2006; 31: 585–599. PMID:16466935
21. Deco G, Ponce-Alvarez A, Mantini D, Romani GL, Hagmann P, Corbetta M. Resting-state functional connectivity emerges from structurally and dynamically shaped slow linear fluctuations. J Neurosci. 2013; 33: 11239–11252. doi:10.1523/JNEUROSCI.1091-13.2013PMID:23825427
22. Garrett DD, Kovacevic N, McIntosh AR, Grady CL. Blood oxygen level dependent signal variability is more than just noise. J Neurosci. 2010; 30: 4914–4921. doi:10.1523/JNEUROSCI.5166-09.2010
PMID:20371811
![Fig 8. Reduction of the cortical activity space. A: The excitatory synaptic activity of three brain regions, in spontaneous (blue) and task (red) conditions, is plotted in a three-dimensional space: each dot represents the vector X i,j,k (t) = [x,y,z], whe](https://thumb-eu.123doks.com/thumbv2/123dok_br/17080460.235953/13.918.67.701.116.437/reduction-cortical-activity-excitatory-spontaneous-conditions-dimensional-represents.webp)
