The New Development Bank
in the Global Financial Architecture
A. Morozkina
Alexandra Morozkina – PhD student, National Research University Higher School of Economics; Head of structural reforms division in Economic Expert Group; Vetoshny per., 5/4, 109012 Moscow, Russian Federation; E-mail: [email protected]
This article addresses the question of whether the New Development Bank (NDB) will promote the role of the BRICS countries of Brazil, Russia, India, China and South Africa in the global financial architecture and foster their development. It begins by comparing the key multilateral development banks (the World Bank, the Asian Development Bank, the African Development Bank and the Inter-American Development Banks, the European Bank for Reconstruction and Development) and the national development banks of the BRICS countries with the newly established institution. The purpose of the NDB is to mobilize resources for infrastructure and sustainable development projects in the member countries. This purpose, as determined by the analysis in this article, partly duplicates the existing institutions. However, the NDB could add to the functions of the existing institutions and become a significant development bank for member countries. The best way to achieve this goal is to implement multilateral projects in the areas listed above. Second, the article examines the current role of the BRICS countries in the global financial architecture and the potential for their increased participation, which has arisen with the establishment of the NDB. The founding countries will jointly determine the volume and direction of the financial aid to the third countries. In contrast to the Bretton Woods institutions, the BRICS countries could change the rules of development aid, in particular, the conditions and systems for monitoring results. The article concludes that the BRICS countries have the potential to change the current system of development finance and therefore to increase the role of the BRICS countries in the global financial architecture.
Key words: BRICS, New Development Bank, development finance, global financial architecture, sustainable development, Bretton Woods institutions
Financial and economic issues have been among key items of the agenda of the BRIC group of Brazil, Russia, India and China, and have remained when South Africa joined to form the BRICS. Since its first meeting, the group has been interested in changing the global finan-cial architecture. That architecture is “a loose set of multilateral agreements and understan-dings, among a core group of powerful capitalist states, about the rules and norms that govern, and/or should govern, cross-border money and credit transactions of all kinds” [Armijo, 2002, p. 3]. Given the existing system of multilateral financial institutions, the establishment of the New Development Bank (NDB) by the BRICS will have an impact on that global financial architecture.
newly established bank should not compete with existing institutions and cooperation
mecha-nisms, and many existing institutions consider it a competitor [Central Asia Monitor, 2013].
This question is easily resolved, however, by comparing the NDB’s activities as specified in its establishing agreement with the activities of existing institutions and mechanisms. There are identifiable spheres of possible duplication and complementarity.
According to the agreement establishing the NDB, the purpose of the institution is to “mobilize resources for infrastructure and sustainable development projects in BRICS and other emerging economies and developing countries, complementing the existing efforts of multilateral and regional financial institutions for global growth and development … It shall also cooperate with international organizations and other financial entities, and provide tech-nical assistance for projects to be supported by the Bank” [BRICS, 2014]. To compare, the purpose of the Asian Development Bank (ADB), similar to that of the African Development Bank (AfDB) and the Inter-American Development Bank (IADB), is to “contribute to the ac-celeration of the process of economic development of the developing member countries in the region, collectively and individually” [ADB, 1965, art. 1; see also AfDB, 2011; IADB, 1996]. The purpose of European Bank for Reconstruction and Development (EBRD) is to “foster the transition towards open market-oriented economies and to promote private and entrepreneurial initiative in the Central and Eastern European countries committed to and applying the princi-ples of multiparty democracy, pluralism and market economics” [EBRD, 2013, p. 4].
Multilateral financial institutions are an important part of the global financial architec-ture. They finance development and sustainability and provide technical assistance and ad-visory services to the member countries. Key multilateral financial institutions are the World Bank, the ADB, the AfDB, the IADB and the EBRD. They finance projects in the energy sec-tor (26.8% of ADB loans, 16% AfDB loans, 21% EBRD loans), in public management (26.2% of World Bank loans), in transport infrastructure and communication (24.5% of ADB loans, 33.2% of AfDB loans, 17.6% of World Bank loans, 20% of EBRD loans, 20.2% of IADB loans), and health care and social security (14.3% of World Bank loans, 14.9% of IADB loans (see Table 1). This corresponds to the national priorities of the BRICS countries, which include the development of the human capital (education, health care and social security), agriculture, infrastructure, public management, environmental and energy efficiency, and innovation. Thus projects in those priority areas could be financed under the current framework. The specific feature and contribution of the NDB could be an opportunity to involve experts and equip-ment from the BRICS countries, in contrast to projects financed by the International Monetary Fund (IMF) or the World Bank, which usually deploy resources from western countries.
Table 1: Multilateral Development Bank Loan Portfolios by Sector, %, 2013
ADB AfDB EBRD IADB World Bank
Agriculture and natural resources 5.0 12.3 16.0 4.2 6.9
Education 3.7 5.2 – 5.4 8.9
Energy 26.8 16.0 21.0 3.8 7.5
Finance 14.2 8.1 28.0 14.9 6.7
Health care and social security 2.6 4.2 – 16.4 14.3
Industry and trade 0.3 0.0 15.0 8.8 4.7
Public management 5.7 – – 16.7 26.2
ADB AfDB EBRD IADB World Bank
Water supply and other municipal infrastructure and services
9.1 8.4 – 9.5 7.3
Multisector 8.0 12.6 – – –
Total 100 100 100 100 100
Note: Numbers may not add up to 100% because of rounding.
Sources: Asian Development Bank (ADB) [2013], African Development Bank (AfDB) [2013], European Bank for Reconstruction and Development (EBRD) [2013], Inter-American Development Bank (IADB) [2013], World Bank [2013], and Leonid Grigoriev and Alexandra Morozkina [2012].
The BRICS countries are not the only borrowers and members of multilateral develop-ment banks. Therefore, there is a question of whether the BRICS countries receive any assist-ance from these institutions. They are large borrowers from the World Bank. India and China are most active (8.3% and 9% of the World Bank’s loan portfolio in 2013 was allocated to these countries). Brazil is slightly behind (8%); loans to Russia and South Africa amount to signifi-cantly lower sums, although they also use this opportunity to fund development projects in pri-ority fields. Loans to Russia and South Africa in 2013 accounted for 1% and 0.9% respectively of the total loan portfolio (see Table 2).
Table 2: World Bank Loan Portfolio by Country, %, 2013
A rg en tina Br a zil China Colum bia Egypt Ind ia Indone sia Ka zakhstan Me xic o Mor o cc o P eru Philippine s P oland
Romania Russia Sout
h Afric a T urk ey Ukr aine Ot her T ota l
4.1 8.0 9.0 5.3 2.3 8.3 7.3 1.9 10.4 2.4 1.3 2.3 4.7 2.4 1.0 0.9 9.0 2.3 17.4 100
Source: World Bank [2013b]
China and India are also members and the largest borrowers of the Asian Development Bank. Loans to China amount to 26.2% of its loan portfolio in 2013; loans to India were 22.8% (see Table 3). In 2013, the ADB approved 12 projects in China with a total volume of $1.54 bil-lion. Funds were allocated to projects in different sectors such as natural resources and agricul-ture, energy, transport, and urban and social infrastructure. The ADB thus contributes to the financing and realization of projects in priority sectors in China. These sectors are highlighted in “12th Five-Year Plan for 2011–2015,” which states as priorities economic growth, reorienta-tion of domestic demand, environment protecreorienta-tion and clean energy, agriculture, human de-velopment, social support, public management [National People’s Congress of the People’s Republic of China, 2011]. The ADB is, in fact, financing projects in energy sector, agriculture and social sphere.
Table 3: Asian Development Bank Loan Portfolio by Country, %, 2007–2013
2007 2008 2009 2010 2011 2012 2013
China 24.4 23.6 23.1 23.5 24.4 24.9 26.2
India 16.5 18.0 18.7 20.4 21.1 21.8 22.8
Indonesia 31.2 28.3 24.0 22.5 20.1 18.1 16.2
Pakistan 9.2 12.1 11.3 11.4 11.0 9.9 9.3
Philippines 11.1 10.9 11.9 10.7 9.9 10.0 7.7
Vietnam 0.6 0.5 2.0 2.2 2.8 3.1 4.1
Bangladesh 1.3 1.4 2.9 3.0 2.9 3.1 3.1
Other 5.7 5.1 6.0 6.3 7.7 9.2 10.7
Total 100 100 100 100 100 100 100
Note: Numbers may not add up to 100% due to rounding.
Source: Asian Development Bank [2007–2013].
South Africa is a large customer of the African Development Bank. Loans to this country amounted to 26.7% of its portfolio in 2013 (see Table 4). Projects in the financial sector account for about two thirds of total loans and infrastructure projects about one fifth. These two sectors correspond to South Africa’s long-term priorities of the reduction of poverty and inequality set out in its “National Development Plan 2030: Our Future – Make It Work” [National Planning Commission, 2012].
Table 4: African Development Bank Loan Portfolio by Region, %, 2007–2013
2007 2008 2009 2010 2011 2012 2013
North Africa 23.1 26.1 14.1 35.2 44.1 48.9 40.2
West Africa 9.8 19.3 16.2 16.6 5.9 3.4 13.2
Southern Africa excluding South Africa 7.4 8.6 22.1 2.7 20.6 1.2 10.9
Central Africa 16.8 2.4 3.7 7.0 4.2 2.8 2.2
East Africa 22.5 18.1 6.9 16.8 3.8 2.1 2.2
South Africa 13.0 6.5 23.2 12.1 14.9 36.5 26.7
Multinational 7.5 19.0 13.8 9.6 6.5 5.1 4.5
Total 100 100 100 100 100 100 100
Note: Numbers may not add up to 100% due to rounding.
Source: African Development Bank [2007–2013].
Increase in income per capita and inclusiveness in South Africa is achieved mainly by developing projects in financial sector, such as support for small and medium-sized enterprises (SMEs). Projects in the infrastructure sector (energy, transport, communications, water supply, etc.) directly influence the quality of life.
including agriculture (a loan to salad producer Belaya Dacha, a share in the Khlebprom con-fectionary), banking industry (syndicated loan to Rosbank), energy (financing the develop-ment of the heating system in the Sakha Republic), private sector (investdevelop-ments in private equity funds operated by Baring Vostok in Russia and members of the Commonwealth of Independ-ent States), transport (loan to the Servisnaya Holdingovaya Kompaniya, which provides infor-mation technology services; co-financing the western high-speed diameter of St. Petersburg), science and education (syndicated loan to the Pulkovo technopark), health care (loan to the Geropharm-Bio pharmaceutical company). Some of these projects correspond to Russia’s na-tional priorities on health care, education and agriculture, as announced in 2005 [Putin, 2005]. Some of the measures taken are financed from the federal budget, but could also be financed by development banks, including regional and national banks.
Table 5: European Bank for Reconstruction and Development Loan Portfolio by Region and Country, %, 2007–2013
2007 2008 2009 2010 2011 2012 2013
Central Asia 11.1 11.3 7.2 10.8 5.2 9.8 6.5
Central Europe and Baltic countries 9.8 6.4 21.0 16.5 15.3 13.6 18.9
Eastern Europe and Caucasus 20.1 25.8 18.4 17.4 20.5 16.8 17.8
Russia 41.1 35.7 30.1 25.6 32.4 28.9 21.4
South-Eastern Europe 17.9 20.8 21.4 24.2 16.9 17.1 19.4
Turkey N/A N/A 1.9 5.5 9.8 11.8 10.8
Southern and Eastern Mediterranean N/A N/A N/A N/A N/A 2.0 5.3
Total 100 100 100 100 100 100 100
Source: European Bank for Reconstruction and Development [2007–2013].
Brazil has been among the largest borrowers from the IADB for a long time. Loans to this country amounted to 19.5% of the bank’s portfolio in 2013 (see Table 6). The largest volume in the last five years was allocated to infrastructure development (transport) and amounted to $5.2 billion. The IADB allocated $3.1 billion to modernizing and reforming public manage-ment in Brazil, $2.5 billion to water supply and sanitation, $1.7 billion to financial markets and $1.1 billion to energy. These projects contribute to overcoming the 11 challenges identified by Brazil in the “Multiyear Plan for 2012–2015: Plan More Brazil” [Ministério do Planejamento, 2011]. Among them are national development projects and the eradication of extreme pov-erty, and cover the areas of science, education, culture, sport, health care, social protection, infrastructure, democracy and social inclusiveness, integrity and national security, and public management.
Table 6: Inter-American Development Bank Loan Portfolio by Country, %, 2007–2013
2007 2008 2009 2010 2011 2012 2013
Brazil 25.4 24.6 24.2 23.7 21.8 23.0 19.5
Mexico 9.0 8.6 11.4 13.5 14.1 15.0 18.6
Argentina 16.6 15.7 15.6 15.4 15.2 16.1 16.9
Columbia 9.4 10.5 10.2 9.9 9.8 10.4 11.0
Ecuador 3.8 3.6 3.4 3.3 3.5 3.2 3.7
Dominican Republic 2.6 2.4 2.7 3.1 3.3 3.1 3.6
Guatemala 2.8 2.8 2.9 3.2 3.2 3.0 3.3
Peru 7.8 7.9 6.5 5.9 5.6 5.9 3.1
El Salvador 3.0 3.3 3.3 3.0 3.0 2.7 3.0
Other 19.6 20.6 19.8 19.0 20.4 17.7 17.5
Total 100 100 100 100 100 100 100
Note: Numbers may not add up to 100% because of rounding.
Source: Inter-American Development Bank [2007–2013].
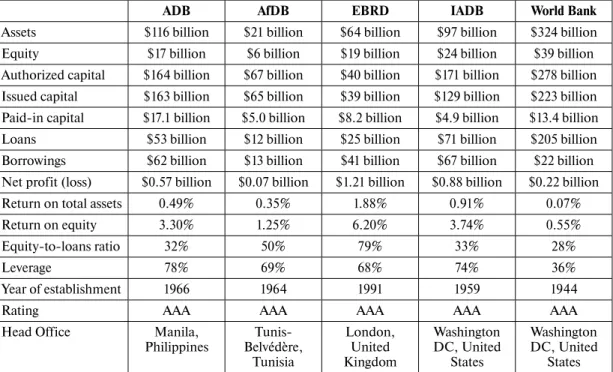
Table 7: Financial and Operational Indicators of the Multilateral Development Banks, 2013
ADB AfDB EBRD IADB World Bank
Assets $116 billion $21 billion $64 billion $97 billion $324 billion
Equity $17 billion $6 billion $19 billion $24 billion $39 billion Authorized capital $164 billion $67 billion $40 billion $171 billion $278 billion
Issued capital $163 billion $65 billion $39 billion $129 billion $223 billion Paid-in capital $17.1 billion $5.0 billion $8.2 billion $4.9 billion $13.4 billion Loans $53 billion $12 billion $25 billion $71 billion $205 billion
Borrowings $62 billion $13 billion $41 billion $67 billion $22 billion Net profit (loss) $0.57 billion $0.07 billion $1.21 billion $0.88 billion $0.22 billion
Return on total assets 0.49% 0.35% 1.88% 0.91% 0.07%
Return on equity 3.30% 1.25% 6.20% 3.74% 0.55%
Equity-to-loans ratio 32% 50% 79% 33% 28%
Leverage 78% 69% 68% 74% 36%
Year of establishment 1966 1964 1991 1959 1944
Rating ААА ААА ААА ААА ААА
Head Office Manila, Philippines
Tunis-Belvédère,
Tunisia
London, United Kingdom
Washington DC, United
States
Washington DC, United
States
Sources: Asian Development Bank (ADB) [2013], African Development Bank (AfDB) [2013], European Bank for Reconstruction and Development (EBRD) [2013], Inter-American Development Bank (IADB) [2013], World Bank [2013], and author’s calculations.
econo-mies in some way duplicates the work of these existing institutions. The NDB could cooperate with the existing institutions, and therefore gain expertise. Also, it could support independent resource mobilization and allocation, including involving experts and ordering equipment from BRICS countries. The NDB could also provide a platform for the inter-regional exchange of expert opinions and development of multilateral projects among the BRICS countries. A list of such projects is being developed by the BRICS Business Council. Its annual report lists industries in each country that could be encouraged to cooperate [BRICS Business Council, 2014]. These companies are in the infrastructure, finance, energy and green economy, human development and manufacturing sectors.
Providing advisory services and technical assistance is another function of the existing in-stitutions. Brazil, India, China and Russia have their own partnership strategies with the World Bank. These documents are based on national strategies and consultations with the country au-thorities (including regional ones) and carefully identify challenges not included in the national strategies. India’s current partnership strategy identifies sustainable, inclusive and integrated growth. China’s partnership strategy includes green growth, regional integration and the devel-opment of international relations. Brazil’s strategy highlights the second-generation issues of energy efficiency and climate change control. Russia’s strategy includes the modernization and reform of the public management system. Thus, partnership with the World Bank resolves some of the BRICS members’ priority issues. The NDB could complement these existing strategies. It could consult not only countries individually but also in groups on common issues such as the middle-income trap issue, inequality and SME support [Grigoriev and Morozkina, 2012; Unger, 2013; Grigoriev and Morozkina, 2013b, a].
Cooperation among national banks is also a part of the global financial architecture. In 2010, the BRICS members’ national development banks actively cooperated. The develop-ment of this cooperation already facilititates the exchange of experience in financing national development projects and making payments in national currencies. At the Sanya Summit in April 2011, the development banks signed the Framework Agreement on Financial Cooperation within the BRICS Inter-Bank Cooperation Mechanism. At the New Delhi Summit in 2012 the national development banks signed the Master Agreement on Extending Credit Facility in Lo-cal Currencies and the BRICS Multilateral Letter of Credit Confirmation Facility Agreement. In 2013 in Durban they signed the BRICS Multilateral Cooperation and Co-financing Agree-ment for Sustainable DevelopAgree-ment, which applies primarily to projects in energy efficiency and green growth. In 2014 the national development banks signed one more agreement – the Cooperation Agreement on Innovation – and now have the opportunity to finance projects jointly in common fields of interest. The BRICS now has a mechanism for mutual financing and therefore for receiving finance from its partners. Given that the primarily goal of the NDB is to mobilize resources to finance projects in infrastructure and sustainable development, the bank can rely in part on mechanisms that are already in place. For example, the members of the boards of the national development banks could be included in the NDB’s board.
Table 8: Loan Portfolios of the BRICS Development Banks, by Sector, %, 2013
Exim Bank CDB DBSA BNDES VEB
Agriculture and natural resources 17.7 2.8 – 8.9 6.1
Education, health care and social security – 0.6 14.4 – 1.1
Energy 26.7 17.9 31.0 7.9 7.3
Finance – 29.1 – – 18.8
Industry and trade – 1.5 – 54.2 28.9
Construction and real estate 38.9 6.1 4.9 1.2 22.7
Transport and communication 12.3 27.3 40.9 26.4 12.8
Water supply and other municipal services – 14.8 8.8 1.3 0.0
Multisector 4.4 – 0.03 – 2.3
Total 100 100 100 100 100
Sources: Author’s calculations based on annual reports [see Brazilian Development Bank (BNDES), 2013; China Development Bank (CDB), 2013; Development Bank of South Africa (DBSA), 2013; Export-Import Bank of India (Exim Bank), 2013; Vnesheconombank (VEB), 2013].
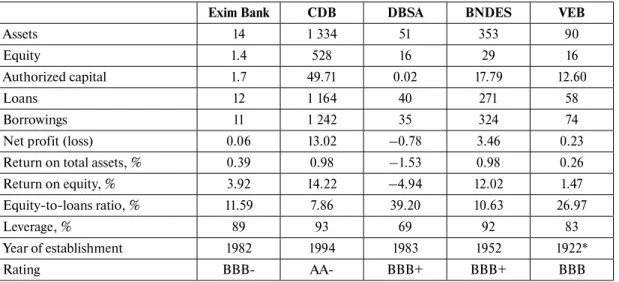
The national development banks have a large potential for lending (see Table 9). The larg-est are the CDB, which loaned in excess of $1 trillion at the end of 2013, and BNDES with loans of $271 billion. These amounts both exceeded the amount loaned by the World Bank. Thus, the NDB should make use of these existing mechanisms of BRICS cooperation for multilateral fi-nancing. Moreover, the national development banks are already cooperate in one priority fields of the NDB – sustainable development.
Table 9: Financial and Operational indicators of BRICS National Development Banks, 2013
Exim Bank CDB DBSA BNDES VEB
Assets 14 1 334 51 353 90
Equity 1.4 528 16 29 16
Authorized capital 1.7 49.71 0.02 17.79 12.60
Loans 12 1 164 40 271 58
Borrowings 11 1 242 35 324 74
Net profit (loss) 0.06 13.02 –0.78 3.46 0.23
Return on total assets, % 0.39 0.98 –1.53 0.98 0.26
Return on equity, % 3.92 14.22 –4.94 12.02 1.47
Equity-to-loans ratio, % 11.59 7.86 39.20 10.63 26.97
Leverage, % 89 93 69 92 83
Year of establishment 1982 1994 1983 1952 1922*
Rating BBB- AA- BBB+ BBB+ BBB
Note: *Became a development bank in 2007.
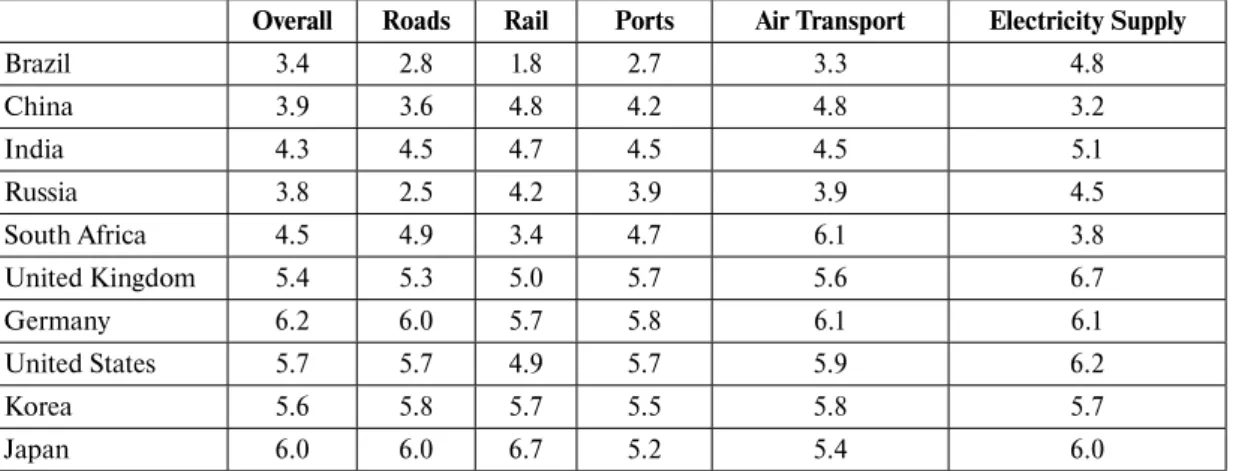
Thus in the global financial architecture, there are institutions and mechanisms for fi-nancing two priority areas of the NDB: infrastructure and sustainable development. However, the newly established bank could add to the existing system and become an important institu-tion for its member countries. Its key advantage is an opportunity to combine the efforts of the BRICS countries in the fields relevant for all five members. This would include urban infra-structure such as water supply, waste processing and the development of smart cities [Rogat-nykh, 2013]. Despite the efforts of the existing institutions, infrastructure is relatively underde-veloped in BRICS countries compared to deunderde-veloped countries (see Table 10).
Table 10: Infrastructure Quality Indicators, 2013–2014
Overall Roads Rail Ports Air Transport Electricity Supply
Brazil 3.4 2.8 1.8 2.7 3.3 4.8
China 3.9 3.6 4.8 4.2 4.8 3.2
India 4.3 4.5 4.7 4.5 4.5 5.1
Russia 3.8 2.5 4.2 3.9 3.9 4.5
South Africa 4.5 4.9 3.4 4.7 6.1 3.8
United Kingdom 5.4 5.3 5.0 5.7 5.6 6.7
Germany 6.2 6.0 5.7 5.8 6.1 6.1
United States 5.7 5.7 4.9 5.7 5.9 6.2
Korea 5.6 5.8 5.7 5.5 5.8 5.7
Japan 6.0 6.0 6.7 5.2 5.4 6.0
Note: Scores on a scale of 1 to 7, with 7 being the most desirable outcome.
Source: Klaus Schwab [2014].
Sustainable development projects could include the development and implementation of high technology. The cost of research and development in BRICS countries is relatively low compared to developed countries (see Table 11). It could be more efficient for BRICS members to develop technologies jointly, for example in nanotechnology or energy efficiency, than to act independently. They could thus benefit from the NDB here.
The NDB also could perform analytical and advisory functions regarding common BRICS challenges such as the middle-income trap, agriculture in tropical environments and the devel-opment of SMEs. All BRICS countries are struggling with issue of domestic inequality, both socially and regionally [Grigoriev and Morozkina, 2013b; see also Silvério, 2012].
Table 11: Key Technology Development Indicators, 2007
R&D Expenses, % GDP
Employed in R&D, % Population
High-Tech Exports, % Manufactured
Exports
Patent Applications
Brazil 1.1 0.1 11.9 21,800
China 1.4 0.1 26.7 245,200
India 0.8 0.0 6.4 28,900
Russia 1.1 0.4 6.9 39,400
South Africa 0.9 0.1 5.6 10,800
Japan 3.4 0.6 18.4 396,300
Germany 2.5 0.5 14.0 61,000
Korea 3.2 0.5 30.5 172,500
United Kingdom 1.8 0.5 18.9 25,000
United States 2.7 0.5 27.2 456,200
Note: R&D = research and development; GDP = gross domestic product.
Source: Leonid Grigoriev and Alexandra Morozkina [2013b].
Table 12: Gross Domestic Product and Bretton Woods Quotas, 2013
Share in Global GDP
by PPP
IMF Quota Post 2008
Reform
IMF Voting Power Post 2008 Reform
IMF Quota Post 2010
Reform
IMF Voting Power Post 2010 Reform
World Bank Voting Power, 2013
China 15.84 4.00 3.81 6.39 6.10 5.43
India 6.65 2.45 2.34 2.75 2.63 2.90
Russia 3.43 2.50 2.39 2.71 2.59 2.35
Brazil 2.96 1.79 1.72 2.32 2.22 1.75
South Africa 0.65 0.79 0.77 0.64 0.63 0.80
Note: GDP = gross domestic product; PPP = purchasing power parity; IMF = International Monetary Fund.
Source: IMF [2011], IMF [2014], IBRD [2015].
Thus, the BRICS countries cannot influence activities of the Bretton Woods institutions, although this could change after the establishment of the NDB. First, the BRICS countries will determine the volume and direction of financial assistance to countries (the share of the BRICS countries, according to the agreement, should not decrease below 55%), in contrast to other multilateral financial institutions. At the same time, the equal distribution of voting power among the five founding BRICS members (parity could also remain later) means their opinions will be equally taken into account.
providing lending conditions and monitoring results. But the question remains of whether this potential will be realized or the five countries will follow the traditional path.
Thus, the NDB could increase the role of the BRICS countries in the global financial architecture. It will complement the existing system of institutions and mechanisms. It could begin by focusing on the middle-income trap and urban infrastructure development. In the field of financing development, the newly established institution partly duplicates existing in-stitutions and mechanisms, but it could promote the role of the BRICS countries by using re-sources primarily from the founding countries and considering their interests in the first place. The NDB has the chance to become not only a political initiative but also an instrument for addressing common BRICS issues.
References
African Development Bank (2007–2013) “Annual reports.” Tunis-Belvédère. Available at: http://www.afdb. org/en/documents/publications/annual-report/ (accessed 31 May 2015).
African Development Bank (2011) Agreement establishing the African Development Bank. Tunis-Belvédère. Available at: http://www.afdb.org/fileadmin/uploads/afdb/Documents/Legal-Documents/Agreement%20 Establishing%20the%20ADB%20final%202011.pdf (accessed 31 May 2015).
Armijo L.E., ed. (2002) Debating the global financial architecture. Albany NY: State University of New York Press.
Armijo L.E. and C. Roberts (2014) The emerging powers and global governance: why the BRICS matter. In: R.E. Looney, ed. Handbook of emerging economies. Abingdon: Routledge, pp. 503–24.
Asian Development Bank (1965) Agreement establishing the Asian Development Bank (ADB Charter). December. Manila. Available at: http://www.adb.org/documents/agreement-establishing-asian-development-bank-adb-charter (accessed 31 May 2015).
Asian Development Bank (2007–2013) “ADB annual reports.” Manila. Available at: http://www.adb.org/ documents/series/adb-annual-reports (accessed 31 May 2015).
Brazilian Development Bank (2007–2013) Annual reports. Brasilia. Available at: http://www.bndes.gov.br/ SiteBNDES/bndes/bndes_en/Institucional/Investor_Relations/Annual_Report/index.html (accessed 31 May 2015).
BRICS (2013) “BRICS and Africa: partnership for development, integration and industralisation.” eThekwini Declaration, Durban, 27 March. Available at: http://www.brics.utoronto.ca/docs/130327-statement.html (accessed 25 May 2015).
BRICS (2014) “Agreement on the New Development Bank.” Fortaleza, Brazil, 15 July. Available at: http:// www.brics.utoronto.ca/docs/140715-bank.html (accessed 31 May 2015).
BRICS Business Council (2014) “BRICS Business Council 2013/2014 annual report.” 9 July. Available at: http://arquivos.portaldaindustria.com.br/app/conteudo_18/2014/07/15/6862/BRICSBusinessCouncilAnnu alReportDRAFT6-11JulySignature.pdf (accessed 31 May 2015).
Central Asia Monitor (2013) Pyat’ “pal’tsev” – v kulak Vliyaniye stran BRIKS usilivayetsya. 10 August. Available at: http://old.camonitor.com/archives/8543 (accessed 31 May 2015).
China Development Bank (2007–2013) Annual reports. Beijing. Available at: http://www.cdb.com.cn/english/ Column.asp?ColumnId=91 (accessed 31 May 2015).
Development Bank of South Africa (2007–2013) DBSA annual reports. Pretoria. Available at: http://www. dbsa.org/EN/About-Us/Publications/Pages/DBSA-Annual-Reports.aspx (accessed 31 May 2015).
European Bank for Reconstruction and Development (2007–2013) “Annual reports.” London. Available at: http://www.ebrd.com/publications/annual-report (accessed 31 May 2015).
Export-Import Bank of India (2007–2013) Annual reports. Brasilia. Available at: http://www.eximbankindia. in/annual-report (accessed 31 May 2015).
Grigoriev L. and A. Morozkina (2012) BRICS instruments: specifics of objectives. In: H.H.S. Viswanathan and N. Unnikrishnan, eds., In search of stability, security and growth: BRICS and a new world order. New Delhi: Observer Research Foundation. pp. 125–34.
Grigoriev L. and A. Morozkina (2013a) Bank razvitiya [Development bank]. In: V. Nikonov and G. Toloraya, eds., Strategiya rossii v BRIKS: tseli i instrumenty [Russia’s strategy in BRICS: goals and instruments]. Moscow: RUDN. pp. 273–86. Available at: http://www.nkibrics.ru/system/asset_publications/data/53c7/ b39f/676c/7631/4009/0000/original/strategiya-rossii-v-briks-tseli-i-instrumenty.pdf?1408705835 (accessed 25 May 2015).
Grigoriev L. and A. Morozkina (2013b) Different economies, similar problems. Russia in Global Affairs, pp. 26–40. Available at: http://eng.globalaffairs.ru/number/Different-Economies-Similar-Problems-16051 (accessed 25 May 2015).
IBRD (2015) IBRD Country Voting Table. Available at: siteresources.worldbank.org/BODINT/ Resources/278027-1215524804501/IBRDCountryVotingTable.pdf (accessed 25 May 2015).
IMF (2011) Available at: http://www.imf.org/external/np/sec/pr/2011/pdfs/quota_tbl.pdf. (accessed 25 May 2015)
Inter-American Development Bank (1996) Agreement establishing the Inter-American Development Bank. January. Washington DC. Available at: http://idbdocs.iadb.org/wsdocs/getdocument.aspx?docnum=781584 (accessed 31 May 2015).
Inter-American Development Bank (2007–2013) “Annual reports.” Washington DC. Available at: http:// publications.iadb.org/handle/123456789/2/discover?scope=123456789/1&thumbnail=true&rpp=5&page=0 &group_by=none&etal=0 (accessed 31 May 2015).
Ministério do Planejamento, Orçamento e Gestão do Brasil (2011) Plano plurianual 2012–2015: plano mais Brasil [Multiyear Plan 2012–2015: Plan More Brazil]. 13 October. Brasilia. Available at: http://www. secretariageral.gov.br/acesso-a-informacao/acoeseprogramas/ii-ppa-2012-2015-plano-mais-brasil (accessed 31 May 2015).
National People’s Congress of the People’s Republic of China (2011) China’s twelfth five-year plan (2011– 2015). Beijing. Available at: http://www.britishchamber.cn/sites/default/files/full-translation-5-yr-plan-2011-2015.doc (accessed 31 May 2015).
National Planning Commission (2012) National development plan 2030: our future – make it work. 12 August. Pretoria: Government of South Africa. Available at: http://www.poa.gov.za/news/Documents/NPC%20 National%20Development%20Plan%20Vision%202030%20-lo-res.pdf (accessed 31 May 2015).
O’Neill J. (2013) Five surprises ahead. BRICS Business Magazine, pp. 28–33. Available at: http://bricsmagazine. com/en/articles/five-surprises-ahead (accessed 31 May 2015).
Planning Commission (2013) Twelfth five-year plan (2012/2017). New Delhi: Government of India. Available at: http://planningcommission.gov.in/plans/planrel/12thplan/welcome.html (accessed 31 May 2015).
Preksin O. (2013) The great financial construction site. BRICS Business Magazine, pp. 44–45. Available at: http://bricsmagazine.com/en/articles/the-great-financial-construction-site (accessed 31 May 2015).
Putin V. (2005) “Vystupleniye na vstreche s chlenami Pravitel’stva, rukovodstvom Federal’nogo Sobraniya i chlenami prezidiuma Gosudarstvennogo soveta.” [“Speech of the President of the Russian Federation on the meeting with the Government, Federal Assembly and the members of the State Council.”] Krelmin, 5 September. Available at: http://web.archive.org/web/20140822232143/http://archive.kremlin.ru/appears/2005/09/05/1531_ type63374type63378type82634_93296.shtml (accessed 25 May 2015).
Rogatnykh E. (2013) Industrial, agricultural and service sectors in BRICS countries: innovation and mutual reinforcement. Paper presented at the conference on “Complementarity of BRICS National Economies and Mutual Cooperation”, 18 October. Moscow.
Silvério M. (2012) “BRICS: desigualdades sociais nos países emergentes.” [“BRICS: social inequality in emerging countries.”] Observatório das desigualdades, Lisbon. Available at: http://observatorio-das-desigualdades.cies.iscte.pt/index.jsp?page=projects&id=123 (accessed 31 May 2015).
Unger R.M. (2013) Gearing up for a new global order. BRICS Business Magazine, pp. 30–33. Available at: http://bricsmagazine.com/en/articles/gearing-up-for-a-new-global-order (accessed 31 May 2015).
Vnesheconombank (2007–2013) “Annual reports.” Moscow. Available at: http://www.veb.ru/en/ifi/rep/ annual/ (accessed 25 May 2015).
IMF (2014), World Economic Outlook Database. Available at: http://www.imf.org/external/pubs/ft/ weo/2014/02/weodata/index.aspx (accessed 25 May 2015).
World Bank (2007–2013) “World Bank Annual Reports and Financial Statements.” Washington DC. Avai-lable at: https://openknowledge.worldbank.org/handle/10986/2127 (accessed 31 May 2015).