Journal of Engineering Science and Technology Review 6 (1) (2013) 52 -58
Research Article
Using Conjugate Gradient Network to Classify Stress Level of Patients.
V.K. Banga* and Er. S. Pawar
Amritsar College of Engineering & Technology,ACET, PTU, Kapurthala Punjab, Jallandhar, 144001, India
Received 10 June 2012; Accepted 10 February 2013
___________________________________________________________________________________________________
Abstract
Diagnosis of stress is important because it can cause many diseases e.g., heart disease, headache, migraine, sleep problems, irritability etc. Diagnosis of stress in patients often involves acquisition of biological signals for example heart rate, electrocardiogram (ECG), electromyography signals (EMG) etc. Stress diagnosis using biomedical signals is difficult and since the biomedical signals are too complex to generate any rule an experienced person or expert is needed to determine stress levels. Also, it is not feasible to use all the features that are available or possible to extract from the signal. So, relevant features should be chosen from the extracted features that are capable to diagnose stress. Electronics devices are increasingly being seen in the field of medicine for diagnosis, therapy, checking of stress levels etc. The research and development work of medical electronics engineers leads to the manufacturing of sophisticated diagnostic medical equipment needed to ensure good health care. Biomedical engineering combines the design and problem solving skills of engineering with medical and biological sciences to improve health care diagnosis and treatment.
Keywords: Mental stress, heart rate, heart rate variability
___________________________________________________________________________________________________
1. Introduction
Stress is popularly known as the state when a person fails to react properly to the emotional or physical threats whether imaginary or real. It shows symptoms like exhaustion, headache, adrenaline production, irritation, muscular tension and elevated heart rate. When our brain appraises stress, the Sympathetic Nervous System (SNS) prepares our brain to respond to stress. The beat to beat intervals of the heart tend to vary. This gives rise to Heart Rate variability (HRV) which is mostly regulated by the sympathetic and parasympathetic Autonomic Nervous Systems (ANS). Thus the state of the ANS is reflected in HRV. This has made it an increasingly popular tool to investigate the state of the ANS, which can be further used to explain various physiological activities of the body. Heart rate variability (HRV) is one of the popular parameters to analyze the activities of the Heart and the Autonomic Nervous System (ANS) in humans. The state of the ANS is reflected in the HRV. For this reason we chose HRV as one of the key criteria to diagnose stress. The research and development work of medical electronics engineers leads to the manufacturing of sophisticated diagnostic medical equipment needed to ensure good health care. Biomedical engineering combines the design and problem solving skills of engineering with medical and biological sciences to improve health care diagnosis and treatment. Chronic stress, such as experienced in working situations, can lead to a chronic activation, overload and eventually exhaustion of the hormonal, cardiovascular,
neural and muscular systems due to insufficient recovery and repair. Long term consequences include, for example, an impairment of immune systems, delay of healing processes and musculoskeletal overload. With this study, we aim to investigate the interaction between HR, HRV and mental stress on group level and for individual changes. In this test ECG was measured during rest and during a mental task. We analyzed HRV to provide insight into how the heart reacts to a mental task. Linear HRV measures were included and finally neural network has been implemented in this paper. The diagnosis is mainly based on the expert’s experience but the number of expert is also insufficient. In such a scenario a case base reasoning (CBR) system can be considered as a way of stress diagnosis. In CBR the nature of new problem is identified and solved respectively by reusing the previous problems and their solutions that are categorized and solved by expert. The HRV can be analyzed using both time domain and frequency domain attributes. It is very important to choose features which vary with the changes of the stress levels and show relatively reliable behavior. We collect as many cases as possible in our case library for which the expert has defined the stress level
2. Objectives
The main objective of the research paper is to construct a network using HRV features to diagnose stress and analyze how accurate the result is compared to the expert’s diagnosis. A central theme is to improve patients’ self efficacy. Self-efficacy refers, for instance, to the patient
J
estr
JOURNAL OF Engineering Science andTechnology Review
www.jestr.org
______________
* E-mail address: [email protected]
having the correct information, skills and motivation to do self-care. Thus, the emphasis is moving from improving patients’ compliance to improving patients’ self-efficacy. The patient-centric care has been shown to be beneficial, for example, in terms of changes in the health status, patients’ self-efficacy and health care resource utilization. Patient’s Stress classification and detection helps the medical system to reduce the serious problem affect of many people of different professions life situations, and age groups. High stress rates of the patients suffer from the Heart disease and other physiological outcomes, Psychological disease and social and behavioral changes wireless. This thesis will explain different methods for classification of stress levels and help the patients to overcome from that stress. So the main focus of the thesis is to create a conjugate gradient network to find out the stress level of the patients. All the simulations are performed using MATLAB Software.
3. Sensors
In biomedicine and biotechnology, sensors are analytical device which converts a biological response into an electrical signal. Sensors are used to collect the data from patients for classification of stress. The activities at Biosensors Group aim at the integration of nanotechnology methods, tools and materials into low cost, user friendly and efficient sensors and biosensors with interest for several fields such as diagnostics, food analysis, environment monitoring and other industries.
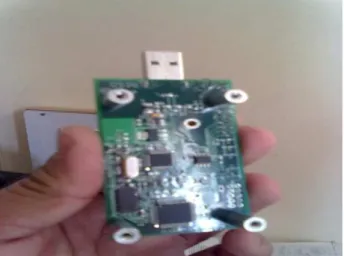
3.1 Transmitter and Receiver sensor
Sensor transmitters are measurement or signal conditioning packages that provide standard, calibrated outputs from sensors or transducers. Outputs types include current loops, variable voltage levels, frequency or pulse signals, timers or counters, relays, and variable resistance outputs.
Fig. 1 Transmitter and Receiver sensor.
Fig.2 shows the receiver port of sensor which is attached with laptop for collection of patient’s data. The power consumption is critical, especially in the case of long-term monitoring using wearable sensors. Traditionally, most of the studies on automatic health monitoring in uncontrolled environments focus on health monitoring at home. These solutions use mostly embedded sensors that are available in the home environment, either as separate devices or embedded into structures such as furniture. More recently,
with advances in electronics and communication technology, wearable sensors have attracted increased attention.
Fig. 2 Receiver port of sensor attached.
4. Experiment Setup
My aim in this research is the detection of mental stress, as physical stressors occur far less frequently in the context of human-computer interaction. Therefore, in order to elicit mental stress at controlled intervals a computerized “Conjugate gradient network” was used. The development of this recognition system involved three stages: experiment setup for physiological sensing, signal preprocessing for the extraction of affective features and affective recognition using a learning system.
4.1 Data collection from sensors
The purpose of the data collection was to use different wearable sensors during mental and physical load and rest and to identify the most useful sensors, feature extraction methods and classification methods for automatic recognition of those activities. This study was conducted in real-life settings. The data collection equipment consisted of ten hardware units: 1) wireless sensor node; 2) HR monitor. Data from activity monitor worn on the wrist, movement sensor in bed, HR monitor, and wireless sensor node with temperature and illumination sensors were sent.
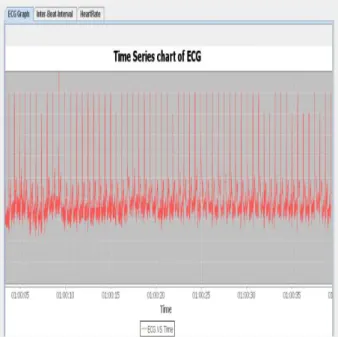
Fig.4 Online graph of ecg system
This is the online graph of a ecg system obtained after collection of data using Matlab for classification of stress.
Fig.5 Heart Beat
The first little hump is known as the P wave. It occurs when the atria depolarize (i.e. trigger). The next three waves constitute the QRS complex. They represent the ventricles depolarizing. These three are lumped together because a normal rhythm may not have all three. Many times, you'll only see a R and an S. This is not abnormal. If there are less than three, how do we know which one is which? Well, the R wave is the first wave ABOVE the isoelectric line. You then name the waves in relation to the R wave. If it falls before the R wave, it is called the Q wave; after the R wave is the S wave.
4.2 Make data base of the patients
For collecting the data base of the patients we have to make an formula p1 = s (7200*2:7200*3) for generating data base of the patient. No of participants were monitored, some of men and women with mean age of 22 (±1.96) and an average body mass index of 22.2 (±0.43). Participants were students of lovely professional university. Measurements were recorded for two conditions for each subject: with and without a mental task. HR was recorded throughout the test
for each subject. HRV was calculated as the variance in time between two consecutive R-peaks. Different measures in time and frequency domain were used to express HRV.
Fig. 6 Screenshots of the data collection
Fig. 7 Heart beat rate of 1 patient
MakeClassificationData1(Age,SexCode,beat_Rate,high,low R,meanR,stdR,varR,mediaR,covR);
4.3 Data Analysis
Average heart beat period in ms (Mean RR) was calculated for each subject for the two conditions derived from the raw RR-interval. The Pan-Tompkins algorithm was used to detect the QRS-complexes in the ECG-signal from which we could determine the RR-intervals. HRV analysis is possible in the time or frequency domain. Time domain analysis is the easiest way, calculated directly from the raw RR-interval. The frequency domain shows us the variability of the RR-signal over time by looking at the proportion of the frequencies relative to the original RR-signal. Frequently misused clip class parameters are link and standardized divagation (SD) of RR, think and SD of HR, RMS. It utilised spectral measures are apex frequency and index of real low cardinal bands (VLF: 0 to .04 Hz), low frequency bands (LF: .04 to .15 Hz) the ratio of LF/HF, which is interpreted as a measure of sympathovagal balance. . We have to analyse the data in the given format. Make
Classification Data (Age,SexCode,
beat_Rate,high,lowR,meanR, stdR ,varR, mediaR, covR). For generation of patients data we have to use the given formula, p1 = s (7200*p1:7200*p2). We calculated LF and HF components for each subject in each condition, and the LF/HF ratio was determined for further analysis. After that we have to use neural network on whole data of patients. We use neural network because it is a kind of machine learning in which patients data from various resources can be compiled in one learning experience and can be utilized to aid doctor and proper identification of high and low stress people.
4.4 Feature Extraction
Feature extraction aims at extracting such characteristics of the input patterns that enable their classification into distinct classes. In the analysis of personal health monitoring data, the features are computed from the content of a sliding window. Feature extraction methods commonly used to study signal characteristics include 1) time-domain features and 2) frequency domain features.
4.5 Stress Classification
We used the WEKA machine learning engine to train classifiers using various learning methods, including the J48 Decision Tree, Bayes Net, and support vector machine (SVM) for stress inference . We divided the training data into two different sets in order to evaluate how activity information may influence the results of stress inference.
5. Results
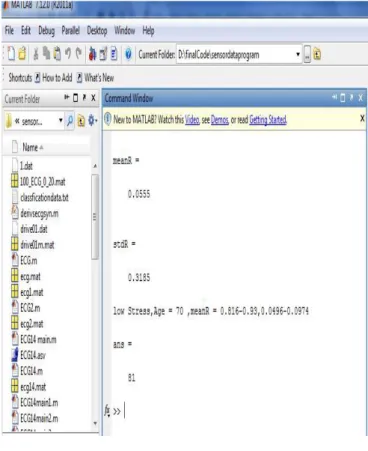
The system was evaluated with maximum no of case representations. The cases were classified in to 2 stress levels viz. 1 and 2. The levels of stress 1 and 2 are categorized as low and high stress resp
Fig 8. Output data of low stress
Fig. 9 Output data of high stress.
Fig.10 Confusion Matrix
The confusion matrix after personalization shows an improved accuracy. The accuracy after Personalization is
88%. Much of our classifiers’ confusion seen in the results can be explained with transitions from one activity to another. The annotator was not given the choice to annotate “transition,” but he had to switch from one activity to another instantly at some point during the transition. The resulting inaccuracy is especially visible in the recognition of stress level, which should be detected almost perfectly from the conjugate gradient network. In the field of artificial intelligence, a confusion matrix is a specific table layout that allows visualization of the performance of an algorithm, typically a supervised learning one (in unsupervised learning it is usually called a matching matrix). Each column of the matrix represents the instances in a predicted class, while each row represents the instances in an actual class. The name stems from the fact that it makes it easy to see if the system is confusing two classes (i.e. commonly mislabeling one as another). Outside artificial intelligence, the confusion matrix is often called the contingency table or the error matrix. . Low and High stress cases are classified by the expert system based on the matlab and on the following parameters i.e age, sex code, beat rate, meanR, stdR, mediaR, covR, Stress. Finally all cases are classified after all these signals taking in consideration. The classification are shown in table 1.
Age Sex
Code
Beat Rate High R Low meanR stdR stdR mediaR covR Stress
41 1 144.967513 3.741206 0.000000 0.087190 0.454353 0.206437 0.000000 1.000000 1
48 2 144.578680 3.861115 0.000000 0.091960 0.467256 0.218328 0.000000 1.000000 1
70 1 94.468822 4.062832 0.000000 0.076728 0.441388 0.194824 0.000000 1.000000 2
89 2 99.047452 2.719985 0.000000 0.055332 0.316915 0.100435 0.000000 1.000000 2
58 1 96.678484 3.759101 0.000000 0.072593 0.431686 0.186353 0.000000 1.000000 1
78 2 104.337391 3.791622 0.000000 0.075491 0.435176 0.189378 0.000000 1.000000 2
99 1 144.967513 3.888144 0.000000 0.086690 0.456807 0.208673 0.000000 1.000000 2
Fig. 11. Table 1
Stress Low stress – 1 High stress – 2 and
Sex code Female- 1 Male- 2
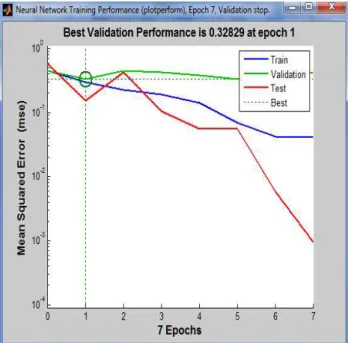
5.1 Best validation performance
The use of the word validation here should not be confused with the high stress and low stress. The validation set is used to further refine the neural network construction. The testing set is then used to determine the performance of the neural network by computation of an error metric. This training-validating-testing approach is the first, and often the only, option system developers consider for the assessment of a neural network. The assessment is accomplished by the repeated application of neural network training data, followed by an application of neural network testing data to determine whether the neural network is acceptable.
5.2 Error Histogram
Histograms are used to plot density of data, and often for density estimation: estimating the probability density function of the underlying variable. The total area of a histogram used for probability density is always normalized to 1. If the length of the intervals on the x-axis is all 1, then a histogram is identical to a relative frequency plot. There is no "best" number of bins, and different bin sizes can reveal different features of the data.
6. Comparison
much weight should be used for particular features and steps to get a better result. Again, if the number of cases increases the chance of wrongly classified case will be decreased and that is so much important. But in my thesis work we have to classified the patient according to our need, considering the Age, Sex Code, Rate high, low R, mean R, stdR , varR. . In addition, further studies of different medical conditions in clinical and ambulatory settings are necessary to determine specific limitations and possible new applications of this technology.
Fig. 12 Neural Network Traning Network
Fig. 13 Error Histogram
7. Conclusion
This new technology has potential to offer a wide range of benefits to patients, medical personnel, and society through continuous monitoring in the ambulatory setting, early detection of abnormal conditions, supervised rehabilitation, and potential knowledge discovery through data mining of all gathered information. To formulate rule for stress diagnosis by using ECG signal is hard because of the non stationary and uncertain characteristics of the ECG signal. So, the stress diagnosis is mostly dependent on the expert knowledge but the number of available experts is also insufficient. The features selection is done according to the study where a survey was done on most of the papers to find out the relative and important features. Most of the works in the related field are done on the basis of time and frequency domain. Both time and frequency domain features, the range of some power spectral that are features and the normalization equations were selected carefully by the study.
8. Future scope
There are many other classifier for diagnosis of stress i.e. support vector machine, Bayesian network etc which can also be tested on the similar work which can yield better accuracy and research. The database acquisition was based on psychological experiments carried out by expert psychologists. These experiments ensure that stressing situations are provoked on an individual, validating posterior HR and HRV acquisitions. This paper provides a decision system able to detect stress with an accuracy of 92.5% using Neural network. In future we have to detect maximum accuracy using other networks. The results show moderate, but significant overall correlations to daily stress level on working days and pateint. Even moderate correlations can be considered important in case of these kinds of data . However, it must be kept in mind that many of the variables (e.g., BP variables) are not independent. Thus, when the value of one variable changes, the dependent variable changes as well. Strong correlations can be found at individual level, but the correlations of different individuals can even be conflicting, which weakens the overall correlations. Thus, based on the results of this study, it can be said that stress is an individual phenomenon. Different people react to stress in different ways. One person may react with blood pressure, while another reacts with disturbed sleep, etc. Thus, finding very specific variables that always indicate stress, when it is present, is a demanding task for future research.
______________________________
References
1. Klein CL & Corwin EJ Seeing the unexpected: how sex differences in stress responses may provide a new perspective on the manifestation of psychiatric disorders. Current Psychiatry Reports 4:441-448, Department of Biobehavioral Health, Pennsylvania State University, 2002.
2. Joad Luiz Azevedo De Carvalho, Adson Ferreria da , “Compression of electromyographic signals using image compression techniques”,
international conference on technology in Biomedicine, British Columbia, Canada, pp. 333-338, 10-15 Oct. 2002.
3. S.Michie and S.Williams, “Reducing work related psychological ill health and sickness absence: a systematic literature review” IEEE Transactions on Information Technology in Biomedical, Department of Psychology, University College London ,pp 791-795, Jan. 2003. 4. Martin Kusserow, Oliver Amft, “Proposes a wearable talk assistant to
speaking”, fifth international conference on image processing and its application, Wearable Computing Lab., ETH Zurich, Switzerland, Vol 14 , pp. 447 – 450 , 2003.
5. J. Taelman, S. Vandeput , “Influence of Mental Stress on Heart Rate and Heart Rate Variability” submitted a paper to a Katholieke Universiteit Leuven, Department of Biomedical Kinesiology, Leuven, Belgium., Vol. 13, No. 2, Nov. 2003
6. Juha Parkka, Miikka Ermes, Panu Korpipa, “Activity Classification
Using Realistic Data From Wearable Sensors” IEEE
TRANSACTIONS ON INFORMATION TECHNOLOGY IN BIOMEDICINE, VOL. 10, NO. 1, JANUARY 2006.
7. E. Jovanov, A. Milenkovic, C. Otto, P. De Groen, B. Johnson, S. Warren, and G. Taibi, “A WBAN system for ambulatory monitoring of physical activity and health status: applications and challenges,” Proc. 27th Ann. IEEE Conf. Eng. Med. Biol., Shanghai, China, pp. 3810– 3813, Sep. 1–4, 2005.
8. Liao D et al, “Age, race and sex differences in autonomic cardiac function measures by spectral analysis of heart rate variability”, ARIC study. Am J Cardiol 76:906-912, 2006.
9. Alireza Seyedi, Biplab Sikdar, “Energy efficient transmission strategies for Body Sensor Networks”, Transportation Research part C 6 (2006).
10. Aleksandar Milenkovic , Chris Otto, “Wireless sensor networks for personal health monitoring: Issues and an implementation” international conference on clinical diagnosis, The University of Alabama in Huntsville, vol. 50, pp. 1019 – 1025, 2006.
11. K. Srinivasan and P. Levis, “RSSI is under appreciated,” in Proc. 3rd Workshop Embedded Netw. Sensors, Cambridge, MA, May 30– 31, 2006.
12. F. W. Beltman, M. A. Joore, D. E. M. Brunenberg, C. Dirksen, T. Thien, and P. W. de Leeuw, “Selfmeasurement of blood pressure at home reduces the need for antihypertensive drugs,” Hypertension, vol. 50, pp. 1019–1025, 2007.
13. S. N. Haynes and D. T. Yoshioka, “Clinical assessment applications of ambulatory sensors,” Psychol. Assess., Department of Psychology, University of Tampere, Tampere, Finland vol. 19, no. 1, pp. 44–57, 2007
14. M. Kumar, M. Weippert, R. Vilbrandt, S. Kreuzfeld, R. Stoll. "Fuzzy Evaluation of Heart
Rate Signals for Mental Stress Assessment", IEEE Transactions on Fuzzy Systems, 2007.
15. E. Miluzzo, X. Zheng, K. Fodor, and A. T. Campbell, “Radio characterization of 802.15.4 and its impact on the design of mobile sensor networks,” in Proc. 5th Eur. Conf. Wireless Sensor Netw., Bologna, Italy, Jan. 30/Feb.1, 2008.
16. M. U. Ahmed, S. Begum, P. Funk, N. Xiong, B. V. Schéele, “Case-based Reasoning for Diagnosis of Stress using Enhanced Cosineand Fuzzy Similarity”, Transactions on Case-Based Reasoning for Multimedia Data, IBaI Publishing, 2008.
17. E. D. Ubeyli, “Decision support systems for time-varying biomedical signals: EEG signals classification”, Expert Systems with Applications, , Kahramanmaras Sutcu Imam University 2008. 18. S. Begum, M. U. Ahmed, P. Funk, N. Xiong, B. V. Schéele, “A
Case-based Decision Support System for Individual Stress Diagnosis Using Fuzzy Similarity Matching”, Computational Intelligence, 2009. 19. M. Rouhani, R. Soleymani, "Neural Networks based Diagnosis of heart arrhythmias using chaotic and nonlinear features of HRV signals", 2009 International Association of Computer Science and Information Technology - , Islamic Azad Univ., Gonabad, Iran Spring Conference, 2009.
21. E. D. Ubeyli, “Combined neural network model employing wavelet coefficients for EEG signals classification, Digital Signal Processing, Kahramanmaras Sutcu Imam University, 2009.
22. D. C. Hoang, Y. K. Tan, H. B. Chng, and S. K. Panda, “Thermal energy harvesting from human warmth for wireless body area network in medical healthcare system,” in Proc. 8th Int. Conf. Power Electron. Drive Syst., Taipei, Taiwan, pp. 1277–1282, Nov. 2–5, 2009.
23. Juho Merilahti, Elina M. Mattila, “Identification of work-related stress symptoms and early intervention could reduce individual suffering and improve the working productivity and creativity.” , vol. 07, no. 8, pp. 642 – 652, 2009.
24. A. Pantelopoulos and N. G. Bourbakis, “A survey on wearable sensorbased systems for health monitoring and prognosis,” IEEE Trans. Syst., Man, Cybern. C, Appl. Rev., INDONESIA. vol. 40, no. 1, pp. 1–12, Jan. 2010.