BRUNO STORCHI BERGMANN
Antecedents of Customer e-Loyalty and Electronic Word-of-Mouth
Antecedents of Customer e-Loyalty and Electronic Word-of-Mouth
Dissertação apresentada à Escola de Administração de Empresas de São Paulo (EAESP), Fundação Getulio Vargas, como requisito para obtenção do título de Mestre em Administração de Empresas
Campo de Conhecimento: Marketing
Orientador: Prof. Dr. Delane Botelho
Bergmann, Bruno Storchi .
Antecedents of e-Loyalty and Electronic Word-of-Mouth / Bruno Storchi Bergmann. - 2015.
71 f.
Orientador: Delane Botelho
Dissertação (MPA) - Escola de Administração de Empresas de São Paulo.
1. Comércio eletrônico. 2. Lealdade. 3. Comportamento do consumidor. 4. Publicidade de boca-a-boca. 5. Geração Y. I. Botelho, Delane. II. Dissertação (MPA) - Escola de Administração de Empresas de São Paulo. III. Título.
BRUNO STORCHI BERGMANN
Antecedents of Customer e-Loyalty and Electronic Word-of-Mouth
Dissertação apresentada à Escola de Administração de Empresas de São Paulo (EAESP), Fundação Getulio Vargas, como requisito para obtenção do título de Mestre em Administração de Empresas
Campo de Conhecimento: Marketing
Data de Aprovação: 15/05/2015
Banca Examinadora:
_____________________________ Prof. Dr. Delane Botelho
FGV/EAESP
_____________________________ Prof. Dr. Eliane Pereira Zamith Brito FGV/EAESP
_____________________________ Prof. Dr. Dirceu da Silva
To my parents Renan and Thaisa, and my partner Maristela, whom have always believed in me, with
ACKNOWLEDGEMENTS
I thank everyone that agreed to be a part of this research by answering the survey. I owe you all for the results which adds important information to a better understanding of consumer behavior of Millennials in the online environment. These results should translate in valuable insights to academic and professional researchers.
I thank professor Delane Botelho for accepting the challenge of becoming an advisor to this thesis given the circumstances at the time. He has also provided me with important advice and instructions during the process of building the thesis.
I thank my family and friends for providing me with encouragement and advice, and demonstrating a legitimate concern for the positive outcome of this work. Finally, I thank my wife and partner for showing support even when I had to put her matters in second importance to this thesis.
ABSTRACT
The main objective of this thesis was to examine the effects between e-loyalty and eWOM. As a secondary objective, the significance of e-loyalty predictors established in prior literature was verified. The subject of research was focused on one type of product/service: online book purchase made in an internet retailer’s (e-tailer’s) website. Two hundred forty two online surveys were completed with respondents from the Millennial generation residing in different
locations in Brazil and the United States. The analysis was conducted using PLS-SEM on a research model built based in prior empirical research. While the effects between e-loyalty and eWOM were found to be weak, a high quality eWOM environment was considered a significant predictor of e-loyalty. All predictor variables had significant values, with commitment generating the strongest effect on e-loyalty.
Key-words
RESUMO
O objetivo principal da dissertação foi o de examinar a relação entre lealdade (e-loyalty) e o boca-a-boca (eWOM) no contexto do varejo eletrônico. Como objetivo secundário, foi feito uma verificação da significância das variáveis preditoras de e-loyalty. Essa pesquisa foi focada em um tipo de produto/serviço: compra de livros através da internet. Duzentos e quarenta e dois questionários online foram respondidos por um público representativo da geração Y (millennials), e rresidentes em diferentes localidades no Brasil e nos Estados Unidos. A análise
de dados foi efetuada pela aplicação do método PLS-SEM sobre um modelo de pesquisa cuidadosamente formulado com base em resultados empíricos prévios. Enquanto que a relação entre e-loyalty e eWOM foi classificada como fraca, um ambiente de boca-a-boca online de alta qualidade representou uma variável preditora significativa para o sentimento de e-loyalty. Todas as variáveis preditoras foram classificadas como significativas nesse estudo, sendo que comprometimento tem o efeito mais forte sobre a variável e-loyalty.
Palavras-chave
LIST OF ILLUSTRATIONS
FIGURES Page
Figure 1. Research model used by Erciş et al. (2012).……….………...………...…...….... 18
Figure 2. Integrative framework of online customer loyalty based on Toufaily et al.’s model (2013).……...…20
Figure 3. Conceptual framework for enhancement of e-loyalty (Yoo et al., 2013)..………...……... 24
Figure 4.The theoretical model………...…... 30
Figure 5. The research model in the PLS-SEM software ………...…...34
Figure 6.Preference for online book store …………..………...………. 36
Figure 7. Online vs. offline book purchase activity……...………...….….. 37
Figure 8. Online book purchase frequency.………...……... 37
Figure 9.Semester long expense with online book purchase ………..…….…... 37
Figure 10. The “Bootstrap” technique applied to verify T-Test values …………..………...…………... 39
Figure 11. Sobel test statistic (Sobel, 1982)……….. 44
Figure 12. The mediator variable path construct (Sobel, 1982)………...…...45
Figure 13. Example of a direct relation (no mediator).………..…………...……… 45
Figure 14. Example of a mediated relation (e-Loyalty is the mediator).………...……….... 45
Figure 15. Image from Sobel’s Test Calculator for the Significance of Mediation (software) …..…………... .. 46
Figure 16. Path relations based on Luarn and Lin’s research model (2003).………...………...….47
Figure 17. Alternative research model 1……….…………..…...…….49
TABLES Page
Table 1. Procedure to verify reliability and validity in a PLS-SEM analysis………..………. 34
Table 2.Total number of respondents who do not purchase books online ………..…… 36
Table 3.The “Bootstrap” technique applied in to verify significance of predictor variables………...…… 39
Table 4.Indicator loadings, and AVE, composite reliability, and Cronbach’s alpha for the Variables.…….…. 40
Table 5. Method to establish discriminant validity………..….… 41
Table 6. Testing the research hypotheses using the model.………..…… 41
Table 7. Reliability values for each research indicator………..…….….. 42
Table 8. Main change in path relations from the model after the removal of weak indicators.……….... 42
Table 9.Final results from the analysis of the model after the extraction of weak indicators.……...……...…. 43
Table 10. Final judgement for the research hypotheses.………...…… 43
Table 11. Verifying significance with mediation effect among variables.……….…………..….…... 45
Table 12. Final results for mediation significance among variables.………...…….… 46
CONTENTS
1. INRODUCTION ……… 12
2. THEORY ………..…….. 15
2.1 E-LOYALTY ……….……… 15
2.1.1 Antecedents of Customer e-Loyalty ………..….…17
2.1.2. An Integrative Framework ……….……...…….19
2.2 ELECTRONIC WORD-OF-MOUTH (EWOM) ……….………...…….. 21
2.2.1 eWOM’s Effect on e-Loyalty ………...…….… 23
2.3 HYPOTHESES ……….. 25
2.3.1 Model Development ………..………… 29
3. METHOD ………..…....…………. 31
3.1 RESEARCH PURPOSE ……….…………..……….……...…. 31
3.2 QUESTIONNAIRE DESIGN ……… 31
3.2.1 Scales ……….…….. 31
3.2.2 Pre-Test ……….……….. 32
3.3 SAMPLE ………...……….…… 32
3.4 PROCEDURE FOR DATA ANALYSIS………..………...…….. 33
3.4.1 Structural Equation Modeling (SEM) …….………..……….………… 33
4. RESULTS ………...…..….. 36
4.1 DEMOGRAPHIC AND PROFILE OVERVIEW…... 36
4.2 RESEARCH MODEL AND HYPOTHESES ………...…. 38
4.3 MEDIATION ……….……… 44
4.4 ALTERNATIVE RESEARCH MODELS………..……… 48
5. FINAL REMARKS……….….…...… 50
5. 1 DISCUSSION ………..….… 50
5. 2 MANAGERIAL IMPLICATIONS ………..….…….….. 51
5. 3 THEORETICAL IMPLICATIONS ………….……….……..….. 52
REFERENCES ………....…..…… 55
INTRODUCTION
The concept of customer loyalty is central in marketing (Toufaily, Ricard & Perrian, 2013). With the emergence of commercial exchanges through the Internet, the process of building loyalty (e-loyalty) within the electronic retailing (e-tailing) environment has become a subject of increasing interest for Marketing professionals and academic researchers (Casaló, Flavián & Guinalíu, 2008; Pan, Cheng & Xie, 2012).
Nowadays, with a high number of companies serving the same purpose, increases in consumers’ general awareness and in ease of access to advantageous alternatives are motivating customers to easily change service providers (Wood, 2004); the creation and maintenance of customer loyalty has become an increasingly difficult task. Taking into account the importance and complexity of the subject to retailers working in the web environment (e-tailers), corporate executives are interested on the concept of customer e-loyalty, and the driving forces behind this behavior (Pan et al., 2012).
The threat of strong competition and rapid technological developments in various sectors are motivating firms to allocate resources to protect their market shares and financial performance. One way firms achieve this is by enhancing the overall customer experience to build a loyal customer portfolio, so firms can protect their long-term performance by gaining income from
these customers’ repeated purchases (Ünal, Candan & Yildirim, 2012). Customer loyalty may be considered a company’s most enduring asset (Pan et al., 2012).
There are a series of advantages from increases in customer loyalty, such as increases in cross-sales, customer profitability, share of wallet, number of visits to a website, willingness to pay, and willingness to purchase and repurchase on the website. In addition, customer’s sensitivity to price and alternative searches will diminish (Toufaily et al., 2013). Alternatively, the advantages can be stated more objectively through four main benefits: increases in customer spending, efficiency gains with existing customers and recruitment of new ones, price premiums from value added services, and new customers acquired through referrals (positive word-of-mouth) from existing customers (Lee et al., 2006).
Competition on retailing has been constantly increasing since the advent of the Internet (Kwon & Lennon, 2009). Big national and multinational brick-and-mortar style retailers (e.g.,
to the virtual environment. Multi-channel retailers, attracted by low costs and the potential to access millions of customers, consider the Internet a fundamental part of their businesses’ commercial strategy (Geyskens, Gielens & Dekimpe, 2002). Investments in e-tailing have been increasing over the years, with companies devoting significant resources to improve their online presence. By 2014, the scale and scope of multinational e-tailing had become very substantial. Amazon and Alibaba, the first and second largest e-tailers in the world, had during 2014 total revenues estimated in US$89 and US$53 billion respectively (Yahoo Finance, 2015). Forrester Research Inc. (2014), a respected source for projections in ecommerce, has estimated that online retail in US will have an annual compound growth of 9.5% until 2018 (Internet Retailer, 2014). In BRIC countries like Brazil, the projections are also optimistic: while ecommerce in 2014 reached US$10.9 billion, up 24% from 2013 (Profissional do Ecommerce, 2015), yStats.com projects that the market will reach US$25.7 billion in 2018 (Ecommerce News, 2015). Therefore, the effectiveness of investments in e-tailing is key to a company’s success. In addition, the extent to which loyalty feelings influence customer behavior and expectation to a
company’s online service is of special interest to brick-and-click multi-channel retailers (Kwon & Lennon, 2009).
The intended contribution of this thesis is to enrich the current knowledge on the subject of consumer behavior, specifically in important academic fields such as digital marketing, consumer loyalty, and online services. Results are expected to generate insights for managers to improve their marketing strategies, particularly to e-tailers that are willing to invest in customer service.
The text is organized as follows. The introduction has presented the objectives and relevance of the research. Subsequently, the theories most pertinent to the subject are explored, and a thorough analysis is provided to uncover the depth of different areas of knowledge in the field.
THEORY
An overview of previous studies on consumer loyalty is presented – initially with concepts – addressing its evolving characteristics throughout the last decades. In a second stage, two important articles with meta-analysis research methodologies on loyalty and e-loyalty are analyzed and compared. A careful mapping of online customer loyalty is emphasized to clearly demonstrate the richness, complexity and limitations of e-loyalty as a field of research. In a third stage, the relevance of the “word-of-mouth” process and its possible effects on e-loyalty are discussed with references to empirical studies. Finally, the research hypotheses are exposed and explained, and this study’s research model is introduced.
2.1. E-LOYALTY
Most types of loyalty that can be perceived in a daily basis are classified as “spurious”. These are actions based on lack of alternatives, “lock-in” strategies from a company (e.g., Apple Inc.’s iTunes), or even simple convenience (Jones et al, 2002). True loyalty requires attitudinal preference, which is believed to modify behavior (Bandyopadhyay & Martell, 2007). To enable an in-depth discussion, it is important to establish which are the basic concepts of loyalty and how they evolved through time, particularly during the age of retail in the web environment (or e-tailing), where loyalty is commonly described as e-loyalty.
The conceptualization of loyalty started with a behavioral approach, merely defining the degree of loyalty through the number of repeated actions. This concept evolved to a cognitive approach, in that the primary focus rested on the attitudinal dimensions of loyalty. Accepted as a third stage, it is proper to conceptualize loyalty through a composite approach, where both conditions
−attitudinal preference and the action of repeated purchase − are essential (Bandyopadhyay & Martell, 2007).
In the past decade another approach was adopted to conceptualize loyalty: a sequential process consisting of four phases, despite external influences such as situational factors or marketing actions (McMullan & Gilmore, 2003). The four phases can be described as cognition, affection, conation, and action. Cognitive loyalty focus merely on the brand performance aspects. However, this consumer state is of shallow nature because the depth of loyalty translates to mere performance (i.e., routine transactions). Affection will involve customer’s feelings, emotions that usually make the brand, product or service preferable upon others. In this stage, a liking is developed based on cumulative satisfying usage occasions. Conative loyalty is when the consumer has intent to repeat his purchase. Conation implies a brand-specific commitment to repurchase. Action is the act of loyalty, or the conversion of intention to action, with the added willingness to overcome impediments. If this type of engagement is repeated, action inertia will occur, facilitating repurchase (Oliver, 1999). Based on Oliver’s loyalty model (1999), Toufaily et al. (2013) propose a new definition of customer online loyalty:
“…the customer’s willingness to maintain a stable relationship in the future and to engage in a repeated behavior of visits and/or purchases of online products/service, using the company’s website as the first choice among alternatives, supported by favorable beliefs and positive emotions toward online company, despite situational influences and marketing efforts that lead to transfer behavior”.
This definition is a more simplified and comprehensible version of Oliver’s concept regarding customer loyalty, but can be thought of as overly detailed in its intention to explicit the complexities of the loyalty process. This can be more clearly perceived when compared to Pan et al.’s (2012) definition:
“we define loyalty as the strength of a customer’s dispositional attachment to a brand (or service provider) and his/her intent to rebuy the brand (or repatronize the service provider) consistently in the future.”
Gefen’s definition of online loyalty (2002) is perhaps the most abbreviated: “to convince customers to return to the website, and make further purchases on the site.”
Despite a large number of articles found on customer loyalty, there is little consensus among the authors. The variety of information is grand, but there are factors that limit comprehensive understanding and prevents generalization of findings (Pan et al, 2012). First, there is the
al, 2012). Third, an arbitrary choice of subject and measurement instruments casts doubt to weather current measurements are effective for an online environment (Toufaily et al, 2013). Luarn and Lin (2003) believe that theories on loyalty are almost identical when comparing online, or brick-and-mortar business, with offline, or brick-and-click business. Given the
probability that there isn’t relevant difference between the main factors affecting loyalty and e-loyalty, I will describe relevant facts found in two different meta-analysis studies. One made by Pan, Sheng & Xie (2012), which includes online and offline retail data, and the other made by Toufaily, Richard and Perrien (2013), which focus exclusively in online data.
2.1.1. Antecedents of Customer e-Loyalty
Customer satisfaction has been the most frequent subject among all the different online loyalty studies analyzed by Toufaily et al (2013). Despite many references to satisfaction as a main factor to generation of loyalty, empirical evidence is somewhat mixed (Pan et al., 2012). Some studies fail to prove direct linkage between customer satisfaction and loyalty, while other indicate an indirect and complex relation. Bauer, Grether & Leach (2002) state that companies should further develop strategies to increase online customer satisfaction, because its multiple positive effects would generate improvements on trust, commitment, and loyalty. Despite its multiple positive effects, satisfaction alone should not be understood as sufficient to generate consumer loyalty (Bowen and Shoemaker, 1998, cited in Erciş et al., 2012).
Traditionally, trust has been defined by a group of beliefs held by a person derived from his perceptions about certain attributes. In marketing, these attributes include the brand, products, services, the seller and the establishment where the transaction occurs. Trust has been identified as a major driver of loyalty (Pan et al, 2012). Once a customer has trust on a product or brand, he is most likely to develop favorable attitudes toward it; pay price premiums, remain loyal to it, and spread positive word-of-mouth (Chaudhuri and Holbrook, 2001). Toufaily et al. (2013) have found trust to be the second most important determinant of online loyalty. According to Pan et al. (2012), trust has the strongest effect size in relation to other determinants of loyalty, which confirms the findings of other studies (e.g. Johnson, 1999; Ibanez et al, 2006).
brand needs to generate commitment because committed customers will invest more heavily in the relationship with the seller; they will perceive more advantage in loyalty, and greater risks in switching brands (Evanschitz et al., 2006). Erciş, Unal, Candam, & Yildirim (2012) classifies commitment in affective and continuance. According with the authors, affective commitment means strong personal identifications causing emotional connection with a brand, while continuance commitment defines the consumer weak feelings to a brand. The results indicate that the role of satisfaction and continuance commitment on loyalty are weak, while trust and affective commitment have an important effect. The model from Erciş et al. (2012) can be seen in Figure 1.
Figure 1. Research model used by Erciş et al. (2012).
Pan et al. (2012) have found the effects of certain conditions upon loyalty. For instance, the effects of customer satisfaction and trust loyalty are milder when the purchase cycle is short. This means that consumers will delegate higher importance to their satisfaction and trust toward
a brand when they acknowledge beforehand that they will be “stuck” to the product for a long
time. This finding could probably be extended to most customer characteristics, especially to relational (satisfaction, trust, commitment, and attachment) and perception variables (value, risk, switching costs, control behavior). Furthermore, time has proven to increase the effect of quality on loyalty, suggesting that a high-quality image is crucial to build and maintain customer loyalty (Pan et al., 2012).
Other factors directly related to customer loyalty are cited, although with a lesser degree of importance when compared to customer’s characteristics such as satisfaction, trust, and commitment. Among these other factors, attention has remained within customer characteristics: perceptions to value, switching costs to online suppliers and control behavior; psychological variables such as customer attitude, innovativity, aggressiveness and inertia (Ponnavulu, 2000); relationship with technologies, more precisely website knowledge, IT experience, and
Perceived Equity Perceived Quality Brand Satisfaction Brand Trust Perceived
Value Affective
traditional versus virtual service preference are all examples of areas that have been empirically investigated and proven to influence online loyalty (Toufaily et al, 2013). Pan et al. (2012) have also displayed considerable attention to perceived value, as low perceived value will make customers more inclined to switch to competing brands. Still in the realm of customer characteristics, Pan et al. (2012) point to the perceived fairness/justice. According to them, a firm depends on an image of fairness to develop the level of confidence required to establish loyalty.
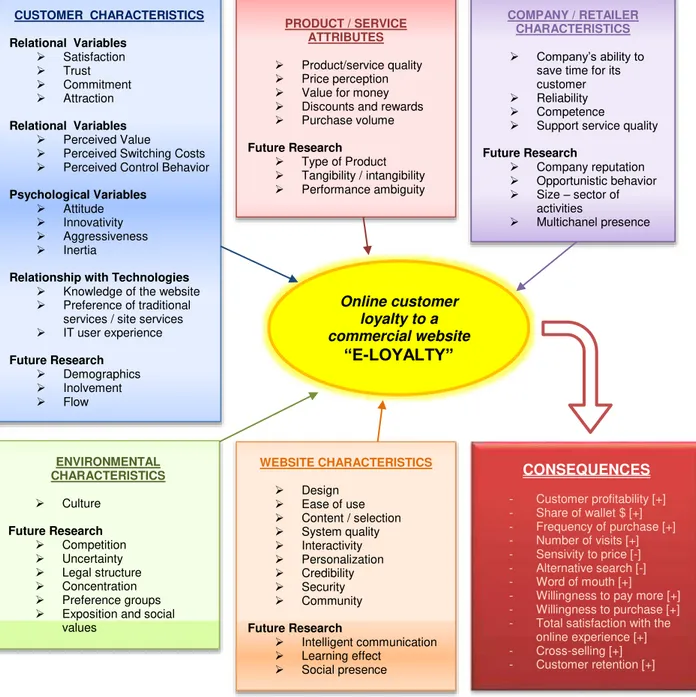
2.1.2. An Integrative Framework
Toufaily et al. (2013) have classified the determinants of online loyalty in five categories: customer characteristics, product/service attributes, company/retailer characteristics, environmental characteristics, and website characteristics. Notwithstanding the higher attention of scholars on customer characteristics, elements from other categories have been demonstrated to be also important determinants. For instance, product/service attributes like quality, price, discounts and rewards, purchase volume and value for the money should all be determinants of customer e-loyalty (Wallace et al., 2004; Chen, 2003).
Characteristics of the company or retailer should also influence e-loyalty: reliability, or ability in fulfilling promises; ability in saving time and in offering high quality support services (Bergeron, 2001); and a high level of operational competence to accomplish credibility in the
customer’s mind (Ganesan, 1994). The timesaving factor on e-loyalty is especially important, as it is usually a major cause for choosing the online instead of offline environment, and therefore time saving should affect online loyalty (Bergeron, 2001).
Environmental characteristics are structural influences from the electronic commerce environment that result in national and international issues such as legal structure, trade restrictions and culture (Cheung et al., 2005). There are studies in the effects of culture on loyalty (Steyn et al., 2010), although the influences are in great part unknown. Areas for future research include competition, legal structure, social values and preference groups.
The consequences of loyalty found in research sums to an extensive list of advantages: increases in profitability, share of wallet, frequency of purchases, number of visits, positive word-of-mouth, cross-selling, willingness to pay and purchase from the site/website, customer retention and satisfaction; and decreases of sensitivity to price and alternative purchases.
Each empirical study adds a “piece” to the “puzzle” that is the full understanding of how loyalty is generated; Toufaily et al. (2013) has developed a framework which summarizes the extent of knowledge in the field, with significant suggestions for future research (Figure 2).
Figure 2. Integrative framework of online customer loyalty based on Toufaily et al.’s model (2013).
PRODUCT / SERVICE ATTRIBUTES
Product/service quality Price perception Value for money Discounts and rewards Purchase volume Future Research
Type of Product Tangibility / intangibility Performance ambiguity
COMPANY / RETAILER CHARACTERISTICS
Company’s ability to
save time for its customer Reliability Competence
Support service quality Future Research
Company reputation Opportunistic behavior Size – sector of
activities
Multichanel presence
Online customer loyalty to a commercial website
“E-LOYALTY” CUSTOMER CHARACTERISTICS
Relational Variables
Satisfaction Trust Commitment Attraction Relational Variables
Perceived Value
Perceived Switching Costs Perceived Control Behavior Psychological Variables
Attitude Innovativity Aggressiveness Inertia
Relationship with Technologies
Knowledge of the website Preference of traditional
services / site services IT user experience Future Research
Demographics Inolvement Flow
CONSEQUENCES
- Customer profitability [+] - Share of wallet $ [+] - Frequency of purchase [+] - Number of visits [+] - Sensivity to price [-] - Alternative search [-] - Word of mouth [+] - Willingness to pay more [+] - Willingness to purchase [+] - Total satisfaction with the
online experience [+] - Cross-selling [+] - Customer retention [+] WEBSITE CHARACTERISTICS
Design Ease of use Content / selection System quality Interactivity Personalization Credibility Security Community Future Research
Intelligent communication Learning effect
Social presence
ENVIRONMENTAL CHARACTERISTICS Culture Future Research Competition Uncertainty Legal structure Concentration Preference groups Exposition and social
2.2. ELECTRONIC WORD-OF-MOUTH (eWOM)
Traditional and electronic word-of-mouth has long been considered important to marketing researchers and practitioners for a number of important reasons. Word-of-mouth (WOM) has been shown to impact consumer choice and post-product perceptions. In addition, WOM has been identified as more effective than marketing selling tools and various types of advertising (Gruen et al., 2006).
Since the mid-2000s, the rise of new media channels has offered fertile ground to the proliferation of online word-of-mouth (Cheung and Tadani, 2012). On the internet, consumers can post their opinions, comments and reviews of products/services on e-tailer websites, weblogs, discussion forums, review websites, e-bulletin board systems, newsgroups and social networking sites.
Online word-of-mouth (eWOM) is commonly interpreted as “Any positive or negative statement made by potential, actual, or former customers about the product or company which
is made available to a multitude of people and institutions via the internet” (Balakrishnan, 2014). It provides consumers with the opportunity to read other people’s consumption opinions and experiences, as well as write their own contributions.
persistence; and less identifiable than traditional WOM, which makes it harder to establish the
communicator’s credibility (Cheung and Tadani, 2012).
Floyd et al. (2014) describes the differences between WOM and eWOM from the customer’s point of view: eWOM is perceived as more powerful and effective because it is accessed from anywhere (e.g.; smartphone, tablet, or laptop), given there is an internet connection; more balanced and unbiased, because it provides divergent opinions from different consumers on the same website; easier to decipher, given that WOM is found in the written form; and more controllable by retailers, because they can design information systems which mediates online feedback exchanges (e.g., regulation of who participates, what type of information is solicited, how information is aggregated, and which information is made available).
Bambauer-Sachse and Mangold (2011) have emphasized an important difference between the two types of word-of-mouth when analyzing the impact of negative reviews. According to them, consumers are unable to establish clear consensus perceptions in traditional WOM, which can be characterized as information coming from only one person or a few people. In conclusion, negative (or positive) eWOM is more effective than negative (or positive) WOM because information is transferred in a straight way, granting clearer consensus perceptions to the receiver.
Findings in regards to eWOM’s valence have been ambiguous. Marketing scholars have shown through empirical research the existence of positive relations between valence and product sales; confirmatory bias, which leads consumers to look for positive reviews during the post-purchase stage; and negativity bias, which suggests negative reviews are more salient than positive reviews when customers have a neutral opinion (King et al., 2014).
There seem to be a consensus that negative eWOM is more powerful than positive WOM. Park
and Nicolau (2015) found that extreme positive reviews favors people’s enjoyment but have
Zhang et al. (2010) believes that eWOM’s valence can be mediated by the type of consumption goal. Consumers would have a positivity bias towards products with promotion consumption goals (e.g., photo editing software); which means positive reviews become more persuasive than negative ones. Accordingly, consumers would have a negativity bias for products with prevention consumption goals (e.g., anti-virus software); in this case, negative reviews become more persuasive.
WOM or eWOM is also perceived to have different degrees of influence, depending on the
individual’s tie strength. In weak ties, WOM is sought-after mostly for informational purposes. Individuals tend to choose weak ties when informational cues are seen as important. In stronger ties, word-of-mouth is shown to be most influential. WOM is found to influence immediate and delayed product judgments, and have strongest effects in occasions where consumers face an ambiguous experience and the source (or WOM communicator) is perceived to be from an expert (Gruen et al., 2006).
Unlike traditional WOM, where meaningful connections between the sender and receiver are pre-existent, eWOM can generate strong impact even in weak ties (King et al., 2014). Research has also found that consumers are more likely to transmit messages to stronger ties than weaker ties, and that a moderation occurs through the consumer’s evaluation of the quality of information (e.g., the sender will evaluate how much value the information has to the receiver). In addition, consumers are more likely to transmit negative messages to weaker ties, whereas they share positive and negative messages with stronger ties (King et al., 2014).
Although there has been a vast amount of recent literature focusing in the effectiveness of eWOM communication, the results are fragmented, making it hard to draw significant conclusions. Furthermore, researchers have been adopting several research approaches with little effort to integrate findings from prior studies (Cheung and Tadani, 2012).
2.2.1. EWOM’s Effect on e-Loyalty
on unbiased opinions based on experience (Bickart & Shindler, 2001). Furthermore, it has been found that participation by posting comments and reviews represents an extra-role behavior, which correlates with increases in satisfaction, loyalty and repurchase of the brand (Cermak & Prince, 1994; Wind & Rangaswamy, 2001).
King et al. (2014) found, based on several studies, that eWOM has been proven to impact several individual level outcomes which include factors closely related to loyalty and loyalty
itself: consumer’s willingness to purchase a product; consumer engagement, and levels of trust
and loyalty. In addition, customer to customer interactions has been known to promote engagement and loyalty. Popular e-tailers, such as Amazon, currently explore customer to customer interaction opportunities through redirection of pre-purchase questions to customers who are already in the post-purchase phase.
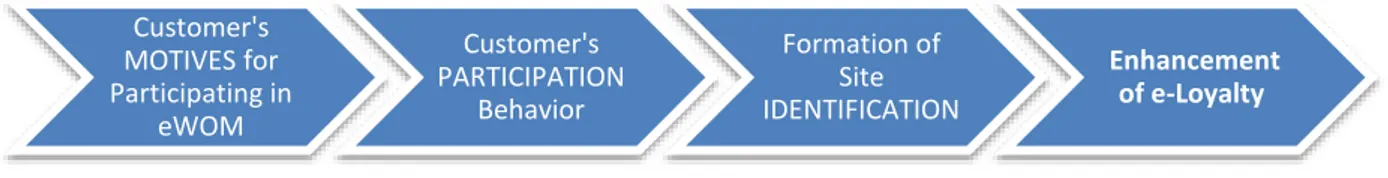
C.W. Yoo et al (2013) has built a conceptual framework that builds on motivation, participation, and identification theories. Their research goal was to prove that eWOM participation behavior would improve a participant’s e-loyalty feelings. In the first stage of their model (Figure 3), the individual is influenced by a series of motives classified in intrinsic (i.e., interest, enjoyment and satisfaction) and extrinsic (i.e., compensation) types. Following the idea that increased customer participation leads to increases in intrinsic motives, customer interaction during the
purchase process through eWOM feedback may significantly enhance a participant’s personal
website identification. Finally, increases in a participant’s website identification are thought to cause increases in e-loyalty feelings towards that website.
Figure 3. Conceptual framework for enhancement of e-loyalty (Yoo et al, 2013).
The motivational theory explains what are the factors that boosts eWOM participation (e.g., concern for other customers or self-esteem improvement), and it is usually broken into intrinsic and extrinsic motives. The participation segment of the framework explain whether or not the
customer’s eWOM behavior leads to positive or negative attitude toward the product/service. At this stage, a customer with a high degree of participation is more likely to accredit
unsatisfactory service to himself rather than to the service provider (Sedikides & Strube, 1995). The identification theory represents the bridge between participation and e-loyalty through the elucidation of psychological variables. Extra-role behavior enhances the customer’s sense of connectedness and promotes social identity in the group (Dick et al, 2006). Therefore, increased levels of participation relates to higher levels of recognition (Yoo et al, 2013).
Ultimately, Yoo, Sanders and Moon (2013) found that motivation is the most important stage in promoting eWOM systems, specifically internal motivation (intrinsic motives). The results of their study also reveal that the customer’s review participation has significant impact on site identification building.
The importance of further studies on eWOM in the construction of e-loyalty is highlighted here due to the fact that there are still few empirical studies on the subject. Pan, Sheng & Xie (2012) have identified close correlation with positive eWOM and trust, and the subject is indicated as relevant to future research (Yoo et al, 2013). Toufaily et al (2013) have emphasized the importance of studies in areas related to eWOM, including them on topics for future research. They were described in areas such as virtual community/forum, social presence, intelligent communication, learning effect, transactional/relational orientation, and involvement.
2.3. HYPOTHESES
The hypotheses were formulated to measure e-loyalty’s main antecedents according to prior literature, and the significance of two sided effects between customer loyalty and word-of-mouth. This segment should instruct how each hypothesis was formulated based on prior empirical research and theory.
Trust is normally considered a construct of honesty and benevolence dimensions perceived in the behavior of the other party: honesty has to do with fulfilling promises and sincerity, while benevolence has to do with the interest in the wellbeing of the other, without opportunistic intentions (Flavián et al., 2006).
there is lack of knowledge about products and service, feelings of vulnerability, perception of high risk, uncertainty, and switching decisions.
Similar to a loyal customer, a consumer who trusts a product/service is more likely to develop favorable attitudes, pay a price premium, remain loyal, and spread word of mouth (Pan et al., 2012). Ceteris paribus, trusted services will be purchased more often, and have a higher
probability of earning loyal customers in comparison to non-trusted services. Therefore, it is reasonable to expect that such relationship happens also in websites, which conveys to the first hypothesis:
Hypothesis 1 (H1): Trust will positively affect e-loyalty
Consistent with Oliver (1999) and V. Shankar et al. (2003), satisfaction can be defined as the perception of pleasurable fulfillment of a service. Customer satisfaction has often been regarded as a major determinant of e-loyalty, although some empirical evidence has failed to provide strong linkage, whereas other has indicated a complex and complicated indirect relation (Pan et al., 2012).
Empirical research has demonstrated that overall customer satisfaction has a stronger positive effect on loyalty to an online server provider, when compared to an offline alternative. The same study has also found that satisfaction and loyalty has a reciprocal relation, positively reinforcing each other, and that it is further strengthened in an online environment (Shankar et al., 2003).
Marketing scholars have argued that satisfaction with the value of a product or service is a key determinant to customer loyalty (Picon et al., 2013), and the fulfillment of customers’ expectations will lead to an increase in their future purchase intention. For example, Casalo et al. (2008) have found that greater degrees of individual loyalty have emerged from greater degrees of consumer satisfaction levels, and Lee et al. (2013) have found that customer satisfaction influences e-loyalty.
Satisfied customers, in similarity with loyal customers, are more likely to repurchase, lower their price sensitivity, and engage in positive word of mouth recommendation. It is logical to assume that customers, when constantly satisfied, are on their path to becoming loyal (Picon et al, 2013). Therefore, this study tests the subsequent hypothesis:
The feeling of commitment towards a website reflects the intention of repeat behavior (Allegui & Temessek, 2004). Repeat purchase behavior, together with attitudinal preference, is a condition considered essential to the concept of loyalty (Toufaily et al., 2013). Loyalty has also been referred to as a commitment to repeatedly purchase a preferred product or service or to become a regular customer of a particular seller (Oliver, 1999).
Customer commitment has been defined as “a stable preference that is bound by an attitude of
resistance to change”, and research has suggested that “tendency to resist changing preference”
provides the main evidence for commitment (Luarn and Lin, 2003). Similar to repurchase behavior, resistance to change is a central concept to loyalty. Therefore, it is to no surprise that Luarn and Lin (2003) found that commitment has a significant impact on e-loyalty. Other empirical studies have also indicated that loyalty, together with trust, are important determinants of online loyalty (Toufaily et al., 2013).
Committed customers are expected to invest more heavily in their relationship with the e-service provider. They perceive greater benefits to loyalty and greater risks to switching to other providers (Pan et al., 2012). Considering the background theory on commitment, I hypothesize that commitment is an antecedent of e-loyalty:
Hypothesis 3 (H3): Commitment will positively affect e-loyalty
Desire can be understood as both the starting point and the end point of action: the starting point is the arousal of an initial desire, and the end point is the end of the action, which is considered complete when the object of desire is achieved. Aristotle believed that the object of desire is
“the starting point of practical reason, while its final stage is the beginning of action”. Therefore,
desire and practical reason are not independent lines of causation, but rather a single causal path from the object of desire to practical reason/imagination to action (Mertz Hsieh, 2013). Independent of which factors affect each individual’s information sharing desire, it is logical to infer that when a crowd has stronger desires for an outcome, the probability of that outcome happening increases in both number (quantity) and depth (quality).
The quality of eWOM environment can be defined as a sum of three factors impacting the consumer’s perception of a website’s eWOM: the argument quality, source credibility and
perception about the credibility of users practicing eWOM on the site (i.e. how knowledgeable
and sincere they are); and perceived quantity of reviews is based on consumer’s perceptions
regarding the volume of reviews and the popularity of corresponding products and services within a website (Zhang et al., 2014).
I assume that important e-tailers such as Amazon.com and eBay have enhanced eWOM environments in their websites because they recognize the importance of user comments and reviews to their business. These e-tailers tend to have sophisticated eWOM systems, which enable unidentified users to post reviews to a minimum effort by using a rating system instead of writing long testimonials. Such options stimulate a wider breadth and depth of users’ reviews because it reduces impeditive feelings to action (e.g., loss of time and personal privacy) during the practical reasoning process. Therefore:
Hypothesis 4 (H4): information-sharing desire has a positive effect on the quality of the eWOM environment
Behavioral intention can be defined as an individual’s readiness to perform a given behavior, which implies that it is an immediate antecedent of behavior (Ajzen, 2002). Zhang et al. (2014) studied the quality of eWOM on behavioral intention, which they defined as “consumer’s willingness to purchase products or services after they process issue-relevant online reviews”. Their findings support that argument quality, source credibility, and perceived quantity of reviews are all important determinants of behavioral intention.
Purchase intention is a kind of behavioral intention. Balakrishnan et al. (2014) investigated purchase intention and brand loyalty, and found that eWOM, a parallel factor to online communities and online advertisement, has positive effects in purchase intention and brand loyalty. According to them, there may be several meanings to the definition of purchase intention, which they state as “the subjective judgment by the consumers reflected after general
evaluation of products or services”. The different meanings are (1) consumer willingness to
consider buying, (2) buying intention in the future, and (3) decision repurchase. Several authors (Doong, Wang, & Shih, 2008; Luarn & Lin, 2003) have defined e-loyalty in a very similar manner: an intention to maintain the behavior on the Web, such as the intention to revisit, reorder or repurchase.
and loyalty (Awad and Ragowsky 2008; Gauri, Bhatnagar,and Rao 2008). As an example, consumers have been actively seeking eWOM instead of an after-sales service. The eWOM helps them understand what other consumers are experiencing, and these actions can significantly affect loyalty. A number of studies, especially those involving brand communities, have demonstrated how customer to customer interactions can heighten participants’ engagement and loyalty (King, 2014). In addition, consumer engagement has been considered a key factor in gaining consumer loyalty (Blazevic et al., 2013). In accordance to this background theory, I hypothesize that:
Hypothesis 5 (H5): the quality of the eWOM environment has a positive effect on e-loyalty
2.3.1. Model Development
The literature review was used to identify which are the main antecedents of customer e-loyalty toward an online service. The selection of variables was made based on a comparison of different theoretical frameworks, in addition to the breadth (number) and depth (effectiveness) of these factors in academic research literature. Empirical findings of the antecedents and descendants of eWOM were used as building blocks to design the project’s own theoretical framework. Therefore, eWOM was included in the same model as antecedents of e-loyalty such as satisfaction, trust and commitment.
Figure 4. The theoretical model.
TRUST
e-Loyalty
QUALITY OF THE EWOM ENVIRONMENT SATISFACTION
H1
H2
H6
COMMITMENT
H3
INFORMATION SHARING
DESIRE
METHOD
This thesis uses a causal design approach through cross-sectional survey. The form of collection is through the Internet, with administration made online. The impersonality of this form of data collection is considered positive because it avoids unwanted bias risks related to face-to-face interviews. Internet survey is also proven to be a practical, fast, economical and overall convenient mode of data collection.
3.1. RESEARCH PURPOSE
When testing the hypotheses, this research should also show which variable is the most effective antecedent of e-Loyalty. Furthermore, the significance of eWOM’s dual relationship (as possible antecedent and consequent) to customer e-loyalty will be analyzed. To test the hypotheses and measure the variables, the chosen method in data analysis is “Structural
Equations Modeling” (SEM), which is also known as analysis of covariance structures, or causal modeling. The goal of this approach is to determine whether sample data can support a theoretical model. SEM if the appropriate choice when the purpose of research is to advance the existing knowledge on the complex relationships of constructs (Barros, 2010).
3.2. QUESTIONNAIRE DESIGN
To standardize findings to the same kind of online product and e-service, only one category was chosen: online book purchases, a common e-service choice among Millennial consumers. The major content sections created at the platform SurveyMonkey are the (1) cover letter with general profile questions (e.g., how many online purchase do you make?); (2) items in a 7-point likert scale (strongly disagree, disagree, slightly disagree, neutral, slightly agree, agree, and strongly agree) designed to extract the subject’s perception (i.e., how much do you agree?); and
(3) specifics on the respondent’s demographic characteristics.
3.2.1. Scales
Lee et al. (2013). EWOM and the “information sharing desire” variable had scales adapted from Lee et al. (2013). “Quality of the eWOM environment” had scales adapted from Zhang et al.’s (2014). A table listing the scales and their respective authors is provided in the Appendix A. 3.2.2. Pre-Test
A pilot test was made in a sample of twenty subjects (ten of each country) to verify whether there are unexpected answers, or feedback questions and recommendations that will indicate
improvements to the survey’s objectivity, content clarity and flow. Of these twenty subjects, five made the survey in the live presence of the author, and fifteen completed the survey by themselves, sending their feedbacks in the survey itself (i.e., a special field was created to encourage feedback).
In the pre-test phase, all aspects of the questionnaire were tested: content, wording, sequence, form and layout, question difficulty, and instructions (Malhotra and Peterson, 2006). According
to the feedbacks received, there were no issues in regards to the questionnaire’s content, form and layout, and question difficulty. The issues with wording, sequence, and instructions were resolved by (1) rewriting titles and scales to improve understanding of their original meaning, (2) reevaluating logic and required questions; and (3) explaining in few words what is eWOM and whether students should include academic books in their estimates.
3.3. SAMPLE
The nonprobability sampling technique chosen for this study is classified as “convenience sampling”. In accordance to the characteristic of this technique, the selection of the sampling units was made primarily by the researcher, who was also the main responsible for delivering the survey. Convenience sampling has the advantages of being inexpensive and fast; and the serious disadvantage of suffering from selection bias (Malhotra and Peterson, 2006), which was reduced here by selecting individuals of various age ranges (within an eighteen year span), living in different geographical locations (within two or more locations in Brazil and the US), and belonging to different social classes (upper middle and lower upper classes).
consumers, which represents more than the sum of all other generations (Nielsen N.V., 2014). Approximately half of these individuals were students, and the age varied to mimic the different age groups that is a characteristic of this generation.
The total size of the sample consisted of 242 people; 123 living in the US, and 119 in Brazil. The subjects chosen for this research were drawn from a nonprobability sample, where respondents are selected through network ties, and influenced by convenience and availability.
3.4. PROCEDURE FOR DATA ANALYSIS
Data was extracted from the SurveyMonkey website service to Excel, codified (refer to Appendix D for further details), and the statistical significance of results were measured in Smart PLS, a software program. Hypothesis were tested and measured using the partial least squares structural equation modeling (PLS-SEM) method.
3.4.1. Structural Equation Modeling (SEM)
Structural Equation Modeling (SEM) is a second-generation multivariate data analysis method that is often used in marketing research because it can test theoretically supported linear and additive causal models. There are distinct approaches to SEM: the widely applied Covariance-based SEM (CB-SEM); the Partial Least Squares (PLS), which focuses on the analysis of variance; and the component-based SEM known as Generalized Structured Component Analysis (GSCA) (Wong, 2013).
The CB-SEM method is popularly used when the sample size is large, the data normally distributed, and the model is correctly specified. PLS is advantageous in situations were the sample size is small, predictive accuracy is paramount, and the correct model specification cannot be ensured (Wong, 2013).
Figure 5. The research model in the PLS-SEM software
The coefficient of determination (or R2) is used for measuring goodness of fit in linear regression models. It is the square of the multiple correlation coefficient between the study and explanatory variables based on data extracted from a sample (Cheng et al., 2014). Path coefficients, which are also known as standardized regression coefficients, indicate that each unit change in an exogenous variable results the amount of change expected in the endogenous
variables (Gunuc and Kuzu, 2015). The “bootstrapping” technique is applied to confirm
significance of the path coefficients in the model. This technique estimates standard errors and t-values in the basis of large subsamples of the original data with no distributional assumptions (Hair et al., 2013).
Establishing reliability and validity for all latent variables in the research is essential to complete the examination of the structural model (Wong, 2013). The following table demonstrates the procedure for verifying reliability and validity in the PLS-SEM (table 1).
Technique Criterion
Indicator Reliability Test the Cronbach’s alpha for all the variables in the research variables. A value equal or below 0.6 indicates unsatisfactory internal-consistency reliability (Malhotra and Peterson, 2006). Therefore, all scales should score above 6.0.
Internal Consistency Reliability
Composite reliability should be 0.7 or higher. If it is an exploratory research, 0.6 or
higher is acceptable. (Bagozzi and Yi, 1988) Convergent validity It should be 0.5 or higher (Bagozzi and Yi, 1988)
Discriminant validity Fornell and Larcker (1981) suggest that the “square root” of AVE of each latent
variable should be greater than the correlations among the latent variables
Reliability is when a measure produces consistent results even when same entities are measured
in different conditions (Field, 2013). The coefficient alpha, or Cronbach’s alpha, is a measure
RESULTS
4.1. DEMOGRAPHIC AND PROFILE OVERVIEW
Twenty out of 242 respondents stated either that they didn’t purchase books online or didn’t purchase books at all. Because the research sample involved many students (48% or 115 to be
precise), the number of people that don’t purchase books online is unreliable. The real
percentage of people who do not purchase books online in a sample representative of the
Millennial population should be at least 50% greater in the author’s opinion. Table 2 illustrates the information in percentages.
Table 2. Total number of respondents who do not purchase books online
Amazon is by far the preferred online store for book purchase with 62% of the sample’s preference. Brazilian bookstores with online retail operations comes in second with 17%. US bookstores with e-tailing operations and Brazilian e-tailers (sellers of books and other products and services) are both tied in 5%. Respondents that left this option in blank amount to 4%. The graphic representation in full detail can be found in Figure 6.
Figure 6. Preference for online book store
62% 17%
5% 5%
2%4% 1%4%
Amazon
BR Bookstore
US Bookstore
BR e-tailer
International E-tailer
Brick n Click Exclusive
Only Used Books
Unknown or Undecided
Condition Count %
Never purchase books 4 2%
The sample can be characterized by preferring the online environment for book purchase: 67% uses an online e-tailer over an offline alternative. The sample’s frequency of purchase is rather low, with the vast majority not exceeding 3 book purchases per semester (majority in the one to two purchases per semester). The money spent per semester is also surprisingly low, considering approximately half the sample were students. The data suggests that millennials prefer practical and cheap options for their need to acquire books, as shown in Figures 7, 8, and 9.
Figure 7. Online vs. offline book purchase activity
Figure 8. Online book purchase frequency
Figure 9. Semester long expense with online book purchase
The demographic characteristics of the sample were split in radically different locations: 119 respondents live in Brazil, while 123 live in the United States. The ages where distributed evenly, although all the sample below 23 years of age is living in the US. Most respondents were identified as men: 128 men and only 84 women. The majority of respondents were single
32 42
83
65
L E S S T H A N 4 0 %
4 0 - 6 0 % 6 1 - 9 0 % 9 1 - 1 0 0 %
0 20 40 60 80 100 120
less than once per semester 1 to 2 times per semester 3 to 4 times per semester 5 to 6 times per semester more than once per month
59 72 54 24 13 0 20 40 60 80
less than $50 from $50 to $99
from $100 to $199
from $200 to $299
(129); only 68 were married. The majority of respondents are students (115), while 83 respondents were either working full time or part time. The amount of unemployed respondents and employed and studying at the same time were minimal (7 and 9 respectively). Almost half the sample (96) are either pursuing (or finished with) an MBA or other post-graduate degree, while 53 respondents are either pursuing or finished with their Bachelor studies. Income was mostly below 25 thousand dollars a year, with the higher ranges evenly distributed. This demographic information is the least reliable because certain respondents were confused as to whether include the income of their close relatives (i.e., parents) or not.
4.2. RESEARCH MODEL AND HYPOTHESES
The highest R2in the model is 0.534. This means that the three exogenous latent variables (Satisfaction, Trust, Commitment, and Quality of the eWOM Environment) explain 53.4% of the variance in the endogenous latent variable e-Loyalty. The other endogenous latent variable with a coefficient of determination is Quality of the eWOM Environment (0.094). Meaning that the exogenous latent variable of Information Sharing Desire has a small predictive value of 9.4% for the variable Quality of the eWOM Environment.
Path coefficient values in the inner model suggest that Commitment has the strongest effect on e-Loyalty (0.455), followed by Trust (0.256) and Satisfaction (0.134). The endogenous variable
“the Quality of the eWOM Environment” has the least effect on e-Loyalty (0.101). Commitment was found to be the only strong predictor of e-Loyalty. Trust was found to be a moderate predictor, while Satisfaction and “Quality of the eWOM Environment” were found to be weak predictors.
The path coefficient 0.101 from the relation between variables “Quality of the eWOM Environment” and e-Loyalty is borderline acceptable. To confirm significance of this and other
measures, the “bootstrap” technique is applied (Figure 10). The t-test indicates 1.92, slightly below 1.98 threshold. In addition, its p-value is slightly above 0.05, which is also considered a measure indicative of insignificance (table 3). Therefore, “Quality of eWOM Environment”
was considered insignificant. All other variables in the model have significant total effects on e-Loyalty.
Figure 10.The “Bootstrap” technique applied to verify T-Test values.
Paths Beta (β) Mean (M) Standard Error T Statistics P Values
Commitment e-Loyalty
0.455 0.455 0.051 8.848 0.000
Info Sharing Desire
Quality of the eWOM Environment
0.313 0.320 0.068 4.619 0.000
Quality of the eWOM Environment e-Loyalty
0.101 0.100 0.053 1.920 0.055
Satisfaction e-Loyalty 0.134 0.127 0.060 2.222 0.027
Trust e-Loyalty 0.256 0.256 0.062 4.107 0.000
Table 3.The “Bootstrap” technique is applied to verify the significance of predictor variables
An important reliability criterion for the data is the number of iterations reached in the Partial
Least Square’s SEM result. When checking this number, the user must be sure that the
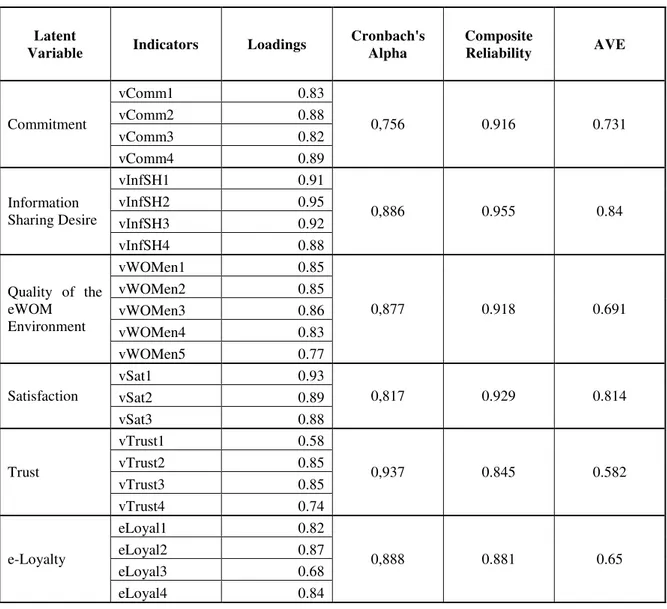
The Cronbach’s Alpha from all scales are well above the 6.0 threshold is positive, which is indicative that the scales are reliable (see table 4).
Latent
Variable Indicators Loadings
Cronbach's Alpha
Composite
Reliability AVE
Commitment
vComm1 0.83
0,756 0.916 0.731
vComm2 0.88
vComm3 0.82
vComm4 0.89
Information Sharing Desire
vInfSH1 0.91
0,886 0.955 0.84
vInfSH2 0.95
vInfSH3 0.92
vInfSH4 0.88
Quality of the eWOM
Environment
vWOMen1 0.85
0,877 0.918 0.691
vWOMen2 0.85
vWOMen3 0.86
vWOMen4 0.83
vWOMen5 0.77
Satisfaction
vSat1 0.93
0,817 0.929 0.814
vSat2 0.89
vSat3 0.88
Trust
vTrust1 0.58
0,937 0.845 0.582
vTrust2 0.85
vTrust3 0.85
vTrust4 0.74
e-Loyalty
eLoyal1 0.82
0,888 0.881 0.65
eLoyal2 0.87
eLoyal3 0.68
eLoyal4 0.84
Table 4. Indicator loadings, and AVE, composite reliability, and Cronbach’s alpha for the Variables.
Prior literature has suggested the use of “Composite Reliability” as a replacement (Wong, 2013) to Internal Consistency Reliability. It can be observed in Table 12 that all values are much larger than 0.7. Therefore, high values of consistency reliability is demonstrated among all latent variables. Convergent validity is reached because all AVE values are above 0.5.Fornell and Larcker (1981) suggest that discriminant validity should be found by comparing the square root of AVE values with the correlation values among the latent variables. Even though the method dates back to 1981, Marketing studies in related fields (e.g., Zhang et al., 2014) are currently using the same procedure to achieve discriminant validity. The square root of each latent
Commitment Info Sharing.. Quality of the... Satisfaction Trust e-Loyalty
Commitment 0.855
Info Sharing Desire 0.174 0.917
Quality of the
eWOM ... 0.374 0.313 0.831
Satisfaction 0.329 0.055 0.318 0.902
Trust 0.42 0.095 0.388 0.607 0.763
e-Loyalty 0.644 0.149 0.413 0.471 0.567 0.806
Table 5. Method to establish discriminant validity.
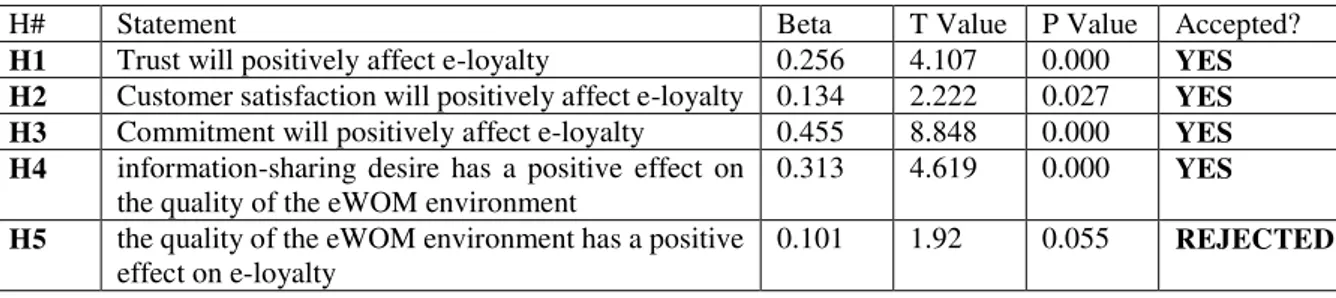
Now that the model has been tested for validity, reliability, and path significance, the research hypothesis may be accepted or rejected. With the exception of hypothesis 5, all hypothesis were accepted. The hypothesis “the quality of the eWOM environment has a positive effect on
e-loyalty” was rejected because it is statistically insignificant. The decision was made in consequence of the low path coefficient, and the insignificance indicated in the t and p values for the path relation coefficient that simulated the statement. Table 6 clearly indicates whether the hypotheses were accepted or rejected, together with their corresponding beta, t and p values.
H# Statement Beta T Value P Value Accepted?
H1 Trust will positively affect e-loyalty 0.256 4.107 0.000 YES H2 Customer satisfaction will positively affect e-loyalty 0.134 2.222 0.027 YES H3 Commitment will positively affect e-loyalty 0.455 8.848 0.000 YES H4 information-sharing desire has a positive effect on
the quality of the eWOM environment
0.313 4.619 0.000 YES H5 the quality of the eWOM environment has a positive
effect on e-loyalty
0.101 1.92 0.055 REJECTED
Table 6. Testing the research hypotheses
All linear regression coefficients (factor loadings) are submitted to a square root. Table 7 illustrates the reliability values for each indicator. While most values are near or above the 0.7 range, four indicators have values that are significantly below the preferred threshold. These
indicators are “vWOMen5” (0.59), “vTrust1” (0.34), “vTrust4” (0.55), and “eLoyal3” (0.46).
Latent Variable Indicators
Indicator Reliability (i.e., loadings^2)
Commitment
vComm1 0.69 vComm2 0.78 vComm3 0.68 vComm4 0.78
Information Sharing Desire
vInfSH1 0.83 vInfSH2 0.90 vInfSH3 0.85 vInfSH4 0.78
Quality of the eWOM Environment
vWOMen1 0.72 vWOMen2 0.73 vWOMen3 0.74 vWOMen4 0.68
vWOMen5 0.59
Satisfaction
vSat1 0.87 vSat2 0.79 vSat3 0.78
Trust
vTrust1 0.34
vTrust2 0.72 vTrust3 0.73
vTrust4 0.55
e-Loyalty
eLoyal1 0.68 eLoyal2 0.76
eLoyal3 0.46
eLoyal4 0.71
Table 7. Reliability values for each research indicator.
After the extraction of the four indicators, the research model is submitted to the PLS-SEM factor loadings, and quality criterion process. The first model had drastic changes in the path coefficient from the variable Trust to the variable e-Loyalty, which decreased substantially (from 0.256 to 0.142). This is understandable, since this latent variable is now dependent of only half the reflective indicators it once had. On the relation between the variables e-Loyalty
and “Quality of the eWOM Environment”, a surprising change emerged after the
“bootstrapping” technique was applied. Table 8 illustrates the radical change in the model.
The algorithm from the model has now converged in the fifth iteration (one iteration less in relation to the first analysis). Cronbach’s alpha, composite reliability, average variance extracted (AVE) values and discriminant validity had values above the threshold. Because the relation between variables e-Loyalty and “Quality of the eWOM Environment” had a path coefficient increase (from 0.101 to 0.118), t-value increase (from 1.92 to 2.158) and p value decrease (from 0.055 to 0.031), it is now considered statistically significant (Table 8). Therefore, after following a stricter method for validation of indicators, hypothesis 5 is now confirmed (Table 9).
H# Statement Beta T Value P Value Accepted?
H1 Trust will positively affect e-loyalty 0.142 2.094 0.037 YES H2 Customer satisfaction will positively affect e-loyalty 0.179 2.701 0.027 YES H3 Commitment will positively affect e-loyalty 0.470 8.764 0.000 YES H4 Information-sharing desire has a positive effect on
the quality of the eWOM environment
0.305 4.656 0.000 YES
H5 The quality of the eWOM environment has a
positive effect on e-loyalty
0.118 2.158 0.031 YES
Table 9. Final results from the analysis of the model after the extraction of weak indicators.
Besides this important change, there weren’t other significant alterations to the model. It is important to note the slight increase in significance for Commitment and Satisfaction as predictors of e-Loyalty. These changes indicate that satisfaction and commitment suffer mediation effects with either the variables Trust and e-Loyalty, or both.
In conclusion to the data analysis procedure made using two different indicator reliability methods, the author determines that hypothesis 5 should be accepted. The rationale for this decision is straightforward: the stricter indicator reliability method should yield a more trustworthy result. The fact that the model had one less iteration (5 instead of 6) after the removal of the four indicators corroborates with this line of thought. Therefore, all hypotheses were accepted. Table 10 illustrates the final decision to the research hypotheses.
Hypothesis 1 Trust will positively affect e-loyalty ACCEPTED
Hypothesis 2 Customer satisfaction will positively affect e-loyalty ACCEPTED
Hypothesis 3 Commitment will positively affect e-loyalty ACCEPTED
Hypothesis 4 Information-sharing desire has a positive effect on the quality of the
eWOM environment
ACCEPTED
Hypothesis 5 The quality of the eWOM environment has a positive effect on e-loyalty ACCEPTED