Graph analysis of verbal fluency t est discriminat e bet ween pat ient s wit h Alzheimer’ s disease, Mild Cognit ive Impairment and normal elderly
cont r ols
Lai ss Ber t ol a, Nat al i a Bezer r a Mot a, Maur o Copel l i , Thi ago Ri ver o, Br eno Sat l er de Ol i vei r a Di ni z, Mar co Aur el i o Romano-Si l va, Romano-Si dar t a Ri bei r o and Leandr o Fer nandes Mal l oy-Di ni z
Jour nal Nam e : Fr ont i er s i n Agi ng Neur osci ence
ISSN: 1663-4365
Ar t i cl e t ype : Or i gi nal Resear ch Ar t i cl e Fi r st r e ce i ve d on: 24 Mar 2014
Re vi se d on : 17 Jun 2014
Graph analysis of verbal fluency test discriminate between patients
1with Alzheimer’s disease, Mild Cognitive Impairment and normal
2elderly controls
34
Laiss Bertola 1 *★, Natália Bezerra Mota 2★, Mauro Copelli 3, Thiago Rivero 1, Breno Satler Diniz 1,4, Marco 5
Aurélio Romano-‐Silva 4,5, Sidarta Ribeiro 2, Leandro Fernandes Malloy-‐Diniz 1,4 6
★
These authors contributed equally to this study. 7
8
1
Laboratory of Clinical Neuroscience Investigations (LINC), Federal University of Minas Gerais, Belo Horizonte, Minas
9
Gerais, Brazil
10 2
Brain Institute, Federal University of Rio Grande do Norte, Natal, Brazil
11 3
Physics Department, Federal University of Pernambuco, Recife, Pernambuco, Brazil
12 4
Mental Health Department, Faculty of Medicine, Federal University of Minas Gerais, Belo Horizonte, Minas Gerais,
13
Brazil
14
5National Institute of Science and Technology – Molecular Medicine, Faculty of Medicine, Federal University of Minas 15
Gerais, Belo Horizonte, Minas Gerais, Brazil
16
* Correspondence: Laiss Bertola, Laboratory of Clinical Neuroscience Investigations (LINC), Faculty of Medicine,
17
Federal University of Minas Gerais, Av. Alfredo Balena, 190 office 235, Belo Horizonte, Minas Gerais, CEP 30.130-‐100,
18
Brazil [email protected] 19
Keywords: Semantic verbal fluency, graph analysis, elderly, Alzheimer´s disease, Mild Cognitive Impairment. 20
21
Abstract 22
Verbal fluency is the ability to produce a satisfying sequence of spoken words during a given time
23
interval. The core of verbal fluency lies in the capacity to manage the executive aspects of language.
24
The standard scores of the semantic verbal fluency test are broadly used in the neuropsychological
25
assessment of the elderly, and different analytical methods are likely to extract even more
26
information from the data generated in this test. Graph theory, a mathematical approach to analyze
27
relations between items, represents a promising tool to understand a variety of neuropsychological
28
states. This study reports a graph analysis of data generated by the semantic verbal fluency test by
29
cognitively healthy elderly (NC), patients with Mild Cognitive Impairment – subtypes amnestic
30
(aMCI) and amnestic multiple domain (a+mdMCI) - and patients with Alzheimer’s disease (AD).
31
Sequences of words were represented as a speech graph in which every word corresponded to a
32
node and temporal links between words were represented by directed edges. To characterize the
33
structure of the data we calculated 13 speech graph attributes (SGAs). The individuals were
34
compared when divided in three (NC – MCI – AD) and four (NC – aMCI – a+mdMCI – AD)
35
groups. When the three groups were compared, significant differences were found in the standard
36
measure of correct words produced, and three SGA: diameter, average shortest path, and network
37
density. SGA sorted the elderly groups with good specificity and sensitivity. When the four groups
38
were compared, the groups differed significantly in network density, except between the two MCI
39
subtypes and NC and aMCI. The diameter of the network and the average shortest path were
40
significantly different between the NC and AD, and between aMCI and AD. SGA sorted the elderly
analysis
in their groups with good specificity and sensitivity, performing better than the standard score of the
42
task. These findings provide support for a new methodological frame to assess the strength of
43
semantic memory through the verbal fluency task, with potential to amplify the predictive power of
44
this test. Graph analysis is likely to become clinically relevant in neurology and psychiatry, and
45
may be particularly useful for the differential diagnosis of the elderly.
46
1. Introduction
47
Language and semantic memory tend to remain stable across the human lifespan in contrast to other
48
cognitive domains, like episodic memory and attention, which usually decline after the 5th decade 49
(Craik & Bialystok, 2006). They are also usually spared in the initial stages of neurodegenerative 50
disorders, such as Alzheimer’s disease (AD), though we can still observe milder deficits, e.g. 51
anomia or reduced semantic verbal fluency, which can be identified in a comprehensive 52
neuropsychological evaluation (Taler & Phillips, 2008; Garrard et al., 2005; Henry et al., 2004; 53
Nutter-Upham et al., 2008). 54
Verbal fluency is the ability to produce a satisfying sequence of spoken words during a given time 55
interval (Nickels, 2001). Verbal fluency tests are experimentally designed to assess this ability 56
through the production of words starting with a specific letter (Phonemic Verbal Fluency) or 57
belonging to a category of knowledge (Semantic Verbal Fluency). Semantic verbal fluency is one of 58
the most commonly used tasks to evaluate language and semantic memory skills in older adults. 59
This task depends on the preservation of language (e.g. words can be spoken correctly during the 60
task), though it is significantly influencedby semantic memory (e.g. the knowledge of the category 61
asked must be intact) and executive function (e.g. the ability to search the asked knowledge) 62
domains (Unsworth et al., 2011; Adlam et al., 2006). This task often activates the temporal lobe, a 63
region broadly related to conceptualization, general information and knowledge about names 64
(Patterson et al., 2007). Semantic verbal fluency contributes to predict future cognitive and 65
functional impairments in the elderly (Aretouli et al., 2011; Hodges et al., 2006; Amieva et al., 66
2005; Salmon et al., 2002), and predicttheprogression from MCI to AD (Saxton et al., 2013). 67
Despite being widely used for neuropsychological assessment in the elderly, the standard measure 68
of the verbal fluency test is restricted to the total of correct words produced in the task (Strauss et 69
al., 2006; Lezak, 2004), and does not take into account other clinically-relevant information that 70
may be contained in the patient’s specific performance. This task requires the production of words 71
belonging to a specific category, and each subject produced the words following an order of 72
exemplars during the one-minute task. This order of words produced allows the construction of a 73
network based on the temporal link between the words.These temporal links may inform that words 74
produced in a specific temporal sequence are probably conceptually related, as suggested by the 75
semanticassociation models (Griffiths et al., 2007; McClelland & Rogers, 2003). 76
Goni et al. (2010) constructed a semantic network using the verbal fluency task applied to an adult 77
sample,and represented the semantic memory as a graph ruled by conceptual constraints. A normal 78
semantic verbal fluency network is represented by a directed graph with only one occurrence for 79
each word. Lerner et al. (2009) investigated the network properties of subjects with MCI and AD, 80
and found that the path lengths of the network decline while the clustering coefficient increases in 81
the MCI and AD subjects compared to healthy elderly controls. These results showed that the 82
from normal aging to AD. 84
The analysis of network properties helps understanding the dynamics and organization of the 85
cognitive and behavioral processes. A graph represents a network with nodes linked by edges (Mota
86
et al., 2012). Formally, a graph is a mathematical representation of a network G = (N, E), with N =
87
{w1, w2, … wn} a set of nodes and E = {(wi, wj)} a set of edges or links between words wi in N and 88
wj in N. The interpretation of the meaning of a graph depends on what is being represented (Mota et 89
al., 2012; Butts, 2009). We carried out an analysis of the network properties of the semantic verbal 90
fluency of subjects with MCI or AD. We hypothesize that the analysis of the semantic verbal 91
fluency network properties can help to better discriminate between older adults with normal
92
cognitive performance, mild cognitive impairment or Alzheimer’s disease. This approach had been
93
used with success to identify patients with schizophrenia and bipolar disorder. (Mota et al., 2012;
94
Mota et al., 2014).
95 96
2. Materials and methods
97 98
2.1. Subjects 99
100
One hundred older adults were included in this study. All subjects were assessed in the Centro de 101
Referência à Saúde do Idoso Jenny de Andrade Faria, Clinical Hospital, Federal University of 102
Minas Gerais. All the participants underwent a comprehensive clinical and neuropsychological 103
assessment. The neuropsychological protocol included the following tests: Mini Mental State Exam, 104
Frontal Assessment Battery, Category Verbal Fluency of Animals and Fruits, Letter Fluency of S, 105
Digit Span, Stick Design Test, Clock Drawing Test, Rey Auditory Verbal Learning Test, Naming 106
Test (TN-LIN), and Token Test. This protocol has been validated for the neuropsychological 107
assessment of older adults with low educational status (de Paula et al., 2013). After the clinical and 108
neuropsychological assessment, and adjudication meeting was held and the final diagnosis was 109
reached by consensus. The AD diagnosis was based on the proposed criteria of McKhann et al. 110
(1984) and the patient should present general and worsening cognitive impairment, in two or more 111
cognitive domains, and functional impairment in the daily living activities. The MCI diagnosis 112
followed the criteria proposed by Winblad et al. (2004), were the older adult presents cognitive 113
decline in one or more cognitive domains but is preserved in basic and instrumental daily living 114
activities or presents a minimal impairment. The MCI subgroup division considered the amnestic 115
MCI (aMCI) classification for participants that only present memory impairment, and amnestic 116
multiple-domain MCI (a+mdMCI) for participants that present impairment in memory and other 117
cognitive domain, though fulfilling all the MCI criteria established by Winblad et al. (2004). 118
The project was approved by the Research Ethics Committee of the Federal University of Minas 119
Gerais (COEP-334/06). The subjects were dividedinto 4 groups: 1) normal cognitive performance 120
(NC), n=25; 2) amnestic single-domain MCI (aMCI), n=25; 3) amnestic multiple-domain MCI 121
(a+mdMCI), n=25; 4) AD, n=25. 122
123
2.2. Verbal Fluency Test 124
125
The participants performed the Semantic Verbal Fluency test, category of animals, for which they 126
were asked to produce the maximum names of animals within 60 seconds; explicit/implicit 127
instructions were given to avoid repetitions.All the words were recorded, including repetitions and 128
analysis
errors, total of repetitions, and the fraction of repetitions according to the total of words produced 130
by each participant.The scores in this task were not taken into account in the diagnosis adjudication 131
of each participant. 132
133
2.4. Statistical Analysis 134
135
The study design involved two stages of analysis, considering three (NC, MCI, AD) or four groups
136
(NC, aMCI, a+mdMCI, AD), and the same statistical analysis and graph measures were performed
137
for comparing the three or four groups. The MCI group comprised both the aMCI and the
138
a+mdMCI groups.
139 140
We performed the Shapiro-Wilk test of normality of the sample, and since the majority of the
141
variables did not fit the assumption of normality, we used the Kruskal-Wallis test of differences
142
between several independent groups and the Wilcoxon Rank sum test for two independent samples.
143
Bonferroni correction was applied to all analyses.
144 145
Group sorting was implemented with a Naïve Bayes classifier, which shows superior performance 146
with small samples (Kotsiantis, 2007; Singh & Provan, 1995). The choice of attributes for the
147
classifier was based on significant correlations of the attributes with established clinical measures of
148
differential diagnosis (global cognitive status and daily living functionality). Sensitivity, specificity
149
and the area under the receiver operating characteristic curve (AUC) were used to estimate
150
classification quality, which was considered excellent when AUC was higher than 0.8, good when
151
AUC ranged from 0.6 to 0.8, and poor (not above the chance), when AUC was smaller than 0.6.
152 153
2.5. Graph Measures 154
155
The word sequence produced on the Semantic Verbal Fluency test was represented as a speech
156
graph, using the software SpeechGraphs (Mota et al., 2014). The program represents a text (in this
157
case, the sequence of words produced by the verbal fluency test) as a graph, representing every
158
word as a node, and the temporal link between words as an edge (Figure 1).
159 160
(Figure 1)
161 162
We then calculated word count (WC) and 13 additional Speech Graph Attributes (SGA) comprising
163
general attributes: total of nodes (N) and edges (E); connected components: the largest strongly
164
connected component (LSC); recurrence attributes: repeated (RE) and parallel edges (PE), cycles of
165
one (L1), two (L2) or 3 nodes (L3); global attributes: average total degree (ATD), density, diameter,
166
average shortest path (ASP) and clustering coefficient (CC) (for more detailed information see
167
Supplementary Table and Figure on Supplementary Material).
168
Given the task instructions, we expected the subjects to produce a linear network, i.e. a sequence in
169
which each correct word was followed by a different correct word, without repetitions. A correct
170
performance in this test should yield graphs with identical number of nodes (N) and words (WC),
171
N-1 edges, no recurrence (i.e. without parallel edges, repeated edges or loops), and zero strongly
172
connected components (LSC). In addition, the average total degree (ATD) should be close to 2,
173
with a very small density, very low clustering coefficient (CC), and large distances (diameter should
174
be equal to E).
3. Results 176
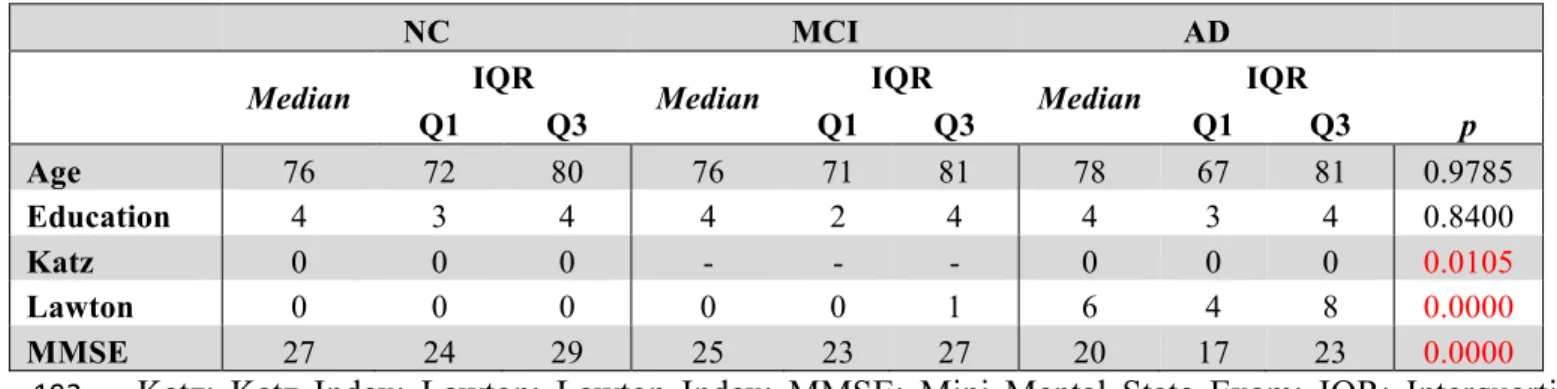
Table 1 shows data for socio-demographic data, Mini Mental State Exam (MMSE), total number of 177
produced words in the verbal fluency test, total number of correct words produced, total number of 178
repetitions performed during the task, the percentage of repetitions performed according to the total 179
of produced words, and the errors produced. 180
The groups did not differ in age and education, and only the control group had a significant 181
difference in gender distributions (X2=6.76, df=2, p=0.009) (table 1). The results of the groups’ 182
comparison on the daily living activities, the global cognitive status are also reported on table 1. 183
Verbal fluency measures and the Speech Graph Attributes are reported on table 2. 184
Despite the lower number of correct words produced by the NC group, it is similar to those 185
observed to Brazilian normative data (Brucki et al., 1997). Moreover, the scores on the verbal 186
fluency test were not taken into account for participant classification into the diagnostic groups. 187
188
Table 1: Socio-demographic data, verbal fluency and Speech Graph Attributes of NC, MCI andAD 189
groups, with Bonferroni-corrected significant differences across groups established by the Kruskal
-190
Wallis comparison 191
NC MCI AD
Median IQR Median IQR Median IQR
p
Q1 Q3 Q1 Q3 Q1 Q3
Age 76 72 80 76 71 81 78 67 81 0.9785
Education 4 3 4 4 2 4 4 3 4 0.8400
Katz 0 0 0 - - - 0 0 0 0.0105
Lawton 0 0 0 0 0 1 6 4 8 0.0000
MMSE 27 24 29 25 23 27 20 17 23 0.0000
Katz: Katz Index; Lawton: Lawton Index; MMSE: Mini Mental State Exam; IQR: Interquartile 192
Range; Q1: 1th Quartile; Q3: 3trd Quartile. 193
194
Table 2: Verbal fluency and Speech Graph Attributes of NC, MCI and AD groups, with Bonferroni -195
corrected significant differences across groups established by the Kruskal-Wallis comparison 196
NC MCI AD
Median IQR Median IQR Median IQR
p
Q1 Q3 Q1 Q3 Q1 Q3
VF.E 0 0 0 0 0 0 0 0 0 1.0000
VF.PR 0 0 0.07 0 0 0.13 0 0 0.1 0.2330
VF.R 0 0 1 0 0 1 0 0 1 0.4462
VF.C 14 12 15 11 10 14 9 7 10 0.0000
VF.TT 15 13 15 12 10 15 9 8 10 0.0000
WC 15 13 15 12 10 15 9 8 10 0.0000
analysis
E 14 12 14 11 9 14 8 7 9 0.0000
RE - - - 0 0 0 0 0 0 0.6034
PE 0 0 0 0 0 0 0 0 0 0.6591
L1 - - - 0 0 0 - - - 0.6065
L2 0 0 0 0 0 0 0 0 0 0.6942
L3 0 0 0 0 0 0 0 0 0 0.0265
LSC 1 1 7 1 1 6 1 1 4 0.7568
ATD 1.86 1.85 2.00 1.87 1.82 2.00 1.80 1.75 2.00 0.2584
Diameter 12 9.00 13.00 9 6.00 12.00 7 5.00 8.00 0.0001
ASP 4.66 3.67 5.20 3.66 2.91 4.67 3 2.29 3.33 0.0001
CC 0 0.00 0.00 0 0.00 0.00 0 0.00 0.00 0.2479
Density 0.07 0.06 0.08 0.08 0.07 0.10 0.10 0.10 0.14 0.0000 VF.E= errors; VF.PR= percentage of repetitions; VF.R= repetitions; VF.C= corrects words; 197
VF.TT= total of words; WC= word count; N= nodes; E= edges; RE= repeated; PE: parallel edges;
198
L1, L2, L3 = cycles of one, two or 3 nodes; LSC= largest strongly connected component; ATD=
199
average total degree; ASP= average shortest path; CC= clustering coefficient 200
201
The groups significantly differedin theperformance on ADLs, in general cognitive status, number 202
of correct words and total words produced, and in the Speech Graph measures of word count, 203
nodes, edges, loops of 3 nodes, diameter, average short path and density. As expected, the NC group 204
performed better at ADLs,had higher scores on the MMSE, produced more nodes, a network with 205
larger diameter and less dense, when compared with the MCI and AD groups. The MCI group 206
showed an intermediate performance between NC and AD groups in all measures. 207
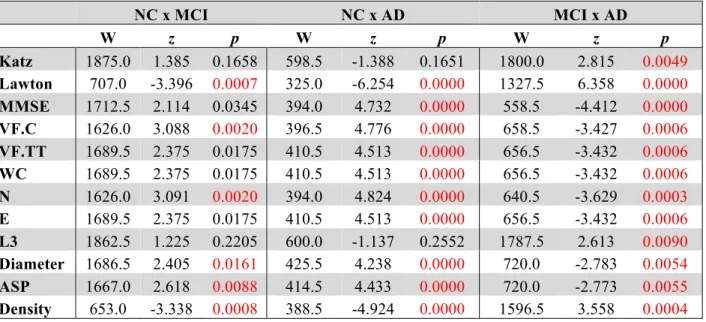
Table 3 and Figure 2.A show pairwise comparisons of the 3 diagnosis groups. Statistical 208
significance was set atp<0.0167, after Bonferroni correction for multiple comparisons. 209
Table 3: Pairwise group comparison with Bonferroni-corrected significant differences between 210
groups established by Wilcoxon Ranksum test
211
NC x MCI NC x AD MCI x AD
W z p W z p W z p
W: Wilcoxon Ranksum; z = z score. 212
(Figure 2)
213 214
The comparison of the variables between NC and MCI groups demonstrate that the groups differ in 215
the index of instrumental daily living activities, in the number of correct words produced, number 216
of nodes, diameter, average short path and density of the network. The NC produced less dense 217
graphs with more nodes, and larger Diameter and ASP than the MCI and AD. Furthermore, NC 218
made more edges, total words produced, and had a better general cognitive status than the AD 219
group. The MCI and AD groups differ in all measures, demonstrating that a change in the general 220
cognitive status, functionality, verbal fluency measures and the speech graph attributes (WC, N, E, 221
L3, Diameter, ASP and Density) almost follow a continuous modification as the diagnosis impairs. 222
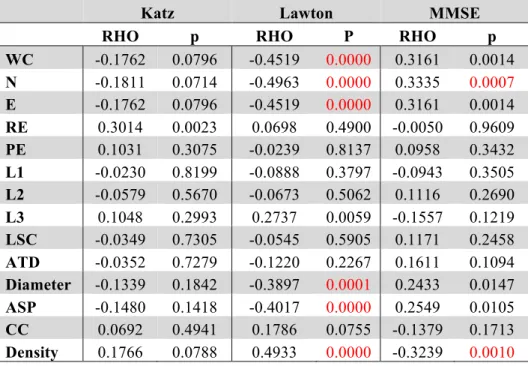
Table 4shows the Spearman correlations between the SGA and the clinical measures of differential
223
diagnosis (global cognitive status – MMSE - and daily living functionality – Katz and Lawton
224
Index). The significance level was established in p=0.0012 after a Bonferroni correction for 42
225
comparisons.
226 227
Table 4: Spearman correlation (RHO and p values) between SGA scores and the Katz, Lawton or
228
MMSE scores.
229
Katz Lawton MMSE
RHO p RHO P RHO p
WC -0.1762 0.0796 -0.4519 0.0000 0.3161 0.0014 N -0.1811 0.0714 -0.4963 0.0000 0.3335 0.0007 E -0.1762 0.0796 -0.4519 0.0000 0.3161 0.0014 RE 0.3014 0.0023 0.0698 0.4900 -0.0050 0.9609 PE 0.1031 0.3075 -0.0239 0.8137 0.0958 0.3432 L1 -0.0230 0.8199 -0.0888 0.3797 -0.0943 0.3505 L2 -0.0579 0.5670 -0.0673 0.5062 0.1116 0.2690 L3 0.1048 0.2993 0.2737 0.0059 -0.1557 0.1219 LSC -0.0349 0.7305 -0.0545 0.5905 0.1171 0.2458 ATD -0.0352 0.7279 -0.1220 0.2267 0.1611 0.1094 Diameter -0.1339 0.1842 -0.3897 0.0001 0.2433 0.0147 ASP -0.1480 0.1418 -0.4017 0.0000 0.2549 0.0105 CC 0.0692 0.4941 0.1786 0.0755 -0.1379 0.1713 Density 0.1766 0.0788 0.4933 0.0000 -0.3239 0.0010 230
We found significant correlations between the MMSE and the SGA attributes Nodes and Density, 231
indicating that the more cognitively preserved elderly produced a larger number of unique nodes, 232
and networks with a smaller density than cognitively impaired subjects. The correlation between the 233
attributes and the Lawton Index of instrumental daily living activities revealed that the more 234
functionally dependent were the elderly, the less words, nodes and edges they produced, showing 235
networks with a smaller diameter and average short path, but a higher density. These results indicate 236
that functional autonomy correlate more with SGA than with the general cognitive status. 237
analysis
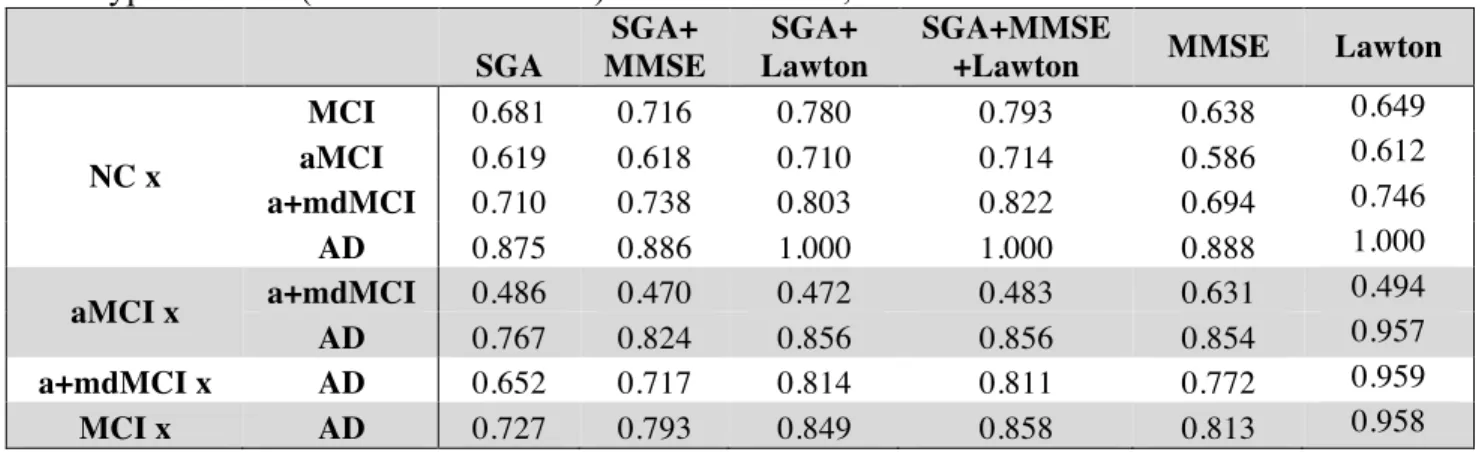
The Naïve Bayes classifier results (Figure 2.C) show that a selection of SGA correlated with 239
functional and cognitive impairment measured by other instruments, provided good to excellent
240
classification power, being similar to the MMSE classification power, or even better for the
241
distinction between the NC and MCI groups. When the SGA were associated to the Lawton Index
242
or the MMSE, the power of classification increased; a combination of the 3 measurements provided
243
maximal classification quality (Table 5). Overall, the combination of graph measures and functional
244
dependence yielded very accurate differential classification of the AD (1.00) and MCI (0.78)
245
against the NC group, and between the MCI and AD (0.84).
246
Table 5:Rating quality measured byAUC, usingSGA (attributes: WC, N, E, Density, Diameter and 247
ASP) correlated with clinical symptoms measured with MMSE and Lawton scales, in addition with 248
Lawton, MMSE or both, classifying AD and MCI from NC, AD from MCI, and also classifying 249
subtypes of MCI (aMCI or a+mdMCI) from NC or AD, or from each other. 250
SGA
SGA+ MMSE
SGA+ Lawton
SGA+MMSE
+Lawton MMSE Lawton
NC x
MCI 0.681 0.716 0.780 0.793 0.638 0.649
aMCI 0.619 0.618 0.710 0.714 0.586 0.612
a+mdMCI 0.710 0.738 0.803 0.822 0.694 0.746
AD 0.875 0.886 1.000 1.000 0.888 1.000
aMCI x a+mdMCI 0.486 0.470 0.472 0.483 0.631
0.494
AD 0.767 0.824 0.856 0.856 0.854 0.957
a+mdMCI x AD 0.652 0.717 0.814 0.811 0.772 0.959
MCI x AD 0.727 0.793 0.849 0.858 0.813 0.958
251
The additional description of the socio-demographic data, Mini Mental State Exam (MMSE), verbal 252
fluency measures of the two subgroups of MCI are reported on table 6, and also the results of the 253
four groups’ comparison on the sociodemographic variables. Table 7 shows the four group 254
comparison on the verbal fluency and Speech Graph Attributes. 255
Table 6: Additional description of socio-demographic data for the MCI subtypes, and the four 256
groups comparison. 257
aMCI a+mdMCI
Median IQR Median IQR p
Q1 Q3 Q1 Q3
Age 75 71 79 79 73 81 0.7561
Education 4 2 5 3 2 4 0.4662
Katz 0 - - 0 - - 0.0279
Lawton 0 0 1 1 0 2 0.0000
MMSE 26 23 28 24 23 26 0.0000
p* group comparison (NC; aMCI; a+mdMCI; AD) 258
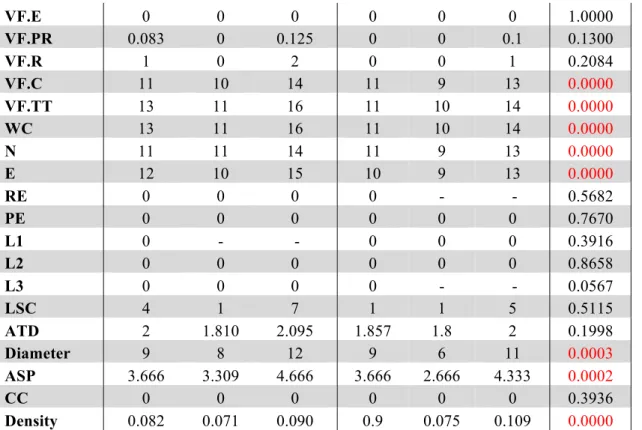
Table 7: Additional description of verbal fluency and Speech Graph Attributes for the MCI 259
subtypes, and the four groups comparison. 260
aMCI a+mdMCI
Median IQR Median IQR p
VF.E 0 0 0 0 0 0 1.0000
VF.PR 0.083 0 0.125 0 0 0.1 0.1300
VF.R 1 0 2 0 0 1 0.2084
VF.C 11 10 14 11 9 13 0.0000
VF.TT 13 11 16 11 10 14 0.0000
WC 13 11 16 11 10 14 0.0000
N 11 11 14 11 9 13 0.0000
E 12 10 15 10 9 13 0.0000
RE 0 0 0 0 - - 0.5682
PE 0 0 0 0 0 0 0.7670
L1 0 - - 0 0 0 0.3916
L2 0 0 0 0 0 0 0.8658
L3 0 0 0 0 - - 0.0567
LSC 4 1 7 1 1 5 0.5115
ATD 2 1.810 2.095 1.857 1.8 2 0.1998
Diameter 9 8 12 9 6 11 0.0003
ASP 3.666 3.309 4.666 3.666 2.666 4.333 0.0002
CC 0 0 0 0 0 0 0.3936
Density 0.082 0.071 0.090 0.9 0.075 0.109 0.0000 261
A comparison of the four groups showed significant differences in daily functionality, general 262
cognitive status, total and correct words produced, and in the SGA word count, nodes, edges, 263
diameter, ASP and density(same attributes found in the three-group comparison). 264
Table 8 and Figure 3.A compare the four groups of elderly, with Bonferroni correction for multiple 265
comparisons (alpha = 0.0083). 266
267
Table 8: Pairwise group comparison in the variables with significant difference across the four 268
groups
269
NC x aMCI NC x a+mdMCI NC x AD
W z p W z p W z p
Katz 625 -0.960 0.3371 625 -0.960 0.3371 598.5 -1.388 0.1651 Lawton 548.0 2.581 0.0099 484 3.758 0.0002 325 -6.254 0.0000 MMSE 583.5 -1.046 0.2956 504 -2.597 0.0094 394 4.733 0.0000 VF.C 525 -2.186 0.0288 476 -3.140 0.0017 396.5 4.777 0.0000 VF.TT 563.5 -1.440 0.1498 501 -2.661 0.0078 410.5 4.514 0.0000 WC 563.5 -1.440 0.1498 501 -2.661 0.0078 410.5 4.514 0.0000 N 526 -2.170 0.0300 475 -3.159 0.0016 394 4.824 0.0000 E 563.5 -1.440 0.1498 501 -2.661 0.0078 410.5 4.514 0.0000 L3 625.0 -0.566 0.5714 612.5 -1.400 0.1614 600 -1.138 0.2552 Diameter 546 -1.778 0.0753 515.5 -2.367 0.0179 425.5 4.239 0.0000 ASP 534.5 -1.994 0.0462 507.5 -2.518 0.0118 414.5 4.433 0.0000 Density 510.5 2.460 0.0139 467.5 3.296 0.0010 388.5 -4.924 0.0000
analysis
Katz 637.5 NaN NaN 587.5 -2.001 0.0454 587.5 -2.001 0.0454 Lawton 577.5 -1.294 0.1958 352 -5.423 0.0000 350.5 -5.335 0.0000 MMSE 545 1.797 0.0723 416 4.301 0.0000 467.5 3.284 0.0010 VF.C 582 1.074 0.2828 471.5 3.334 0.0009 512 2.561 0.0105 VF.TT 573.5 1.238 0.2157 466.5 3.418 0.0006 515 2.486 0.0129 WC 573.5 1.238 0.2157 466.5 3.418 0.0006 515 2.486 0.0129 N 574.5 1.223 0.2213 460.5 3.551 0.0004 505 2.692 0.0071 E 573.5 1.238 0.2157 466.5 3.418 0.0006 515 2.486 0.0129 L3 625 0.960 0.3371 587.5 -1.654 0.0981 575 -2.268 0.0233 Diameter 600.5 0.712 0.4764 495.5 2.901 0.0037 549.5 1.884 0.0595 ASP 602.5 0.671 0.5023 502.5 2.755 0.0059 542.5 2.010 0.0444 Density 597 -0.778 0.4367 467 -3.415 0.0006 504.5 -2.700 0.0069 270
The pairwise comparison detected no significant differences between MCI subtypes in the measures 271
selected in this study. The difference between the NC and aMCI groups occurred only in 272
instrumental daily living functionality, i.e. NC are more independent than aMCI. The significant 273
differences between the NC and AD and between aMCI and AD are similar; the NC and aMCI 274
groups are less functionally dependent, have better cognitive status, produce more total and correct 275
words, a higher word count, more nodes and edges, higher Diameter and ASP, and less dense 276
networks when compared to the AD group. The NC are more functionally independent, produce 277
more total and correct words, a higher word count, more nodes and edges, and a network less dense 278
than the a+mdMCI group. AD subjects, comparable to the a+mdMCI group, were more functionally 279
dependent, showed general cognitive impairment,and produced fewer nodes and a denser network. 280
281
(Figure 03) 282
283
The Naïve Bayes classifier results (Figure 3.B) indicate that the selected SGA has a good 284
classification power to the diagnosis of MCI subtypes against cognitive healthy aging, and also a
285
good classification against the dementia group. On the other hand, SGA yielded a poor
286
classification when used to distinguish between the two subtypes of MCI. When SGA were
287
combined with the Lawton Index, we observed an increase in the power of classification across the
288
four groups, except between the two MCI subtypes.
289 290
The combination of the SGA with the MMSE, showed less power when compared to the
291
combination with the Lawton index; the combination of these three variables barely improved the
292
classification beyond the SGA and Lawton combination. These results indicate that the combination
293
of graph measures and functional dependence again provides for good classification across the three
294
groups (AUC=0.71-0.85), except between the MCI subtypes (AUC=0.47).
295 296
4. Discussion
297
The aim of the present study was to assessgraph-theoretical differences in the execution of a verbal 298
fluency task amongelderly with normal and pathological aging. Our results demonstrate that SGA 299
differed significantly among the AD, MCI and NC groups and it could be used to classify the 300
groups. The present results show the potential of graph analysis of verbal fluency task to 301
discriminate between these groups in clinical practice. 302
The correlation between the SGA and the MMSE or the Lawton Index indicate that the SGA are
304
associated with the general cognitive status and functional performance, two important clinical
305
measures used in geriatric assessment. Patients with worse scores in the MMSE produced fewer
306
numbers of nodes and a less dense network. As the functional performance decreases, indicating
307
more severe cognitive impairment stages, the networks became denser, with a smaller diameter and
308
average short path and with fewer numbers of nodes and edges. Their networks became smaller in
309
the number of words, with a small path through the first word to the last one, and their animals have
310
more connection with different neighbors than would be necessary. Subjects more cognitively
311
impaired tended to perform more dependently on their daily activities. Importantly, some attributes
312
of SGA could indicate the progression of cognitive impairment and functional decline, as shown by
313
denser and smaller networks, with a fewer number of nodes, in subjects with more severe cognitive
314
impairment.
315 316
Application of speech graph analysis for sorting the groups showed moderate to good classification
317
quality. When selected SGA attributes were combined to the Lawton Index, better classification
318
were obtained, suggesting that the combination of these two simple tools of network measure and
319
functionality can provide to the clinician a good indication of differential diagnosis, except for the
320
contrast between the two MCI subtypes, which spanned a continuum and did not allow the
321
differentiation and classification of the two groups.
322 323
The differences prevalent across all groups were in the global attributes of diameter, density and 324
average shortest path (ASP). The results indicate that the networks built by the normal control 325
elderly were more direct, without reoccurrence of words, resulting in a less dense network. 326
Conversely, cognitive impairment corresponded to denser and less direct networks. The density 327
differences across the groups were, among all comparisons,the mostuniform result, except for the 328
comparison between the two MCI subgroups, which yielded a pattern of continuous performance. 329
The progressive worsening of cognitive performance within the MCI subtypes is consistent in the
330
literature, indicating that a group of subtle deficits underlie the differential diagnosis (Diniz et al., 331
2007; Radanovich et al., 2009). 332
333
Even the groups that did not differ in total number of word repetitions differ in the occurrence of 334
loops of 3 nodes (L3). Nearly all subjects, as expected, managed to avoid recurrences, but 20% of 335
the AD subjects repeated the same word with only 2 words of interval (e.g. dog-cat-horse-dog). 336
According to Huntley and Howard (2010), subjects with AD already have working memory deficits 337
at the earliest stages of the disease. The impairment in central executive and episodic buffer 338
functions of working memory probably stems from the difficulty of keeping information in mind 339
while keeping the search for new information. These deficits probably explain the repetition of 340
words in verbal fluency tasks with averysmall interval. 341
342
The results outline a field that needs to be further explored in future studies, involving the density of 343
the networks and the strength between the words in the semantic memory of elderly with 344
pathological aging. The Parallel Distributed Processing Approach of Semantic Cognition predicts 345
that the decrease in strength of the links between words in a semantic network may allow 346
connections between pairs of words that would not be preferential under normal circumstances 347
(McClelland & Rogers, 2003). Another aspect that deserves further investigation is the absence of 348
difference across the groups in the connectivity attributes (LSC, ATD and CC). This raises the 349
hypothesis that even very different networks can share a similar structure of local connections, in 350
analysis
maintaining the integrity of the network’s general connection (De Deyne & Storms, 2008; Bales & 352
Johnson, 2006). 353
354
Considering the graph analysis performed in this study, build-‐up in a co-‐occurrence of the 355
words and based on the temporal link between them, future studies should consider 356
multidimensional scaling and hierarchical clustering analysis. These types of analyses will 357
represent the relation between the variables and combine it into groups, enhancing the 358
results. Future studies should also address the differences between MCI patients and other 359
neurological conditions in which cognitive impairments are quite similar, for example, 360
Temporal Lobe Epilepsy (Holler & Trinka, 2014), as well as the potential association between 361
graph analysis, neuroimaging and other diagnosis instruments. Furthermore, longitudinal 362
studies are also necessary to evaluate whether SGA can help to identify MCI subjects with 363
higher risk of progressing to Alzheimer’s disease. In conclusion, the results suggest that SGA
364
may be a useful tool to help in the differential diagnosis between MCI and AD.
365 366
5. Acknowledgement
367 368
Support obtained from: CNPq Universal 481351/2011-6 and 480053/2013-8, PQ
306604/2012-369
4 and 308558/2011-1, Coordenação de Aperfeiçoamento de Pessoal de Nível Superior (CAPES),
370
FAPERN/CNPq Pronem 003/2011, FACEPE/CNPq PRONEM
APQ-1415-371
1.05/10, Capes SticAmSud, FAPESP Center for Neuromathematics (grant #2013/ 076990,
372
FAPESP), CBB-APQ-337 00075-09, APQ-01972/12-10 and APQ-02755-10 from FAPEMIG; and
373
573646/2008-2 from CNPq. Dr. Diniz is supported by grant from the Intramural Research Program
374
(UFMG) and CNPq (472138/2013-8). The funders had no role in study design, data collection,
375
analysis, decision to publish, or preparation of the manuscript.
376
We thank R. Furtado and P. Petrovitch for IT support, A. Karla for administrative help, and D.
377
Koshiyama for library support.
378 379
6. References1
380
Adlam, A-L. R., Bozeat, S., Arnold, R., Watson, P. & Hodges, J. R. (2006). Semantic knowledge
381
in mild cognitive impairment and mild Alzheimer´s disease. Cortex, 42, 675-684. doi:
382
10.1016/s0010-9452(08)70404-0
383
Amieva, H., Jacqmin-Gadda, H., Orgogozo, J-M., Le Carret, N., Helmer, C., … Dartigues, J-F.
384
(2005). The 9 year cognitive decline before dementia of the Alzheimer type: a prospective
385
population-based study. Brain, 128(5), 1093-1101. doi:10.1093/brain/awh451
386
Aretouli, E., Okonkwo, C. O., Samek, J. & Brandt, J. (2011). The fate of the 0.5s: predictors of
2-387
year outcome in mild cognitive impairment. Journal of International Neuropsychology 388
Society, 17(2), 277-288. doi:10.1017/s1355617710001621
389
Bales, M. E., and Johnson, S. B. (2006). Graph theoretic modeling of large-scale semantic
390
networks. Journal of Biomedical Informatics, 39, 451–464. doi:10.1016/j.jbi.2005.10.007
391
1
Brucki, S. M. D., Malheiros, S. M. F., Okamoto, I. H., Bertolucci, P. H. F. (1997). Dados
392
normativos para o teste de fluência verbal categoria animais em nosso meio. Arquivos de 393
Neuropsiquiatria, 55 (1), 56-61.
394
Butts, C. T. (2009). Revisiting the Foundations of Network Analysis. Science, 325 (5939), 414-416.
395
doi:10.1126/science.1171022.
396
Craik, F. I. M. & Bialystok, E. (2006). Cognition through the lifespan: mechanisms of change.
397
Trends in Cognitive Sciences, 10(3), 131-138. doi:10.1016/j.tics.2006.01.007
398
De Deyne, S., and Storms, G. (2008). Word Associations: networ and semantic properties.
399
Behavior Research Methods, 40(1), 213-231. doi: 10.3758/BRM. 40.1213
400
de Paula, J. J., Bertola, L., Ávila, R. T., Moreira, L., Coutinho, G., Moraes, E. N., ... Malloy-Diniz,
401
L. F. (2013). Clinical Applicability and Cutoff Values for an Unstructured
402
Neuropsychological Assessment Protocol for Older Adults With Low Formal Education.
403
Plos One, 8, E73167. doi: 10.1371/journal.pone.007316
404
Diniz, B. S. O., Yassuda, M. S., Nunes, P. V., Radanovic, M. & Forlenza, O. V. (2007).
Mini-405
mental State Examination performance in mild cognitive impairment subtypes. International 406
Psychogeriatrics, 19(4), 647-656. doi: 10.1590/S1516-44462008000400003
407
Garrard, P., Lambon Ralph, M. A., Patterson, K., Pratt, K. H. & Hodges, J. R. (2005). Semantic
408
feature knowledge and picture naming in dementia of Alzheimer´s type: a new approach.
409
Brain and Language, 93, 79-94. doi:10.1016/j.bandl.2004.08.003
410
Griffiths, T. L., Steyvers, M., Tenenbaum, J. B. (2007). Topics in semantic representation.
411
Psychological Review, 114(2), 211–244. doi:10.1037/0033-295X.114.2.211
412
Goni, J., Arrondo, G., Sepulcre, J., Martincorena, I., Mendizabal, N.V., Corominas-Murtra, B.,
413
Bejarano, B., Ardanza-Trevijano, S., Peraita, H. Wall, D. P., Villoslada, P. (2010). The
414
semantic organization of the animal category: evidence from semantic verbal fluency and
415
network theory. Cognitive Processing. doi:10.1007/s10339-010-0372-x
416
Henry, J. D., Crawford, J. R. & Phillips, L. H. (2004). Verbal fluency performance in dementia of
417
the Alzheimer´s type: a meta-analysis. Neuropsychologia, 42, 1212-1222. doi:
418
10.1016/j.neuropsychologia.2004.02.001
419
Hodges, J. R., Erzinçlioglu, S., Patterson, K. (2006). Evolution of Cognitive Defi cits and
420
Conversion to Dementia in Patients with Mild Cognitive Impairment: A Very-Long-Term
421
Follow-Up Study. Dementia and Geriatric Cognitive Disorders, 21, 380–391. doi:
422
10.1159/000092534
423
Holler, Y., & Trinka, E. (2014). What do temporal lobe epilepsy and progressive mild cognitive
424
impairment have in common? Frontiers in System Neuroscience, 8.
425
doi:10.3389/fnsys.2014.00058
426
Huntley, J. D. & Howard, R. J. (2010). Working memory in early Alzheimer´s disease: a
427
neuropsychological review. International Journal of Geriatric Psychiatry, 25, 121-132. doi:
428
10.1002/gps.2314 429
Kotsiantis, S. B. (2007) Supervised machine learning: a review of classification techniques. In:
430
Emerging artificial intelligence applications in computer engineering: real word AI systems
431
with applications IOS Press. pp 3–24.
432
Lezak, M., Howieson, D. B., Loring, D. W. (2004). Neuropsychological Assessment. Oxford
433
University Press, New York, 4th ed.
434
Lerner, A. J., Ogrocki, P. K., Thomas, P. T. (2009). Network Graph Analysis of Category Fluency
435
Testing. Cognitive Behavioral Neurology, 22, 45–52. doi:10.1097/wnn.0b013e318192ccaf
436
McClelland, J. L., and Rogers, T. T. (2003). The parallel distributed processing approach to
437
semantic cognition. Nature Review Neuroscience, 4, 310-323. doi: 10.1038/nrn1076.
438
McKhann G, Drachman D, Folstein M, Katzman R, Price D, Stadlan E. M. (1984). Clinical
analysis
diagnosis of Alzheimer’s disease: report of the NINCDS-ADRDA Work Group under the
440
auspices of Department of Health and Human Services Task Force on Alzheimer’s.
441
Neurology, 34, 939-944. doi: 10.1212/WNL.34.7.939
442
Mota, N. B., Vasconcelos, N. A. P, Lemos, N. Pieretti, A. C., Kinouchi, O., Cecchi, G. A., ...,
443
Ribeiro, S. (2012). Speech graphs provide a quantitative measure of thought disorder in
444
psychosis. Plos One, 7(4), 1-9. doi:10.1371/journal.pone.0034928
445
Mota, M. B., Furtado, R., Maia, P. P. C., Copelli, M., Ribeiro, S. (2014). Graph analysis of dream
446
reports is especially informative about psychosis. Scientific Reports, 4 : 3691. doi:
447
10.1038/srep03691
448
Nickles, L. (2001). Spoken Word Production. In: Rapp, B. (Ed.) What Deficits Reveal about the
449
Human Mind/Brain: A Handbook of Cognitive Neuropsychology. Philadelphia: Psychology
450
Press.
451
Nutter-Upham, K. E., Saykin, A. J., Rabin, L. A., Roth, R. M., Wishart, H. A., Pare, N. &
452
Flashman, L. A. (2008). Verbal fluency performance in amnestic MCI and older adults with
453
cognitive complaints. Achieves in Clinical Neuropsychology, 23(3), 229-41. doi:
454
10.10170S1355617706060590
455
Patterson, K., Nestor, P. J. & Rogers, T. T. (2007). Where do you know what you know? The
456
representation of semantic knowledge in the human brain. Nature Reviews Neuroscience, 8,
457
976-988. doi:10.1038/nrn2277
458
Radanovic, M., Diniz, B. S, Mirandez, R. M., Novaretti, T. M. S., Flacks, M. K., Yassuda, M. S. &
459
Forlenza, O. V. (2009). Verbal fluency in the detection of mild cognitive impairment and
460
Alzheimer’s disease among Brazilian portuguese speakers: the influence of education.
461
International Psychogeriatrics, 1-7. doi: 10.1017/S1041610209990639
462
Salmon, D.P., Thomas, R.G., Pay, M.M., Booth, A., Hofstetter, C.R., Thal, L.J. and Katzman, R.
463
(2002). Alzheimer’s disease can be accurately diagnosed in very mildly impaired
464
individuals. Neurology, 59, 1022–1028. doi:10.1212/wnl.59.7.1022
465
Saxton, J., Lopez, O. L., Ratcliff, G., Dulberg, C., Fried, L. P., Carlson, M. C., … Kuller, L. (2004).
466
Preclinical Alzheimer disease: Neuropsychological test performance 1.5 to 8 years prior to
467
onset. Neurology, 63, 2341-2347. doi: 10.1017/S1041610208007631
468
Singh, M. & Provan, G. M. (1995) A comparison of induction algorithms for selective and
non-469
selective Bayesian classifiers. In: Proc. 12th International Conference on Machine Learning.
470
pp 497–505.
471
Strauss, E., Sherman, E. M. S. & Spreen, O. (2006). A Compendium of Neuropsychological Tests:
472
Administration, Norms, and Commentary. United Kigdom: Oxford University Press.
473
Taler, V. & Phillips, N. A. (2008). Language performance in Alzheimer´s disease and mild
474
cognitive impairment: a comparative review. Journal of Clinical and Experimental 475
Neuropsychology, 30(5), 501-556. doi: 10.1080/13803390701550128
476
Unsworth, N., Spillers, G. J., Brewer, G. A. (2011). Variation in verbal fluency: A latent variable
477
analysis of clustering, switching, and overall performance. The Quarterly Journal of 478
Experimental Psychology, 64(3), 447-466. doi: 10.1080/17470218.2010.505292
479
Winblad, B., Palmer, K., Kivipelto, M., Jelic, V., Fratiglioni, L., Wahlund, L. O., … Petersen, R. C.
480
(2004). Mild Cognitive Impairment – beyond controversies, towards a consensus: reports of
481
the international working group on Mild Cognitive Impairment. Journal of International 482
Medicine, 256, 240-246. doi: 10.1111/j.1365-2796.2004.01380.x
7. Figure legends 487
Figure 1: A. Representation of the word sequence produced on the Semantic Verbal Fluency task. 488
B.Representations of networks generated by NC, MCI and AD subjects during the Semantic Verbal 489
Fluency task. 490
491
Figure 2:Speech Graph Attributes (SGA) differentiates psychopathological groups. 492
A. SGA boxplots with significant differences among Alzheimer Disorder (AD), Moderate
493
Cognitive Impairment (MCI) and control groups (N=25 on AD and C group, N=50 on MCI group;
494
Kruskal-Wallis test followed by two-sided Wilcoxon Rank-sum test with Bonferroni correction
495
with alpha=0.0167). B. Percentage of subjects in each group that made one L3 on the verbal fluency
496
test . AD subjects showed more L3 than MCI subjects (Wilcoxon Rank-sum test with Bonferroni
497
correction with alpha=0.0167, p=0.0090) C. Rating quality measured by AUC, sensitivity and
498
specificity, using MMSE or SGA correlated with clinical symptoms measured with MMSE and
499
Lawton scales (Table 3) (attributes: WC, N, E, Density, Diameter and ASP). Notice that SGA was
500
more specific than MMSE on triple group sorting, and on MCI diagnosis against the control group.
501 502
Figure 3:Speech Graph Attributes (SGA) differentiates psychopathological MCI subgroups. 503
A. SGA boxplots with significant differences among Alzheimer Disorder (AD), Amnesic Moderate
504
Cognitive Impairment (aMCI), Multiple Domain Moderate Cognitive Impairment (a+mdMCI), and
505
control groups indicated (N=25 per group; Kruskal-Wallis test followed by two-sided Wilcoxon
506
Rank-sum test with Bonferroni correction with alpha=0.0083). B. Rating quality measured by AUC,
507
sensitivity and specificity, using SGA correlated with clinical symptoms measured with MMSE and
508
Lawton scales (Table 4) (attributes: WC, N, E, Density, Diameter and ASP). Notice that it is
509
possible to sort the MCI subgroups from the NC or AD groups, but not one from another.
510
Classification quality was considered excellent when AUC was higher than 0.8, good when AUC
511
ranged from 0.6 to 0.8, and poor (not above the chance), when AUC was smaller than 0.6.
512 513
8. Supplementary Material
514
Supplementary Table: Speech Graph Attributes
515
N: Number of nodes.
E: Number of edges.
RE (Repeated Edges): sum of all edges linking the same pair of nodes.
PE (Parallel Edges): sum of all parallel edges linking the same pair of nodes given that the source node of an edge could be the target node of the parallel edge.
L1 (Loop of one node): sum of all edges linking a node with itself, calculated as the
trace of the adjacency matrix.
L2 (Loop of two nodes): sum of all loops containing two nodes, calculated by the
analysis
L3 (Loop of three nodes): sum of all loops containing three nodes (triangles),
calculated by the trace of the cubed adjacency matrix divided by three.
LSC (Largest Strongly Connected Component): number of nodes in the maximal
subgraph in which all pairs of nodes are reachable from one another in the directed
subgraph (node a reaches node b, and b reaches a).
ATD (Average Total Degree): given a node n, the Total Degree is the sum of “in and
out” edges. Average Total Degree is the sum of Total Degree of all nodes divided by
the number of nodes.
Diameter: length of the longest shortest path between the node pairs of a network.
Average Shortest Path (ASP): average length of the shortest path between pairs of
nodes of a network.
Average Clustering Coefficient (CC): Given a node n, the Clustering Coefficient Map (CCMap) is the set of fractions of all n neighbours that are also neighbours of
each other. Average CC is the sum of the Clustering Coefficients of all nodes in the
CCMap divided by number of elements in the CCMap.
Density: number of edges divided by possible edges. (D = E/N2), where E is the number of edges and N is the number of nodes.
516
Supplementary Figure: Graph example to illustrate Speech Graph Attributes (SGA). On this
517
graph we have 15 Nodes (words), 21 Edges (temporal links representing word sequence), 3 PE
518
(parallel edge), 2 RE (repeated edge), 1 loops of one (L1), two (L2) and three (L3) nodes and the
519
largest strongly connected component (LSC) is 9 (there is 9 nodes on the LSC).