Analysis of the kinetics of phase and amplitude gratings
recorded in azopolymer films
A. A. Freschi, A. D. S. Cortes, D. A. Donatti, and J. Frejlich*
Departamento de Física, Instituto de Geociências e Ciências Exatas, Universidade Estadual Paulista (UNESP), Caixa Postal 178, 13500-970, Rio Claro, SP, Brazil
*Laboratório de Óptica, Instituto de Física Gleb Wataghin, Universidade Estadual de Campinas (UNICAMP), Caixa Postal 6165, 13083-970, Campinas, SP, Brazil
Abstract. In this work we use a stabilized holographic technique to study both refractive index and absorption gratings recorded in thin films made of Disperse Red 1 (DR1) embedded in an organic polymer matrix (PMMA) deposited on glass substrate. Gratings are recorded by linearly polarized illumination with the interference pattern of two crossing beams. One of the beams is phase modulated and the interference signals between the transmitted and diffracted waves are detected by a tuned lock-in amplifier. The technique allows measuring separately changes of the refractive index and the absorption coefficient during the course of the photoreaction process. The time evolution of the diffraction efficiencies during recording has shown bi-exponential kinetics for both gratings.
INTRODUCTION
The photoisomerization process in azobenzene materials is subject of great interest because of their potential use in different optical applications including signal processing, optical storage, polarization holography, and various types of photonic devices [1]. Photoinduced dichroism and/or birrefringence were already observed in several systems containing azobenzenes [2-4]. The trans-cis isomerization process is reversible, allowing optical information to be recorded, erased and rewritten in real-time.
Azobenzene derivatives have two geometric isomers, the trans and the cis forms. When these materials are irradiated with linearly polarized light, the azo-dye molecules experience successive cycles of trans-cis
isomerization and eventually align perpendicular to the irradiating light polarization [1]. Indeed, the light polarization sensitivity of this photoisomerization reaction originates from the anisotropic shape of the azobenzene molecules. The probability of an azo unit for absorbing a photon is proportional to the cosine square of the angle between the transition dipole moment and the polarization direction of the exciting light. The molecules aligned parallel to the light polarization direction have the highest probability of being excited and isomerized. As a result, when starting from isotropically distributed trans isomers, linearly polarized light burns a hole in this angular distribution (angular hole burning). Also, as the main axis of the azo unit is reoriented due to the isomerization, the main axis of the photoinduced cis state will be tilted with respect to the light polarization direction (angular redistribution). Both process lead to an anisotropic distribution of the azo molecules. Therefore, anisotropies are created in the trans and cis concentrations. As the azobenzene
trans isomer is generally more stable than the cis isomer, molecules in the cis form may relax back to the
trans form by spontaneous thermal back reaction (or by a reverse photoisomerization cycle).
EXPERIMENTAL METHOD
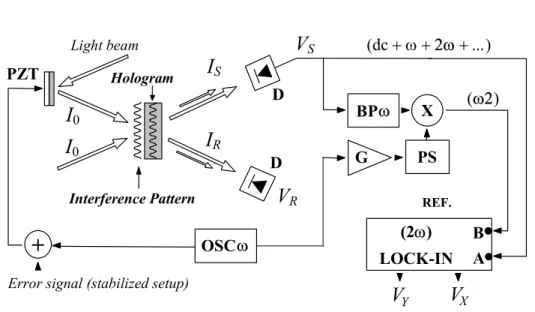
The general scheme of the holographic setup is illustrated in Fig. 1. Experiments are carried out at the room temperature T = 300 K. Gratings recorded in a thin film made of Disperse Red 1 (DR1) embedded in an organic polymer matrix (PMMA) deposited on glass substrate. The light source is a solid state laser operated at the wavelength λ = 532 nm. The coherent and collimated incident waves have equal intensities (I0), are
linearly polarized (TE), and intersect symmetrically in the sample with an incident angle θ≈ 15°. The light intensity distribution in the sample has the form of a sinusoidal fringe pattern, which modulates both, the refractive index and the absorption coefficient. The related phase and amplitude gratings have the same origin (the photoisomerization reaction) and are recorded as a consequence of two different anisotropies (in the trans
and cis concentrations). Because the photoisomerization reaction is a local process, we can assume that both gratings are in phase (or counterphase) with respect to the interference pattern. Therefore, the expressions for the output voltages VR and VS (that are proportional to the output light intensities) are [5],
) sin 2 cos 2 1 (
0
η
Aϕ
η
Pϕ
R V
V = + − (1)
) sin 2 cos 2 1 (
0
η
Aϕ
η
Pϕ
S V
V = + + (2)
where V0 = κI0 is a constant, with κ the irradiance-to-voltage conversion factor of the photodetectors, ηA and
ηPare the diffraction efficiencies of the amplitude and phase gratings, respectively (we assume ηA << 1 and
ηP<< 1) and ϕ represents a phase shift perturbation. The bulk absorption effect as well as reflection losses
are not considered. One of the input waves is phase modulated with a small amplitude (ψ = 0.4 rad) and fast (ω = 2π× 1600 rad/s) sinusoidal signal. Due to this fast modulation, phase ϕ = ψsin(ωt), and the Fourier spectrum of the voltage VS (and VR) presents several harmonic terms of the fundamental frequency ω, where
the first and the second ones are,
t J
V
VS(ω) =4 0 1(
ψ
)η
Psinω
(3)t J
V
VS(2ω) =4 0 2(
ψ
)η
Acos2ω
. (4)BP ω X (ω2)
OSC ω D
V
SPZT
(2ω)
LOCK-IN
V
YV
X Interference Pattern Hologram Light beam PS G+
REF. (dc+ ω + 2ω + ...)B
A D
Error signal (stabilized setup)
I
SI
RV
RI0
I0
In Fig. 1, voltage VS is split in two branches: One of them is sent directly to the “A” input of a 2ω-tuned
lock-in amplifier; In the other branch, the ω-component, VS (ω)
, is filtered out and frequency doubled by mixing it with a sinusoidal wave from the same oscillator that drives the PZT. The mixed signal (called ω2 -component) is sent to the “B” input of the (two-phase) lock-in amplifier, which is operated in the “A−B” input mode. The amplitude and phase of the ω2-componentcan be adjusted [6] so that the X and Y outputs of the lock-in amplifier can be written as,
P
X V J
V =2 2 0 2(
ψ
)η
(5)A
Y VJ
V =2 2 0 2(
ψ
)η
. (6)Substituting J2(0.4) = 0.0196 and measuring voltages V0, VX, and VY, the diffraction efficiencies can be
computed as,
0
18VY V
A =
η
, andη
P =18VX V0 (7)RESULTS AND CONCLUSIONS
0 2x10⁻⁵ 4x10⁻⁵ 6x10⁻⁵
0 500 1000 1500 2000 Amplitude grating
Phase grating
(A) η
A=a(1-exp(-t/c))
a=4.99E-5, c=140 s
Time (s)
Diff
ract
io
n efficiency,
η
0 2x10⁻⁵ 4x10⁻⁵ 6x10⁻⁵
0 500 1000 1500 2000 Amplitude grating
(B) ηA2 = 2.71e-5 (1-exp(-t /318) η
A1 = 2.49e-5 (1-exp(-t /20.1)
ηA = a(1-exp(-t /c)) + b(1-exp(-t /d)), a=2.49E-5, b=2.71E-5, c=20.1 s, d=318 s
Time (s)
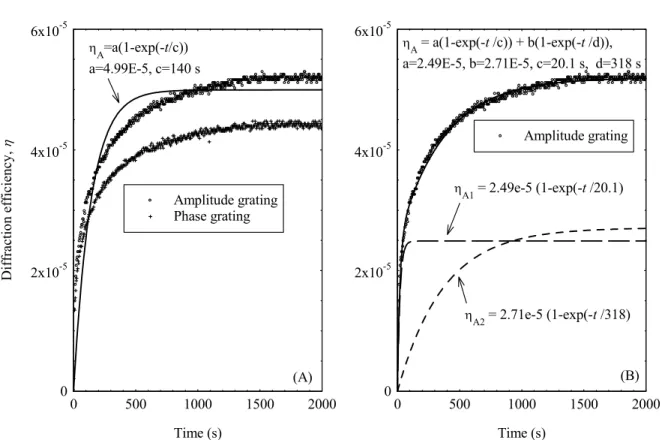
FIGURE 2: Experimental results (dots), showing the time evolution of the amplitude and phase gratings. Fig. 2A) The solid line is mono-exponential curve fitting for the amplitude grating; Fig 2B) The dots represent the amplitude grating and the (superposed) solid line is a bi-exponential curve fitting, with parameters c and d the time constants. The dashed lines show the contributions of the fast (c) and slow (d) components of the grating separately.
changes sign, as expected. This confirms that the gratings are not mixed in the results. The sample is assumed to be isotropic initially, with most of the azo molecules in the more stable trans form. The irradiation was started at t = 0. In the illuminated regions (bright fringes) the trans populations decreases whereas the cis
populations increases due to the photoisomerization reaction; these populations remain unaltered in the dark regions. As a result, a spatial modulation of the absorption coefficient (amplitude grating) and of the refractive index (phase grating) takes place. The time evolution of both gratings depends on the anisotropies created in the trans and cis forms. One can see clearly from Fig. 2 that the gratings don’t evolve as a mono-exponential function, thanks to the different time constants of the angular hole burning and angular redistribution processes, which lead to a bi-exponential evolution of the diffraction efficiencies (Fig. 2B).
0 100 200 300 400 500 600
0 5 10 15
Amplitude grating Phase grating
d = β/2I0 , β=521 s/(mW/cm2) (B)
Average light intensity, 2I0 (mW/cm2)
Time co nstant, d (s ) 0 10 20 30 40 50
0 5 10 15
Amplitude grating Phase grating
c = α/2I0 , α=44 s/(mW/cm2) (A)
Average light intensity, 2I0 (mW/cm2)
T ime co ns ta nt , c (s)
FIGURE 3: Time constants of the fast (c) and slow (d) photoinduced anisotropies versus light intensity. The dashed lines are curve fittings showing that both, c and d, are inversely proportional to the average light intensity of the fringe pattern.
Fig. 3 is a plot of the measured time constants for both (amplitude and phase) gratings at different light intensities. It is not surprising the fact that both gratings have similar behaviors because both are originated from the same photoisomerization reaction. It can be seen that the time constants (c and d) are inversely proportional to the light intensity (at least in the investigated region), with c being smaller by approximately one order of magnitude.
The authors acknowledge financial support of the Fundação de Amparo à Pesquisa do Estado de São Paulo (FAPESP), Brazil, and Conselho Nacional de Desenvolvimento Científico e Tecnológico (CNPq), Brazil.
REFERENCES
1. Z. Sekkat, J. Wood, and W. Knoll, J. Phys. Chem.99, 17226-17234 (1995).
2. H. Taunaumang, M. Solyga, M. O. Tija, A. Miniewicz, Thin Solid Films461, 316-324 (2004). 3. P.-A. Blanche, Ph. C. Lemaire, C. Maertens, P. Dubois, R. Jérome, Opt. Commun.185, 1-12 (2000). 4. W. Zhang, S. Bian, S. I. Kim, M. G. Kuzyk, Opt. Lett. 27 (13), 1105-1107 (2002).
5. J. Frejlich, A. A. Kamshilin, and P. M. Garcia, Opt. Lett.17 (4), 249-251 (1992).