* Corresponding author. Tel: +989122942412
E-mail addresses: [email protected] (M. Gooyandeh Hagh) © 2013 Growing Science Ltd. All rights reserved.
doi: 10.5267/j.msl.2013.11.034
Management Science Letters 4 (2014) 57–62
Contents lists available at GrowingScience
Management Science Letters
homepage: www.GrowingScience.com/msl
An investigation on important factors influencing consumer purchase: A case study of food products
Mohammad Haghighia and Maria Gooyandeh Haghb*
aDepartment of Management, University of Tehran, Tehran, Iran bDepartment of Management, Payame Noor University, Tehran, Iran
C H R O N I C L E A B S T R A C T
Article history: Received Feb 28, 2013 Received in revised format 19 September 2013 Accepted 23 October 2013 Available online November 28 2013
This paper presents an empirical investigation to study the effect of five factors on purchasing food product including brand and reputation, being green product producer, quality of packaging, taste of food products and materials used in products. The study designs a questionnaire consists of 20 questions, distributes 440 questionnaires among some consumers who were regular customers of food chains in west part of city of Tehran, Iran and managed to collect 225 properly filled ones. The study uses binomial test to verify five hypothesis of the survey and it has confirmed the effects of four variables including brand and reputation, quality of packaging, taste of food products and materials used in products. In our survey, there are some positive and meaningful correlations among different pairs of five variables of the survey where the highest correlation is between materials used in products and quality of packaging (r=0.606, Sig. = 0.000) and between Quality of packaging and being green product producer (r=0.545, Sig. =0.000).
© 2014 Growing Science Ltd. All rights reserved. Keywords:
Food product Consumer behavior Taste
Quality of packaging
1. Introduction
Building a brand plays essential role on the success of products and services and it is always important to find important factors influencing on consumer behavior on purchasing a particular
product (Aaker, 1996, 2001, 2011; Bailey & Ball 2006; Bandyopadhyay & Martell, 2007; Beverland
& Farrelly, 2010; Eertmans et al., 2006). During the past few years, there have been various studies on detecting important factors influencing consumer behavior. Arora and Stoner (2009), for instance, used a mixed method to explore product personality as well as detecting personality dimensions of two retails stores, Target and Wal-Mart, and two athletic brands, Adidas and Nike and their findings
disclosed lack of convergence in personality dimensions. Brand personality plays essential role on a
58
identity, personality being only one of them, which require to be kept separate both on theoretical grounds and for practical implementation.
Back (2005) explored the impacts of image congruence on customers’ post-purchasing behaviors, concentrating specifically on customer satisfaction and brand loyalty in the lodging industry. They reported that social and ideal social image congruence had substantial direct impacts on customer satisfaction and indirect impacts on attitudinal brand loyalty. Back and Parks (2003) presented a brand loyalty model involving cognitive, affective, and conative brand loyalty and customer satisfaction.They recommended that customer satisfaction had a significant indirect impact on behavioral brand loyalty when mediated by attitudinal brand loyalty, including cognitive-affective-conative brand loyalty stages. Juan Beristain and Zorrilla (2011) investigated the relationship between store image and store brand equity. The results stated retailers to impact all components of store brand equity, essentially through its commercial and strategic dimension could use that store image. Buil et al. (2011) explored the relationships between two central elements of marketing communication programs including advertising and sales promotions and their effect on brand equity creation. More specifically, the study concentrated on advertising spend and individuals' behaviors toward the advertisements. They also studied the impacts of two types of sales promotions, monetary and non-monetary promotions. They reported distinctive impacts of monetary and non-monetary promotions on brand equity and demonstrated that companies could optimize the brand equity management process by considering the relationships existing between the various dimensions of
brand equity. Dekhili and d’Hauteville (2009) investigated the effect of the region of origin on the
perceived quality of olive oil by presenting an experimental approach using a control group. 2. The proposed study
In this paper, we present important factors influencing consumer intention on purchasing food products in city of Tehran, Iran. The proposed study of this paper considers the following five
hypotheses (Prescott et al., 2002; Piggford et al., 2008; Fotopoulos et al., 2009),
1. Brand name influences consumer intention to purchase a food product.
2. Strong commitment on green market planning influences consumer intention to purchase a
food product.
3. Packaging plays important factor on purchasing food product.
4. The taste of food products influences consumer intention to purchase a food product.
5. Using good materials in food products influences consumer intention to purchase a food
product.
The proposed study designed a questionnaire similar to Fotopoulos et al. (2009) in Likert scale and first requested some experts to verify the questionnaire content. The questionnaire consists of 20 questions where 4 questions are assigned for each question. The sample size is selected as follows,
2 2
2 / pe q
Z
N , (1)
where N is the sample size, p1qrepresents the probability, z/2is CDF of normal distribution and
finally is the error term. For our study we assumep0.5,z/2 1.96and e=0.01, the number of
sample size is calculated as N=220. In this survey, we have distributed 440 questionnaires and
Cronbach alphas have been calculated for Reputation and brand, Being green product producer, Quality of packaging, Taste of food products and Materials as 0.718, 0.853, 0.762, 0.744 and 0.782, respectively. These components are well above the minimum acceptable limit of 0.70, which validates the overall questionnaire.
2.1. Personal characteristics of the participants
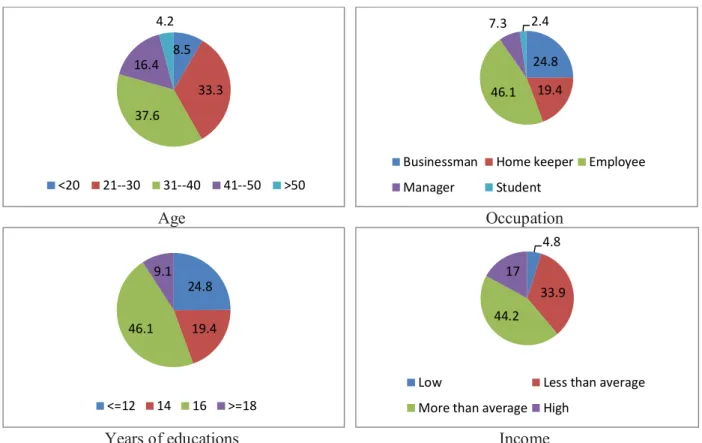
In our survey, 52% of the participants were female while 48% of them were male. Fig. 1 shows details of other personal characteristics of the participants. As we can observe from Fig. 1, most participants in our survey were middle age; they were employees of the government, had some university background and finally maintained an average income. Table 1 demonstrates the summary of some statistics about the people who took part in our survey.
Age Occupation
Years of educations Income
Fig. 1. Personal characteristics of the participants in terms of percentage
Table 1
The summary of some basic statistics
Mean Standard deviation Variance
Brand and reputation 3.652 0.781 0.61
Being green product producer 3.186 0.967 0.935
Quality of packaging 3.831 0.715 0.511
Taste of food products 4.177 0.641 0.41
Materials used in products 4.08 0.764 0.584
As we can observe from the results of Table 1, taste of the food products maintains the highest mean, followed by materials used in products, quality of packaging, brand and reputation and being green marketers. The proposed study uses binomial test to verify different hypotheses of the survey and next we present details of our findings.
8.5
33.3 37.6
16.4 4.2
<20 21--30 31--40 41--50 >50
24.8 19.4 46.1
7.3 2.4
Businessman Home keeper Employee
Manager Student
24.8
19.4 46.1
9.1
<=12 14 16 >=18
4.8
33.9 44.2
17
Low Less than average
60
3. The results
In this section, we present details of our finding on testing various hypotheses of the survey. Table 2 demonstrates details of our survey on performing binomial test.
As we can observe from the results of applying binomial test, four variables of brand name and reputation, quality of packaging, taste of food products and materials used in products are confirmed when the level of significance if five percent but being green marketing planning did not have any impact on consumer to purchase the products. We have also examined the relationship between different components of the survey and Table 3 demonstrates the results of Pearson correlation test.
Table 2
The summary of binomial test
Hypothesis Group Sample Percentage Prob. Sig Result
Brand reputation and name Not effectiveEffective 10 17154 0.760.24 0.5 0 Confirmed
Total 225 1
Being green product producer Not effectiveEffective 10 107118 0.480.52 0.5 0.9 Not confirmed
Total 225 1
Quality of Packaging effectiveEffectiveNot 10 19233 0.850.15 0.5 0 Confirmed
Total 225 1
Taste of produced foods effectiveEffectiveNot 10 21213 0.940.06 0.5 0 Confirmed
Total 225 1
Materials used in products effectiveEffectiveNot 10 19430 0.870.13 0.5 0 Confirmed
Total 224 1
According to the results of Table 3, there are some positive and meaningful correlations among different pairs of five variables of the survey. In fact, the highest correlation is between materials used in products and quality of packaging (r=0.606, Sig. = 0.000) and between Quality of packaging and being green product producer (r=0.545, Sig. =0.000).
Table 3
The summary of Pearson correlation test
materials used in products Taste of produced
foods Quality of
Packaging Being green product
producer Brand reputation
and name 1.000 Brand reputation and name
1.000 0.470
Being green product producer
1.000 0.545
0.489 Quality of Packaging
1.000 0.442
0.250 0.228
Taste of produced foods
1.000 0.487
0.606 0.462
0.342 Materials used in products
3.1. The first hypothesis: The effect of brand name
The first hypothesis of this survey is associated with the relationship between brand name and consumer interest towards the food product. According to our survey, 76% of the participants believed that brand name creates good motivation to purchase a product. Therefore, the first hypothesis of this survey has been confirmed.
3.2. The second hypothesis: The effect of green marketing planning
only 48% of the participants believed that green marketing planning creates good motivation to purchase a product. Therefore, the first hypothesis of this survey has not been confirmed.
3.3. The third hypothesis: The effect of packaging
The third hypothesis of this survey is associated with the relationship between packaging and consumer interest towards purchasing the food product. According to our survey, 85% of the participants believed that packaging creates good motivation to purchase a product. Therefore, the third hypothesis of this survey has been confirmed.
3.4. The fourth hypothesis: The effect of taste
The fourth hypothesis of this survey is associated with the relationship between food taste and consumer interest towards purchasing product. According to our survey, 94% of the participants believed that food taste creates good motivation to purchase a product. Therefore, the fourth hypothesis of this survey has been confirmed.
3.5. The fifth hypothesis: The effect of material used
The fifth hypothesis of this survey is associated with the relationship between material used in product and consumer interest towards purchasing the product. According to our survey, 87% of the participants believed that material used creates good motivation to purchase a product. Therefore, the fifth hypothesis of this survey has been confirmed.
4. Conclusion
In this paper, we have presented an empirical investigation to study the effect of five factors on purchasing food product including brand and reputation, being green product producer, quality of packaging, taste of food products and materials used in products. The study designed a questionnaire, distributed it among some experts and, through some statistical test, the survey has confirmed the effects of four variables including brand and reputation, quality of packaging, taste of food products and materials used in products.
Acknowledgement
The authors would like to thank the anonymous referees for constructive comments on earlier version of this paper.
References
Aaker, D. A. (1996). Measuring brand equity across products and markets. California management
review, 38(3), 102-120.
Aaker, D. A. (2011). Building strong brands. SimonandSchuster. com.
Aaker, D. A., & Joachimsthaler, E. (2009). Brand leadership: Building assets in an information
economy. SimonandSchuster. com.
Aaker, J. L., Benet-Martinez, V., & Garolera, J. (2001). Consumption symbols as carriers of culture: A study of Japanese and Spanish brand personality constucts. Journal of personality and social
psychology, 81(3), 492-508.
Akbar, M. M., & Parvez, N. (2009). Impact of service quality, trust, and customer satisfaction on customers loyalty. ABAC Journal, 29(1), 24-38.
62
Azoulay, A., & Kapferer, J. N. (2003). Do brand personality scales really measure brand personality?. The Journal of Brand Management, 11(2), 143-155.
Back, K. J., & Parks, S. C. (2003). A brand loyalty model involving cognitive, affective, and conative brand loyalty and customer satisfaction. Journal of Hospitality & Tourism Research, 27(4), 419-435.
Back, K. J. (2005). The effects of image congruence on customers’ brand loyalty in the upper middle-class hotel industry. Journal of Hospitality & Tourism Research, 29(4), 448-467.
Bailey, R., & Ball, S. (2006). An exploration of the meanings of hotel brand equity. The Service
Industries Journal, 26(1), 15-38.
Bandyopadhyay, S., & Martell, M. (2007). Does attitudinal loyalty influence behavioral loyalty? A theoretical and empirical study. Journal of Retailing and Consumer Services, 14(1), 35-44.
Beverland, M. B., & Farrelly, F. J. (2010). The quest for authenticity in consumption: Consumers’ purposive choice of authentic cues to shape experienced outcomes. Journal of Consumer
Research, 36(5), 838-856.
Buil, I., de Chernatony, L., & Martínez, E. (2011). Examining the role of advertising and sales promotions in brand equity creation. Journal of Business Research, 66(1), 115-122.
Dekhili, S., & d’Hauteville, F. (2009). Effect of the region of origin on the perceived quality of olive oil: An experimental approach using a control group. Food Quality and Preference, 20(7), 525-532.
Eertmans, A., Victoir, A., Notelaers, G., Vansant, G., & Van den Bergh, O. (2006). The food choice questionnaire: Factorial invariant over western urban populations?. Food quality and
preference, 17(5), 344-352.
Fotopoulos, C., Krystallis, A., Vassallo, M., & Pagiaslis, A. (2009). Food Choice Questionnaire (FCQ) revisited. Suggestions for the development of an enhanced general food motivation model. Appetite, 52(1), 199-208.
Juan Beristain, J., & Zorrilla, P. (2011). The relationship between store image and store brand equity: A conceptual framework and evidence from hypermarkets. Journal of Retailing and Consumer
Services, 18(6), 562-574.
Piggford, T., Raciti, M., Harker, D., & Harker, M. (2008). Young adults' food motives: an Australian social marketing perspective. Young Consumers: Insight and Ideas for Responsible
Marketers, 9(1), 17-28.
Prescott, J., Young, O., O'Neill, L., Yau, N. J. N., & Stevens, R. (2002). Motives for food choice: a comparison of consumers from Japan, Taiwan, Malaysia and New Zealand. Food quality and