RESEARCH PAPER
Colorimetric assessment of
BCR-ABL1 transcripts in clinical
samples via gold nanoprobes
Raquel Vinhas1&Cláudia Correia1&Patricia Ribeiro2&Alexandra Lourenço2&
Aida Botelho de Sousa2&Alexandra R. Fernandes1&Pedro V. Baptista1
Received: 29 March 2016 / Revised: 29 April 2016 / Accepted: 9 May 2016 # Springer-Verlag Berlin Heidelberg 2016
Abstract Gold nanoparticles functionalized with thiolated ol-igonucleotides (Au-nanoprobes) have been used in a range of applications for the detection of bioanalytes of interest, from ions to proteins and DNA targets. These detection strategies are based on the unique optical properties of gold nanoparti-cles, in particular, the intense color that is subject to modula-tion by modificamodula-tion of the medium dieletric. Au-nanoprobes have been applied for the detection and characterization of specific DNA sequences of interest, namely pathogens and disease biomarkers. Nevertheless, despite its relevance, only a few reports exist on the detection of RNA targets. Among these strategies, the colorimetric detection of DNA has been proven to work for several different targets in con-trolled samples but demonstration in real clinical bioanalysis has been elusive. Here, we used a colorimetric method based on Au-nanoprobes for the direct detection of the e14a2 BCR-ABL fusion transcript in myeloid leukemia patient samples without the need for retro-transcription. Au-nanoprobes di-rectly assessed total RNA from 38 clinical samples, and results were validated against reverse transcription-nested po-lymerase chain reaction (RT-nested PCR) and reverse transcription-quantitative polymerase chain reaction (RT-qPCR). The colorimetric Au-nanoprobe assay is a simple yet
reliable strategy to scrutinize myeloid leukemia patients at diagnosis and evaluate progression, with obvious advantages in terms of time and cost, particularly in low- to medium-income countries where molecular screening is not routinely feasible.
Keywords Chronic myeloid leukemia . Leukemia . RNA . Gold nanoparticles . Colorimetric detection
Introduction
Gold nanoparticles functionalized with thiolated oligonucleo-tides (Au-nanoprobes) due to their unique optical proprieties have been widely used for nucleic acid detection with high sensibility and sensitivity at much lower costs when compared with conventional molecular methods. Disperse Au-nanoprobe solutions show a characteristic surface plasmon resonance (SPR) band at around 525 nm (red color), which is red-shifted upon salt-induced aggregation (blue color); hy-bridization to a complementary nucleic acid target sequence prevents aggregation and the solution remains red [1]. This non-cross-linking colorimetric detection method has been ef-ficiently applied to the detection of pathogens and other DNA sequences of interest, where hybridization to a specific com-plementary target leads to Au-nanoprobe stabilization and re-sistance to salt-induced aggregation [2,3].
Chronic myeloid leukemia (CML) is a clonal bone marrow stem cell disease with an annual incidence of 1–2 new cases per 100,000 adults and accounting for approximately 15 % of leukemia cases. CML is one of the rarest forms of leukemia, which is expected to become the most prevalent hematologic malignancy in the world by 2020 [4–6]. Management of CML therapy with tyrosine kinase inhibitors (TKIs) has been suc-cessfully achieved [7–10]. The Philadelphia chromosome
Electronic supplementary material The online version of this article (doi:10.1007/s00216-016-9622-9) contains supplementary material, which is available to authorized users.
* Pedro V. Baptista [email protected]
1
UCIBIO, Departamento de Ciências da Vida, Faculdade de Ciências e Tecnologia, Universidade Nova de Lisboa, Campus da Caparica, 2829-516 Caparica, Portugal
2 Serviço de Hematologia, Hospital dos Capuchos (CHLC),
1169-050 Lisbon, Portugal DOI 10.1007/s00216-016-9622-9
(Ph), a reciprocal translocation of the long arms of chromosomes 9 and 22, t(9;22), is found in more than 90 % patients with CML, 15–25 % of patients with acute lymphoblastic leukemia (ALL), and 1 % of newly diagnosed adults with acute myeloid leukemia (AML) [11–13]. This translocation transposes the ABL1 onco-gene from chromosome 9q34 to the BCR onco-gene on chro-mosome 22q11 (Fig. 1) [14–16].
This reciprocal translocation during hematopoiesis com-bined with alternative splicing events may originate at least eight different reported BCR-ABL1 transcripts, all encoding proteins with high tyrosine kinase activity. The vast majority of patients with CML (∼95 %) express either e13a2 or e14a2 mRNAs that result from a rearrangement of the major breakpoint cluster regions (M-BCR) generating 210-kDa fusion proteins (Fig. 1c). Several studies suggest that not only qualitative differences in the type of BCR-ABL1 proteins expressed but also quantitative var-iations in their total level within the cells may have an important role in determining CML phenotype [17–20]. The fused BCR-ABL1 gene and its gene products pro-vide specific markers for diagnosis and disease monitor-ing. Currently, CML diagnosis is primarily based on clinical symptoms, complete blood count, and bone marrow biopsy. Cytogenetic analysis, such as karyotype and fluorescence in situ hybridization (FISH), may be carried out to check the presence of the Ph chromo-some, and molecular tests, e.g., reverse transcription-polymerase chain reaction (RT-PCR) and reverse
transcription-quantitative polymerase chain reaction (RT-qPCR), are used for assessing type and levels of fusion transcript on RNA from bone marrow or periph-eral blood specimen [21, 22]. Monitoring CML by RT-qPCR and RT-nested PCR depends on local facilities and on the degree of molecular standardization of the local laboratory [23–25].
Based on their size-dependent surface plasmon resonance (SPR) absorption and the high surface-to-volume ratio allowing for surface functionalization with a variety of mole-cules, gold nanoparticles (AuNPs) are frequently used as probes in biological detections [1,2]. Baptista and colleagues developed a proof-of-concept colorimetric Au-nanoprobe method for direct detection and quantification of a BCR-ABL1 e14a2 fusion suitable for identification of BCR-ABL targets in lab-controlled conditions [3]. Contrary to the existing molecular tools for the diagnostics of CML, the Au-nanoprobe methodology requires neither retrotranscription of the sample RNA into cDNA nor its amplification in a nested-PCR format with extreme complexity. Despite several reports on the use of BCR-ABL target as proof-of-concept for nanotechnology-based detection, the use of nanoparticles for CML diagnostics in clinical samples has never been per-formed before.
Here, we were able to directly screen RNA extracted from blood or bone marrow samples from patients admitted to the clinics for CML or AML via the Au-nanoprobe assay and validated results against the gold standard, RT-nested PCR and qPCR, without loss of information.
Fig. 1 Genetics of CML. a Chromosomes reciprocal translocation that originates the BCR-ABL1 oncogene during hematopoiesis. b Structure of BCR and ABL1 genes. c Structure of the two most common BCR-ABL1 fusion transcripts (e14a2 and e13a2) and a rare one (e1a2). e14a2 and
e13a2 isoforms encode 210 kDa fusion proteins, and the e1a2 isoform encodes a 190-kDa protein. d Au-nanoprobe designed to target e14a2 mRNA
Patients and methods
Patient samplesAll CML patients were confirmed to harbor the t(9;22) by FISH. Levels of BCR-ABL1 were assessed using RT-qPCR, according to the 2015 European LeukemiaNet (ELN) guidelines [26]. Treatment with TKIs was initiat-ed imminitiat-ediately and clinical, hematological, and molec-ular remission was evaluated. All 16 AML bone marrow samples were collected at diagnosis, presenting a normal karyotype and negative t(9;22) FISH analysis (Table 1). Bone marrow and peripheral blood patient samples were collected in RNAlater® (Thermo Fisher Scientific, Carlsbad, CA, USA) for maximum RNA stabilization and used directly for RNA extraction without any cul-ture expansion and/or any cell culcul-ture method.
Au-nanoprobe synthesis
The probe sequence and the complementary target de-rive from the BCR-ABL1 e14a2 (also known as b3a2) chimeric protein mRNA. This target was selected be-cause it represents the most frequent breakpoint in CML, accounting for 55 % of cases [27, 28]. Probe selectivity was assessed against two other BCR-ABL1 breakpoint regions: e13a2 and e1a2. Control oligonucle-otide target sequences included BCR, ABL1, and an un-related target—see Electronic Supplementary Material Table S1.
Au-nanoprobe design and synthesis were performed as pre-viously described [3]. In brief, 14-nm gold nanoparticles were prepared by the citrate reduction method and functionalized with the respective thiolated oligonucleotide in an aqueous solution of AuNPs at a 1:150 (AuNP:oligonucleotide) ratio for 16 h. After centrifugation (20 min at 14,500g), the oily precipitate was washed with 10 mM phosphate buffer (pH 8.0), 0.1 M NaCl, centrifuged, and resuspended in the same buffer. The resulting Au-nanoprobes were stored in the dark at 4 °C.
Characterization of AuNPs and Au-nanoprobes was performed by transmission electron microscopy and dy-namic light scattering (see Electronic Supplementary Material Table S2).
Cell culture
Immortalized cell lines derived from CML patients in blast crisis, K562 (BCR-ABL1 e14a2 fusion transcript positive cell line) and BV173 (BCR-ABL1 e13a2 fusion transcript positive cell line; e14a2 negative) [28] were cultured, respectively, in DMEM and RPMI with 10 % F B S , a t 3 7 ° C w i t h 5 % C O2. H u m a n a c u t e
promyelocytic leukemia cell line (HL60), negative for BCR-ABL1, was cultured in RPMI with 10 % FBS, at 37 °C with 5 % CO2. These cell lines were used as
positive and negative controls for the presence and ab-sence of BCR-ABL1 transcript, respectively.
Total RNA isolation
Total RNA was extracted from (1) K562, BV173, and HL60 cell pellets and from (2) bone marrow and peripheral blood patient samples previously stored in RNAlater® (Thermo Fisher Scientific, Carlsbad, CA, USA). Patients’ bone marrow or white blood cells were used directly for RNA extraction and not expanded by any cell culture method. RNA extraction was performed by the guanidine thiocyanate procedure (SV Total RNA Isolation System, Promega, Madison, WI, USA). Cell pellets were lysed in a solution containing 4 M guanidine thiocyanate, 0.1 M Tris-HCl pH 7.5, and 1 % β-mercaptoethanol and were subsequently centrifuged at 13, 000×g for 10 min to clear the lysate of precipitated proteins and cellular debris. Nucleic acids were selectively precipitated with ethanol; bound to the silica surface of glass fibers; and washed with 60 mM potassium acetate, 10 mM Tris-HCl pH 7.5, and 60 % (v/v) ethanol. On-column DNase I treatment lasted for 15 min at room temperature to remove genomic DNA. After several washing steps, RNA was resuspended in DEPC-treated water and stored at −80 °C until use. RNA concentration and purity were determined by UV spectrophotometry.
RT and PCR amplification
Total RNA extracted from samples was reverse tran-scribed using the NZY M-MuLV First-Strand cDNA Synthesis kit (Nzytech, Lisbon, Portugal) followed by nested-PCR amplification (see primer sequences under Electronic Supplementary Material Table S1). Outer PCR was performed under the following conditions: ini-tial denaturation at 95 °C for 5 min; 30 cycles of 94 °C for 30 s, 55 °C for 30 s, 72 °C for 1 min; and a final extension step at 72 °C for 10 min. Inner PCR included the following conditions: initial denaturation at 95 °C for 5 min; 30 cycles of 94 °C for 15 s, 55 °C for 30 s, 72 °C for 1 min; and a final extension step at 72 °C for 10 min.
Colorimetric detection with Au-nanoprobes
The Au-nanoprobe assay was performed in a total volume of 30μL containing the Au-nanoprobe at a final concentration of 2.5 nM and the appropriate targets at a final concentration of 0.33μM in 10 mM phosphate buffer (pH 8.0). A blank reac-tion was made in exactly the same condireac-tions but replacing
target or total RNA by an equivalent volume of 10 mM phos-phate buffer (pH 8.0). Following 5 min of denaturation at 95 °C, the mixtures were cooled down to 25 °C and 80 mM MgCl2added for color revelation. Absorption spectra were
run in a Tecan Infinite® M200 microplate reader
(Männedorf, Switzerland). Aggregation profiles were i n t e r p r e t e d b a s e d o n t h e a r e a s u n d e r t h e c u r v e (rAbs = AUC500–530 nm/AUC570–600 nm) using the trapezoidal
rule. Au-nanoprobe aggregation is portrayed by the natural logarithm of rAbs: a value of 0 for the ln (rAbs) is considered
Table 1 Performance of
Au-nanoprobe diagnostic test Sample Tissue FISH or RT-qPCRa (IS)
RT-nested PCR e14a2
Au-nanoprobe assay
AML at diagnostics 1 BM n/a No amp −
2 BM n/a No amp − 3 BM n/a No amp − 4 BM n/a No amp − 5 BM n/a No amp − 6 BM n/a No amp − 7 BM n/a No amp − 8 BM n/a No amp − 9 BM n/a No amp − 10 BM n/a No amp − 11 BM n/a No amp − 12 BM n/a No amp − 13 BM n/a No amp − 14 BM n/a No amp − 15 BM n/a No amp − 16 BM n/a e14a2 +
CML at diagnostics 17 BM n/a e14a2 +
18 BM n/a e13a2 − 19 BM n/a e14a2 + 20 BM n/a e14a2 + 21 BM n/a e13a2 − 22 BM n/a e14a2 + 23 BM 98 % e13a2 − 24 BM 87 % e14a2 + 25 BM 98 % e14a2 + 26 BM 97 % e14a2 + 27 BM 95 % e13a2 − 28 BM 99 % e13a2 − 29 BM 77 % e14a2 + 30 BM 95 % e14a2 + 31 BM 98 % e14a2 + 32 PB 90 % e13a2 − CML at follow-up 33 PB 0.017 % No amp − 34 PB 0.34 % e14a2 + 35 PB 0.00031 % No amp − 36 PB 0.11 % e13a2 − 37 PB 1 % No amp − 38 PB 3.4 % e13a2 −
IS international scale, n/a not available, No amp no amplification, BM bone marrow, PB peripheral blood
as the threshold for distinction between non-aggregated [ln (rAbs)≥ 0] and aggregated [ln (rAbs) < 0] Au-nanoprobe, cor-responding to a positive and a negative sample, respectively. The accuracy of the Au-nanoprobe assay was assessed calcu-lating positive and negative predictive values (PPV and NPV, respectively), by comparison to the gold-standard methodol-ogy, RT-PCR. These proportions determine the positive re-sults that are true-positive hits [PPV = number of positives(gold standard)/number of positives(Au-nanoprobe)] and the negative
re-sults that are true negative hits [NPV = number of negatives
(gold standard)/number of negatives(Au-nanoprobe)].
Statistical analysis
A one-way analysis of variance (ANOVA) and a post hoc Tukey’s test were carried and mean differences (P value <0.001) between groups determined with a confidence inter-val (CI) of 99 %.
Results
Au-nanoprobe calibration
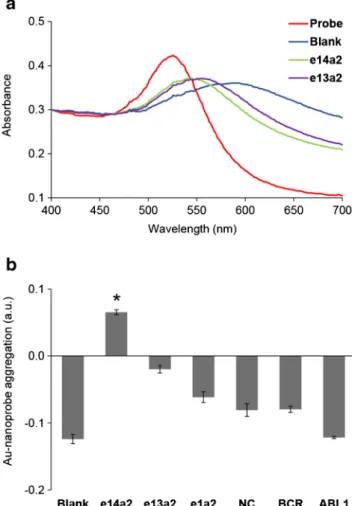
Molecular diagnostics of CML usually involves the detection of the BCR-ABL1 e14a2 fusion transcript. First, we calibrated the Au-nanoprobe to selectively identify this fusion transcript using synthetic oligonucleotides as targets for hybridization. Figure2shows that the Au-nanoprobe was able to discrimi-nate between the fully complementary target and two other BCR-ABL1 fusion transcripts that share the same ABL1 region as the e14a2 transcript (e13a2 and e1a2) at 100 fmol/μl of ssDNA oligo. One can observe the selectivity of the Au-nanoprobe towards the e14a2 transcript, as the values for BCR, ABL1, and non-complementary targets are below the defined threshold.
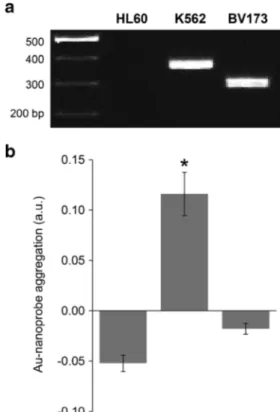
Total RNA extracted from K562 (harboring the target e14a2 fusion transcript), BV173 (harboring the e13a2 fusion transcript), and HL60 (promyelocytic leukemia cell line without fusion transcript) was used to calibrate for complex sample mixtures. The Au-nanoprobe was able to recognize the e14a2 sequence present in K562 cells, with identical specificity as that attained for syn-thetic oligonucleotides (Fig. 3).
RNA extracted from HL60 and BV173 cell lines was scored as negative despite the presence of partially com-plementary targets: BCR, ABL1, and e13a2 mRNA (Fig. 3b). The obtained value is clearly below the established threshold indicating that the system is capa-ble to selectively detect only the correct target sequence even in presence of similar sequences with more than 50 % homology to the target. The colorimetric data is in clear agreement with that of the gold standard,
RT-PCR [26, 27]. The LOD = 15 ng/μl is ideal and critical
for optimal performance and sequence discrimination di-rectly from RNA samples.
Au-nanoprobe assay for CML diagnostics
Following calibration of the Au-nanoprobe assay, 38 myeloid leukemia samples (16 AML sample and 22 CML samples), previously characterized at the cell and molecular levels, were blindly tested via the Au-nanoprobe approach and compared to RT-nested PCR. From the attained data, we determined the sensitivity, specificity, and positive and negative predictive values (PPV and NPV, respectively) for the Au-nanoprobe assay (Fig.4; Table1).
Fig. 2 Au-nanoprobe detection of the e14a2 BCR-ABL1 transcript variant. a UV-vis spectra before salt addition (Probe, red); after the addition of salt in absence of any target (blank, blue), presence of the e14a2 (green) or e13a2 (purple) BCR-ABL1 synthetic oligonucleotides. b Specificity of the Au-nanoprobe towards different synthetic oligonucleotides. A threshold of 0 for Au-nanoprobe aggregation [ln (rAbs)] was considered for discrimination between positive and negative detection. The error bars represent the standard error of the mean from three independent assays. *Statistically significant difference with P value <0.001, in comparison to e13a2 condition (post hoc Tukey’s test)
Samples were scored negative for e14a2 based on ln(rAbs) <0. Twelve clinical samples were correctly scored as positive for the e14a2 transcript and the remaining scored as negative. Even though all AML bone marrow samples were found neg-ative for t(9;22) by FISH analysis, the Au-nanoprobe method was sensitive enough to detect one AML sample harboring the e14a2 fusion transcript, confirmed by RT-nested PCR. Moreover, the Au-nanoprobe procedure allowed to scrutinize peripheral blood follow-up samples expressing the e14a2 tran-script. Sample 34, previously determined to express BCR-ABL1 levels of 0.34 % (International Scale, IS), was correctly scored as positive. According to the 2015 ELN guidelines, these levels define a complete cytogentic response (CCyR) [26].
Care should be taken when borderline values are obtained, as seen in samples 28 and 38, to avoid the occurrence of false-positives. However, results based on ln(rAbs) are in accor-dance with RT-nested PCR results. PPV (12 true positive hits out of 12 positive calls) and NPV (26 true negative hits out of 26 negative calls) of 100 % indicate that the Au-nanoprobe assay under these conditions is a reliable test to scrutinize leukemia patients expressing the e14a2 fusion transcript.
Discussion
The rapid and fast molecular characterization of CML patients is of utmost relevance if suitable therapy is to be initiated. Routine molecular diagnostics requires cumbersome equip-ment and specialized technicians to evaluate the presence of the characteristic BCR-ABL1 fusion transcripts that constitute
Fig. 3 Au-nanoprobe detection of the e14a2 BCR-ABL1 transcript variant in total RNA samples. RNA was extracted from cell lines (HL60, K562, and BV173). a Agarose (2 %) gel electrophoresis showing nested-PCR products using standardized primers for the detec-tion of the e14a2 (360 bp) and e13a2 (285 bp) transcripts. First lane is DNA ladder (GeneRuler, Fermentas). b e14a2 Au-nanoprobe detection assay. A threshold of 0 for Au-nanoprobe aggregation [ln (rAbs)] was considered for discrimination between positive and negative detection. The error bars represent the standard error of the mean from at least three independent assays. *Statistically significant difference with P value <0.001, in comparison to HL60 or BV173 samples (post hoc Tukey’s test)
Fig. 4 Au-nanoprobe detection of the e14a2 BCR-ABL1 transcript variant in total RNA clinical samples. RNA extracted from bone marrow or peripheral blood samples from patients previously diagnosed with AML (1–16) or CML (17–38). a Agarose (2 %) gel electrophoresis showing nested-PCR products using standardized primers for the detection of the e14a2 (360 bp) and e13a2 (285 bp) transcripts. Lanes L refer to DNA ladder (GeneRuler, Fermentas): 200, 300, 400, and 500 bp
(from bottom to top). b e14a2 Au-nanoprobe assay. A threshold of 0 for Au-nanoprobe aggregation [ln (rAbs)] was considered for discrimination between positive and negative detection. The error bars represent the standard error of the mean from at least three independent assays. *Statistically significant difference with P value <0.001, in comparison to sample 1 (post hoc Tukey’s test)
the hallmark of this disease. Here, we demonstrated for the first time that the Au-nanoprobe system based on the non-cross-linking mechanism may be used to rapidly identify e14a2-positive patients. Besides being able to detect a clinical sample with a BCR-ABL1 fusion transcript, this approach allowed to discriminate between the two most frequent iso-forms of this genetic abnormality—e13a2 and e14a2—that alone account for more than 95 % of CML cases. The attained PPVand NPV indicate that the Au-nanoprobe assay is suitable for the direct screening of patients’ mRNA with obvious ad-vantages in terms of time. It should be noted that the Au-nanoprobe assay detects the fusion transcript directly from RNA extracted from patient samples and, thus, is free from the stochastic bias introduced by the standard methodologies involving enzymatic retro-transcription into cDNA followed by PCR. Because it avoids these reaction steps, the Au-nanoprobe approach is much faster and simple, reducing the detection time frame from 9 h, required for RT-nested PCR alone, to 1 h and 30 min.
Diagnostic confirmation of myeloid leukemia patients where the Ph chromosome is undetectable by chromosome banding analysis or FISH is a major concern. Results achieved with an e14a2 expressing AML sample (negative for t(9;22) negative by cytogenetic analysis) and with follow-up samples with BCR-ABL1 levels as low as 0.34 % (IS) indicate the Au-nanoprobe methodology is suitable for screening patients that exhibit a CCyR but still did not achieve a major molecular response (MMR). Note that ELN recommends the assessment and monitoring of the disease by RT-qPCR on buffy coat blood cells every 3 months, not only after a CCyR has been achieved but also from the beginning [26]. The Au-nanoprobe methodology would be highly advantageous in these consec-utive tests due to its simplicity and low cost.
The Au-nanoprobe assay performance suggests that it might be useful for a combined diagnostics strategy: early screening via the Au-nanoprobes for point-of-care to quickly identify CML samples, followed by standard protocol on neg-ative samples.
The possibility of fast and cheap screening technology based on RNA samples at admission is clearly advantageous. This is particular relevant for countries where the economic burden of molecular diagnostics of rare diseases is way too high to allow routine testing via proposed guidelines. Considerable time would be saved from the time of admission to the start of therapy, which in turn would impact on therapy success with advantages for patients.
The overall cost of the Au-nanoprobe assay is approxi-mately€0.20 per sample without the need of dedicated instru-mentation. This is particularly relevant considering that the percentage of newly reported cases of CML occurring in low- to middle-income countries has more than tripled over the past 40 years and that only about 5 % of the global re-sources spent on cancer are deployed in these countries [29,
30]. CML is one of the commonest adult leukemia in Indian population accounting for 30 to 60 % of all adult leukemia, yet little is known about the epidemiology of CML in such re-gions mostly due to poor registries, lack of conclusive molec-ular diagnosis, and the prohibitive cost of CML molecmolec-ular characterization [31,32]. Indeed, the first molecular test to measure BCR-ABL1 in sub-Saharan Africa was performed in 2011 in Ethiopia [33]. The availability of rapid and cost-effective tests should result in reducing the rate of misclassi-fications for leukemia and will likely improve CML incidence and mortality rates in low- to medium-income countries.
Acknowledgments We acknowledge Fundação para a Ciência e a Tecnologia (FCT/MEC) for financial support (Project PTDC/BBB-NAN/1812/2012 and UCIBIO UID/Multi/04378/2013) and co-financed by ERDF under PT2020 Partnership Agreement (POCI-01-0145-FEDER-007728), RV for SFRH/BD/52211/2013.
Compliance with ethical standards
Conflict of interest The authors declare that they have no competing interests.
Informed consent Patients were sent to the hematology department of the Hospital dos Capuchos (CHLC, Lisbon, Portugal) for leukemia diag-nosis. Written informed consent was obtained from all participants and the study was approved by the Hospital dos Capuchos Ethics Committee. All approved ethical requirements for sample collection and assortment, processing, and analysis required by the Hospital dos Capuchos Ethics Committee have been strictly followed.
References
1. Larguinho M, Canto R, Cordeiro M, Pedrosa P, Fortuna A, Vinhas R, et al. Gold nanoprobe-based non-crosslinking hybridization for mo-lecular diagnostics. Expert Rev Mol Diagn. 2015;15(10):1355–68. 2. Doria G, Conde J, Veigas B, Giestas L, Almeida C, Assunção M, et
al. Noble metal nanoparticles for biosensing applications. Sensors. 2012;12(2):1657–87.
3. Conde J, de la Fuente JM, Baptista PV. RNA quantification using gold nanoprobes—application to cancer diagnostics. J Nanobiotechnol. 2010;8:5.
4. Jemal A, Siegel R, Xu J, Ward E. Cancer statistics, 2010. CA Cancer J Clin. 2010;60(5):277–300.
5. Jabbour E, Kantarjian H. Chronic myeloid leukemia: 2014 update on diagnosis, monitoring, and management. Am J Hematol. 2014;89(5):547–56.
6. Hehlmann R, Hochhaus A, Baccarani M. Chronic myeloid leukae-mia. Lancet. 2007;370(9584):342–50.
7. Hughes TP, Hochhaus A, Branford S, Müller MC, Kaeda JS, Foroni L, et al. Long-term prognostic significance of early molecular re-sponse to imatinib in newly diagnosed chronic myeloid leukemia: an analysis from the international randomized study of interferon versus STI571 (IRIS). Blood. 2010;116(19):3758–65.
8. Tang M, Gonen M, Quintas-Cardama A, Cortes J, Kantarjian H, Field C, et al. Dynamics of chronic myeloid leukemia response to long-term targeted therapy reveal treatment effects on leukemic stem cells. Blood. 2011;118(6):1622–31.
9. Stein AM, Bottino D, Modur V, Branford S, Kaeda J, Goldman JM, et al. BCR-ABL transcript dynamics support the hypothesis that leukemic stem cells are reduced during imatinib treatment. Clin Cancer Res. 2011;17(21):6812–21.
10. Hehlmann R, Lauseker M, Jung-Munkwitz S, Leitner A, Müller MC, Pletsch N, et al. Tolerability adapted imatinib 800 mg/d versus 400 mg/d versus 400 mg/d plus interferon-a in newly diagnosed chronic myeloid leukemia. J Clin Oncol. 2011;29(12):1634–42. 11. Rowley JD. A new consistent chromosome abnormality in chronic
myelogenous leukemia. Nature. 1973;243:290–3.
12. Burmeister T, Schwartz S, Taubald A, Jost E, Lipp T, Schneller F, et al. Atypical BCR-ABL mRNA transcripts in adult acute lympho-blastic leukemia. Haematologica. 2007;92(12):1699–702. 13. Keung YK, Beaty M, Powell BL, Molnar I, Buss D, Pettenati M.
Philadelphia chromosome positive myelodysplastic syndrome and acute myeloid leukemia—retrospective study and review of litera-ture. Leuk Res. 2004;28(6):579–86.
14. Shtivelman E, Lifshitz B, Gale RP, Canaani E. Fused transcript of abl and bcr genes in chronic myelogenous leukemia. Nature. 1985;315:550–4.
15. Weerkamp F, Dekking E, Ng YY, Van der Velden VHJ, Wai H, Böttcher S, et al. Flow cytometric immunobead assay for the detec-tion of BCR-ABL fusion proteins in leukemia patients. Leukemia. 2009;23(6):1106–17.
16. Heisterkamp N, Groffen J. Philadelphia-positive leukemia: a per-sonal perspective. Oncogene. 2002;21(56):8536–40.
17. Pane F, Intrieri M, Quintarelli C, Izzo B, Muccioli GC, Salvatore F. BCR/ABL genes and leukemic phenotype: from molecular mech-anisms to clinical correlations. Oncogene. 2002;21(56):8652–67. 18. Balatzenko G, Vundinti BR, Margarita G. Correlation between the
type of bcr-abl transcripts and blood cell counts in chronic myeloid leukemia—a possible influence of mdr1 gene expression. Hematol Rep. 2011;3(1), e3.
19. Kantarjian H, O’Brien S, Cortes J, Giles F, Thomas D, Kornblau S, et al. Sudden onset of the blastic phase of chronic myelogenous leukemia: patterns and implications. Cancer. 2003;98:81–5. 20. Li S, Ilaria RL, Million RP, Daley GQ, Van Etten RA. The P190,
P210, and P230 forms of the BCR/ABL oncogene induce a similar chronic myeloid leukemia-like syndrome in mice but have different lymphoid leukemogenic activity. J Exp Med. 1999;189(9): 1399–412.
21. Ou J, Vergilio JA, Bagg A. Molecular diagnosis and monitoring in the clinical management of patients with chronic myelogenous leu-kemia treated with tyrosine kinase inhibitors. Am J Hematol. 2008;83(4):296–302.
22. Branford S, Hughes TP, Rudzki Z. Monitoring chronic myeloid leukaemia therapy by real-time quantitative PCR in blood is a
reliable alternative to bone marrow cytogenetics. Br J Haematol. 1999;107(3):587–99.
23. Baccarani M, Deininger MW, Rosti G, Hochhaus A, Soverini S, Apperley JF, et al. European LeukemiaNet recommendations for the management of chronic myeloid leukemia: 2013. Blood. 2013;122(6):872–84.
24. Branford S, Fletcher L, Cross NC, Müller MC, Hochhaus A, Kim DW, et al. Desirable performance characteristics for BCR-ABL measurement on an international reporting scale to allow consistent interpretation of individual patient response and comparison of re-sponse rates between clinical trials. Blood. 2008;112(8):3330–8. 25. Hughes T, Deininger M, Hochhaus A, Branford S, Radich J, Kaeda
J, et al. Monitoring CML patients responding to treatment with tyrosine kinase inhibitors: review and recommendations for harmo-nizing current methodology for detecting BCR-ABL transcripts and kinase domain mutations and for expressing results. Blood. 2006;108(1):28–37.
26. Baccarani M, Castagnetti F, Gugliotta G, Rosti G. A review of the European LeukemiaNet recommendations for the management of CML. Ann Hematol. 2015;94(2):S141–7.
27. van Dongen JJ, Macintyre EA, Gabert JA, Delabesse E, Rossi V, Saglio G, et al. Standardized RT-PCR analysis of fusion gene tran-scripts from chromosome aberrations in acute leukemia for detec-tion of minimal residual disease. Report of the BIOMED-1 concert-ed action: investigation of minimal residual disease in acute leuke-mia. Leukeleuke-mia. 1999;13(12):1901–28.
28. Drexler HG. Malignant hematopoietic cell lines: in vitro models for the study of myelodysplastic syndromes. Leuk Res. 2000;24(2): 109–15.
29. Farmer P, Frenk J, Knaul FM, Shulman LN, Alleyne G, Armstrong L, et al. Expansion of cancer care and control in countries of low and middle income: a call to action. Lancet. 2010;376(9747): 1186–93.
30. CanTreat International. Scaling up cancer diagnosis and treatment in developing countries: what can we learn from the HIV/AIDS epidemic? Ann Oncol. 2010;21(4):680–2.
31. Bansal S, Prabhash K, Parikh P. Chronic myeloid leukemia data from India. Indian J Med Paediatr Oncol. 2013;34(3):154. 32. Tekinturhan E, Audureau E, Tavolacci MP, Garcia-Gonzalez P,
Ladner J, Saba J. Improving access to care in low and middle-income countries: institutional factors related to enrollment and patient outcome in a cancer drug access program. BMC Health Serv Res. 2013;13(1):304.
33. Garcia-Gonzalez P, Boultbee P, Epstein D 2015 Novel humanitar-ian aid program: the Glivec International Patient Assistance Program—lessons learned from providing access to breakthrough targeted oncology treatment in low- and middle-income countries. J Glob Oncol 000570