Effect of Misalignment between Successive
Corneal Videokeratography Maps on the
Repeatability of Topography Data
FangJun Bao1,2‡, JunJie Wang3‡, JinHai Huang1,2, Ye Yu1,2, ManLi Deng1,2, LinNa Li1,2, AYong Yu1,2, QinMei Wang1,2*, Pinakin Gunvant Davey4, Ahmed Elsheikh3,5
1The Affiliated Eye Hospital of WenZhou Medical University, Wenzhou, 325027, China,2The institution of ocular biomechanics, Wenzhou Medical University, Wenzhou, Zhejiang Province 325027, China,3School of Engineering, University of Liverpool, Liverpool L69 3GH, United Kingdom,4College of Optometry, Western University of Health Sciences, Pomona, CA 91766, United States of America,5NIHR Biomedical Research Centre for Ophthalmology, Moorfields Eye Hospital NHS Foundation Trust and UCL Institute of Ophthalmology, United Kingdom
‡These authors are co-first authors on this work. *[email protected]
Abstract
Purpose
To improve the reliability of corneal topographic data through the development of a method to estimate the magnitude of misalignment between successive corneal videokeratography (VK) maps and eliminate the effect of misalignment on the repeatability of topography data.
Methods
Anterior and posterior topography maps were recorded twice for 124 healthy eyes of 124 participants using a Pentacam, and the repeatability of measurements was assessed by calculating the differences in elevation between each two sets of data. The repeatability of measurements was re-assessed following the determination of the magnitude of misalign-ment components (translational displacemisalign-ments: x0, y0and z0, and rotational displacements: α,βandγ) between each two data sets and using them to modify the second data set within each pair based on an Iterative Closest Point (ICP) algorithm. The method simultaneously considered the anterior and posterior maps taken for the same eye since they were assumed to have the same set of misalignment components. A new parameter, named Combined Misalignment parameter (CM), has been developed to combine the effect of all six misalignment components on topography data and so enable study of the association between misalignment and the data repeatability test results.
Results
The repeatability tests resulted in average root mean square (RMS) differences in elevation data of 8.46±2.75μm before ICP map matching when simultaneously considering anterior and posterior surfaces. With map matching and misalignment correction, the differences
OPEN ACCESS
Citation:Bao F, Wang J, Huang J, Yu Y, Deng M, Li L, et al. (2015) Effect of Misalignment between Successive Corneal Videokeratography Maps on the Repeatability of Topography Data. PLoS ONE 10(11): e0139541. doi:10.1371/journal.pone.0139541
Editor:Sanjoy Bhattacharya, Bascom Palmer Eye Institute, University of Miami School of Medicine, UNITED STATES
Received:February 14, 2015
Accepted:August 11, 2015
Published:November 23, 2015
Copyright:© 2015 Bao et al. This is an open access article distributed under the terms of theCreative Commons Attribution License, which permits unrestricted use, distribution, and reproduction in any medium, provided the original author and source are credited.
Data Availability Statement:All relevant data are within the paper and its Supporting Information file.
decreased to 7.28±2.58μm (P = 0.00). When applied to only the anterior maps, misalign-ment correction led to a more pronounced reduction in elevation data differences from 4.58
±1.84μm to 2.97±1.29μm (P = 0.00). CM was found to be associated with the repeatability error (P = 0.00), with posterior maps being responsible for most of the error due to their rela-tively lower accuracy compared to anterior maps.
Conclusions
The ICP algorithm can be used to estimate, and effectively correct for, the potential mis-alignment between successive corneal videokeratography maps.
Introduction
The transparent cornea is a most important optical component of the outer ocular tunic, con-tributing about 70% of the total refractive power of the eye [1]. The reliable characterisation of corneal shape is critical for the assessment of vision quality and has become increasingly neces-sary for several applications, particularly in planning refractive surgery procedures [2],[3], diagnosis and management of corneal disorders [4],[5] and fitting of contact lenses [6],[7] and especially for orthokeratology corrections. In these applications and in order to monitor the corneal condition longitudinally, it is essential that topography mapping is accurate and repeatable.
Repeated measurements, either within the same setting or over time, are unlikely to be taken from precisely the same angle and position and the potential misalignment between readings will likely have an effect in inflating the differences between topography measure-ments and the errors in repeatability tests [8]. In addressing this point, the current study employs an Iterative Closest Point (ICP) algorithm (a dominant method for registration of 3D free-form surfaces [9],[10]) to quantify and correct for misalignment between successive maps. The ICP algorithm can accurately align views of an object (collected from different viewpoints and therefore located in separate coordinate systems) to obtain a larger map of the object’s sur-face. Applying this technique to successive corneal maps enables estimation of relative mis-alignment and the application of rigid-body transformation to eliminate the effect of this misalignment.
Commonly, repeatability of videokeratography (VK) maps is tested atsingle pointsusing measures such as the within-subject standard deviation (Sw), within-subject coefficient of vari-ation (CV), coefficient of repeatability (CoR), intraclass correlvari-ation coefficients (ICCs) and Bland Altman Plots [11–17]. To widen the effectiveness of these measures, they can be applied repeatedly at points across the part of the corneal surface covered by VK maps. While repeating this exercise enables a more comprehensive evaluation of topographic data repeatability, it makes the analysis more expensive and time consuming, and still not truly representative of the whole map area. In this study, repeatability is assessed through direct comparisons between the elevation data obtained across the whole VK map area, allowing a more comprehensive representation of data repeatability and assessment of the distribution of data mismatch between successive maps.
The determination of misalignment components (translational displacements: x0, y0, z0, and
rotational displacements:α,β,γ) using ICP algorithm allows relative, rigid-body transforma-tion of maps to eliminate misalignment and hence enable testing data repeatability before and after the transformation. However, while this exercise can provide qualitative assessment of the Competing Interests:The authors have declared
effect of misalignment on data repeatability, the fact that misalignment is determined in the form of six independent components makes it challenging to have a quantitative correlation between misalignment and data repeatability. This desired outcome is thought to be quite important clinically as it could provide a direct relation between the misalignment between maps (which can be quantified using ICP) and the reliability of topographic data used to guide clinical decisions. For this reason, this study attempted to create a parameter that describes the overall effect of misalignment and is therefore dependent on the six misalignment components and their individual effects on data repeatability.
The current study concentrated on using the Pentacam topographer (Oculus Optikgerate GmbH, Wetzlar, Germany), which offered all data needed for analysis, namely both anterior and posterior surface maps, elevation data in the form of x, y, z coordinates and reliable, repeat-able measurements of biometric parameters such as the anterior chamber depth (ACD), central corneal thickness (CCT), corneal curvature (CC) and best-fit sphere (BFS) [11–13,18]. How-ever, the study findings are independent of the imaging method used by the Pentacam, and therefore should be applicable to topography maps produced by other VK techniques.
Material and Methods
Study participants
124 healthy subjects (78 male and 46 female) aged between 18 and 40 years (mean 23.2±4.3 years) were recruited from corneal refractive surgery patients and medical trainees of the Eye Hospital of Wenzhou Medical University, China. The study followed the tenets of the Declara-tion of Helsinki and was approved by the Scientific Committee of the Eye Hospital. Signed informed consent was obtained from the subjects prior to conducting the procedures. The inclusion criteria were ocular astigmatism less than 2.00D, intraocular pressure less than 21 mmHg, no ocular disease, no history of trauma, no previous ocular surgery and no contact lens wear for at least two and four weeks before topography measurement for soft contact lens and gas permeable contact lens (RGP) wearers, respectively. Eyes that did not meet these criteria were excluded.
Data Acquisition
The study parameters included refractive error (RE), corneal curvature in horizontal (Kh) and vertical directions (Kv), central corneal thickness (CCT), and corneal elevation data of anterior and posterior surfaces. RE was measured with a phoroptor (RT-2100, Nidek Inc, Gamagori, Japan) and converted to spherical equivalent, SE. Kh, Kv, CCT and corneal elevation were pro-vided by a Pentacam. Room lights were switched off during data acquisition. Each subject was asked to blink just before each measurement and fixate on a light inside the machine. After each acquisition, the device was moved back and realigned for the next scan. The measure-ments continued until two scans with an instrument-generated quality factor of at least 95% and 90% were obtained for the anterior and posterior surfaces, respectively. Only data from the right eyes were collected and used in analysis. All measurements were taken by the same trained examiner (JC). The elevation maps of each anterior and posterior surface were exported in the form of a matrix with 141×141 grid.
Repeatability analysis
each pair of measurement both before and after eliminating the effect of misalignment compo-nents estimated by the ICP algorithm. In addition to providing a single measure of data match, the results of the elevation comparisons enabled assessment of the distribution of error across the topography measurement area.
The area of overlap between the two measurements after data transformation was also cal-culated as an additional measure of repeatability, although in this case it was much less effective since the area of overlap did not undergo significant reduction even with the largest misalign-ments observed in the study.
Topography analysis using ICP
As a feature-based registration and surface matching technique, ICP is directly applicable to the featureful 3D shape of the corneal anterior and posterior surfaces. The algorithm checks the similarities between the overlapping maps to determine the rigid-body transformations needed for the best possible match. Since its introduction by Yang and Paul [9,10], the ICP algorithm has become the dominant method for image registration, and subsequent studies have improved the original algorithm and the stability of its analysis procedure [19]. The vari-ant of ICP algorithm used in this paper is presented in this section.
In the ICP algorithm, a spatial transformation of a surfaceP(second topography map) is conducted to maximize its match with another surfaceQ(first topography map), with both surfaces expressed as sets of discrete data points (pi2P;i= 1,2,. . .,m) and (qj2Q;j= 1,2,. . .,
n), andmandnbeing the numbers of points on the two surfaces, respectively. The spatial transformation takes the form of a rigid-body transformationT= (R|t), whereR=RzRyRxis the spatial extrinsic rotation around the origin of a fixed coordinate system, consisting of three sequential rotations Rx,Ry,and Rz,aboutx,yandzaxes by rotational componentsα,βandγ:
Rx¼
1 0 0
0 cosa sina
0 sina cosa
0 B B @ 1 C C A
;Ry¼
cosb 0 sinb
0 1 0
sinb 0 cosb
0 B B @ 1 C C A
;Rz¼
cosg sing 0
sing cosg 0
0 0 1
0 B B @ 1 C C Að1Þ
andt= (x0y0z0)Tis the translation vector including translational components alongx,yandz
axes. The transformation is applied to pointspiin the form:pi¼Rpiþt, and the registration problem then focuses onfinding the transformation (R,t) that provides the best possible align-ment of surfacePwith surfaceQ. This is done by iteratively updating the position of surfaceP
such that in the‘th iteration
fðR‘;t‘Þ ¼ X
m‘
i¼1
nT
i;‘ðpi;‘ qi;‘Þ 2 ð2Þ
is minimised, resulting inpi;‘¼R^
‘pi;‘ 1þ^t‘with ^
R‘and^t
‘being the optimal solution for
the minimisation of Eq (2). In this calculation,qi;‘, now also subscripted byirather thanj, is the corresponding point or correspondence ofpi;‘ 1(i.e. the point on surfacePthat have been
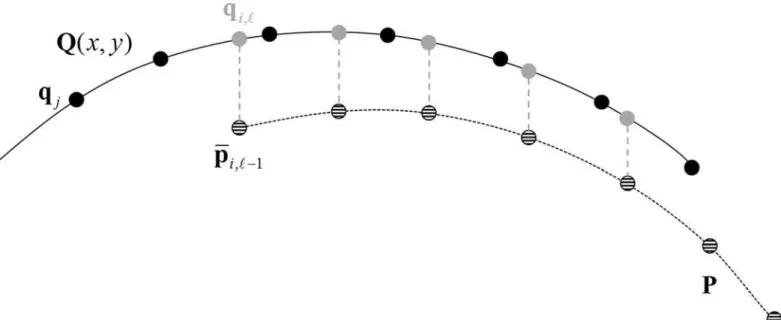
updated by the last iteration), determined before the minimisation of Eq (2) by intersecting surfaceQwith a vertical line that originates frompi;‘ 1(Fig 1). Further,ni;‘is the normal to
surfaceQat pointqi;‘and thereforeniT;‘ðpi;‘ qi;‘Þis the point-to-plane distance, which is the
A consequence of this technique is that the correspondenceqi;‘is not necessarily one of the original discrete pointsqjrepresenting surfaceQand also the number of points included in Eq (2) may be less than the number of points in the original measurements surfacePand surface
Q(e.g.m‘m) because some of the points may have moved outside the region of surfaceQ
(e.g.Fig 1). This makes it necessary tofit pointsqjto orthogonal Zernike polynomials
Qðx;yÞ ¼X 1
k¼1
akzkðx;yÞ !
and use the polynomials and the coordinates x, y of pointpi;‘ 1to
locate pointqi;‘and computeni;‘on surfaceQ. Zernike polynomials are widely used in ocular applications including wave-front representation and topographyfitting [20], and in practice a
finite set of Zernike polynomials is sufficient to reconstructQ(x,y) such that
Qðx;yÞ ¼X
M
k¼1
akZkðx;yÞ þε ð3Þ
whereMis the number of Zernike polynomials determined by the polynomials’orderNsuch thatM= (N+1)(N+2)/2 andεrepresents the truncation error. The polynomial coefficientsak may be obtained by linear regression onto the measured discrete opography data [21]. The order of Zernike polynomials in this paper has been chosen as 10 (i.e.N= 10), for which the reconstruction error, i.e. the root mean square (RMS) error between points on the original map and the reconstructed map, has consistently been less than 1μm.
The matching process starts with a reasonable estimateT0= (R0|t0) of the position of sur-faceP, which in this study was zero values for all six misalignment components. This estimate brings surfacePto its initial positionpi;0 ¼R0piþt0and the iterative process given earlier is
implemented until the left hand term in Eq (2) reaches a stable value.
The outcome of this process is an estimate of the misalignment components between sur-facePand surfaceQin the form of rigid-body rotations,R, and displacements,t. In addition, Fig 1. Method adopted to locate pointsqi;‘on surface Q that correspond to pointspi;‘1on surface P in the‘thiteration.Hashed pointspi;‘1
(although moving through iterations) and black pointsqjare original discrete points of the measurements of surface P and surface Q. Surface Q has been
fitted to set of Zernike polynomials and expressed by Q(x,y) and thus represented infigure as a solid curve. Pointqi;‘in grey corresponds to, and has the
the process results in a shifted surfacePwith pointspi¼Rpiþtwhich have been corrected for misalignment with surfaceQ. This overall transformationT= (R | t) is computed after the ICP process has reached the stable solution (e.g. afterLiterations) by a recursive relation expressed as
R¼R^
L ^
R1R0 and t¼
^
RL R^
1t0þ
^
RL R^
2^t1þ þ
^
RL^t
L 1þ^tL ð4Þ
In this study, it is expected that misalignment between topography measurements would affect anterior and posterior maps equally. Therefore, the ICP process adopted combined both maps in the objective function in the form:
fðR‘;t‘Þ ¼X
ma;‘
ia¼1
nT
ia;‘ðpia;‘ qia;‘Þ 2 þX
mp;‘
ip¼1
nT
ip;‘ðpip;‘ qip;‘Þ 2 ð5Þ
where the points on anterior and posterior maps are indexed byiaandiprespectively and the numbers of both maps arema;‘andmp;‘respectively. This process ensured that only one set of
misalignment components was obtained for each eye.
Repeatability of the topography data was calculated both before and after the ICP process as the RMS elevation differences between maps P and Q for each participant, i.e.
RMS1¼
ffiffiffiffiffiffiffiffiffiffiffiffiffiffiffiffiffiffiffiffiffiffiffiffiffiffiffiffiffiffiffi
X m1
i¼1
ðpz;i qz;iÞ
2 m1 v u u u t
andRMS2 ¼
ffiffiffiffiffiffiffiffiffiffiffiffiffiffiffiffiffiffiffiffiffiffiffiffiffiffiffiffiffiffiffiffi
X m2
i¼1
ðpz;i qz;iÞ
2 m2 v u u u t
wherepz,iandqz,iare z
coordi-nates of pointspiandqibefore ICP process,pz;iandqz;iare z coordinates ofpiandqiafter
ICP process, respectively.qiis the corresponding point ofpilocated after the original pointspi have been corrected for misalignment with surfaceQ(Fig 1). This calculation considers only data points in the overlapping region of the two topography maps, and the numbers of points in the two maps within the overlapping region arem1andm2, respectively.
ICP validation
In order to assess the validity of the ICP outcome, the study started with an exercise in which the ability of the algorithm to predict pre-set misalignments between two identical corneal sur-faces is tested. The exercise relied on surfaceQ; an 8mm diameter topography map of a ran-domly selected participant in the form of a 141×141 rectangular grid with x, y, z coordinates at each point. SurfacePwas then generated using the same VK data, but after introducing pre-determined translational and rotational transformations. SurfacePdid not share the same x, y coordinates with surfaceQas a result of the transformations introduced, but retained the noise that typically existed in the measurements. Eleven cases with the misalignment
components depicted inTable 1were included in the study. The cases referred to the averages and standard deviations of misalignment components determined for the clinical dataset of the study; x0-average= 0.76±49.14μm, y0-average= 1.05±53.92μm, z0-average= -0.45±0.93μm, αaverage= -0.01±0.41 degrees,βaverage= 0.01±0.37 degrees andγaverage= 0.04±2.35 degrees. The
Combined misalignment parameter
The fact that misalignment is expressed in 6 independent components makes it difficult to directly assess the relative importance of one misalignment component over another or the combined effect of all components on the repeatability of topographic data. In order to address this point, a new parameter named the combined misalignment parameter (CM) has been developed to combine the effect of the 6 misalignment components on map matching and potentially present a clear measure of data repeatability. The derivation of a value for the new misalignment parameter in a particular case involved the application of the 6 misalignment components obtained using the ICP algorithm on an ellipsoidal topography map
x2 a2þ
y2 b2þ
ðz dÞ2
c2 ¼1with average dimensions; a = 8.65, b = 8.54, c = 9.54, d = -9.54 and radius
9mm (obtained from bestfit ellipsoids with study topography maps). As described above, the application of the 6 misalignment components resulted in a rigid-body transformation of the map:si¼Rsiþt, wheresiwere sample points on the ellipsoidal map,i= 1,2,. . .. . .mandm was number of points. A set of new pointssion the original ellipsoidal topography map were then computed using the same x and y coordinates as forsito enable the computation of the
combined misalignment parameter as:CM¼
ffiffiffiffiffiffiffiffiffiffiffiffiffiffiffiffiffiffiffiffiffiffiffiffiffiffi
Xm
i¼1
ðzi ziÞ2
m v u u t
whereziandziare the z
coor-dinates ofsiandsi, respectively. CM, which combined the effect of the six misalignment com-ponents, was used in the study to enable direct assessment of the association between the magnitude of misalignment and the result of the repeatability tests.
Statistical analysis
The fit with normal distribution was tested through a single sample K-S check test. Column diagram plots were drawn to show the distribution of the misalignment components. The com-parison of misalignment components with zero was tested in the One-Sample T Test. Com-mercial software SPSS 20.0 (Chicago, USA) was utilized for all analyses and a two-tailed probability of P<0.05 was considered statistically significant.
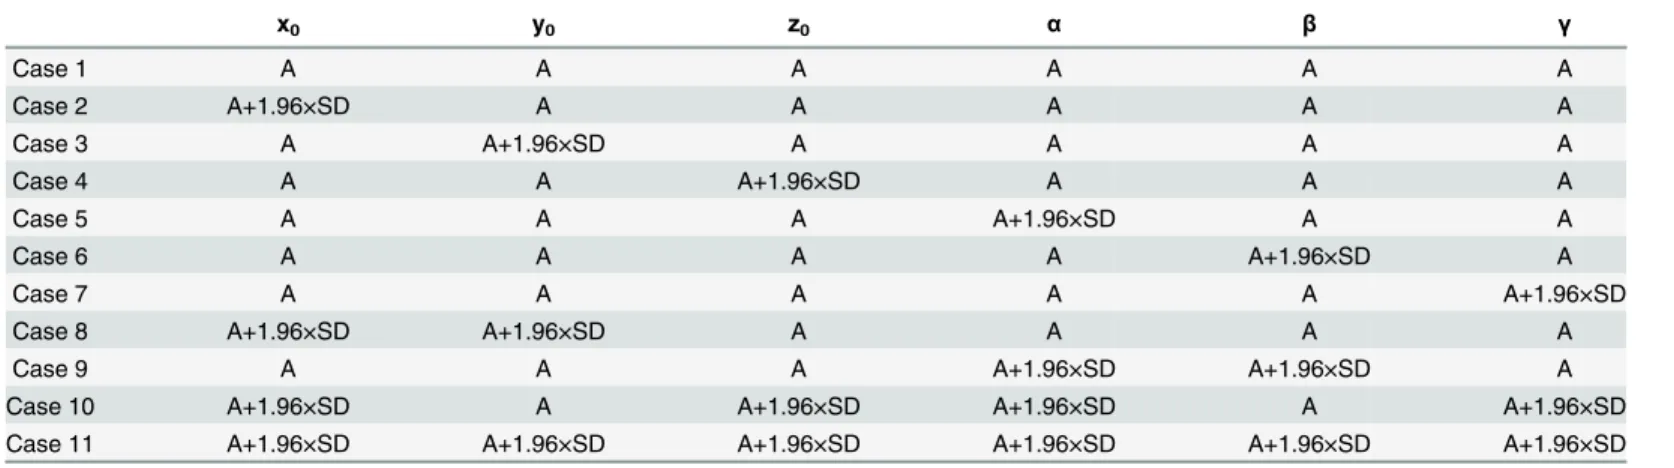
Table 1. Pre-set misalignment components used in 11 cases considered in the validation study.
x0 y0 z0 α β γ
Case 1 A A A A A A
Case 2 A+1.96×SD A A A A A
Case 3 A A+1.96×SD A A A A
Case 4 A A A+1.96×SD A A A
Case 5 A A A A+1.96×SD A A
Case 6 A A A A A+1.96×SD A
Case 7 A A A A A A+1.96×SD
Case 8 A+1.96×SD A+1.96×SD A A A A
Case 9 A A A A+1.96×SD A+1.96×SD A
Case 10 A+1.96×SD A A+1.96×SD A+1.96×SD A A+1.96×SD
Case 11 A+1.96×SD A+1.96×SD A+1.96×SD A+1.96×SD A+1.96×SD A+1.96×SD
*A = mean value, SD = standard deviation
Results
Validation study
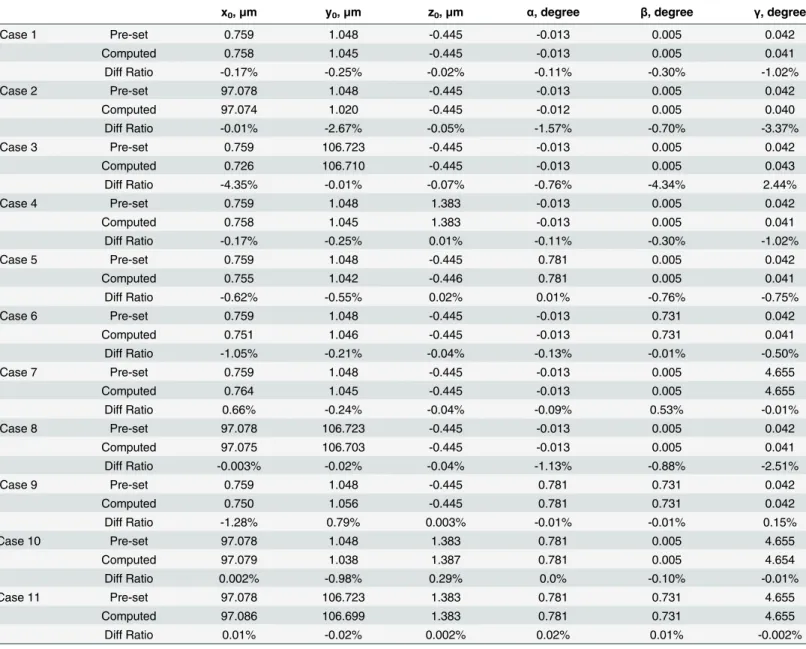
The success of the ICP algorithm in estimating the pre-set misalignment components of the 11 cases described inTable 1is illustrated in the results presentedTable 2. The max error was -4.35% of the pre-set values and all the ratios between the errors and the corresponding pre-set values were on average equal to 0.43%, with a standard deviation ratio of 1.05%.
The ICP success was highest with z0misalignments, where the average error ratio was
0.006±0.097%. The error ratio became larger, yet still negligible, with x0, y0,α,βandγ
Table 2. Matching results of the cases considered in the validation study.
x0,μm y0,μm z0,μm α, degree β, degree γ, degree
Case 1 Pre-set 0.759 1.048 -0.445 -0.013 0.005 0.042
Computed 0.758 1.045 -0.445 -0.013 0.005 0.041
Diff Ratio -0.17% -0.25% -0.02% -0.11% -0.30% -1.02%
Case 2 Pre-set 97.078 1.048 -0.445 -0.013 0.005 0.042
Computed 97.074 1.020 -0.445 -0.012 0.005 0.040
Diff Ratio -0.01% -2.67% -0.05% -1.57% -0.70% -3.37%
Case 3 Pre-set 0.759 106.723 -0.445 -0.013 0.005 0.042
Computed 0.726 106.710 -0.445 -0.013 0.005 0.043
Diff Ratio -4.35% -0.01% -0.07% -0.76% -4.34% 2.44%
Case 4 Pre-set 0.759 1.048 1.383 -0.013 0.005 0.042
Computed 0.758 1.045 1.383 -0.013 0.005 0.041
Diff Ratio -0.17% -0.25% 0.01% -0.11% -0.30% -1.02%
Case 5 Pre-set 0.759 1.048 -0.445 0.781 0.005 0.042
Computed 0.755 1.042 -0.446 0.781 0.005 0.041
Diff Ratio -0.62% -0.55% 0.02% 0.01% -0.76% -0.75%
Case 6 Pre-set 0.759 1.048 -0.445 -0.013 0.731 0.042
Computed 0.751 1.046 -0.445 -0.013 0.731 0.041
Diff Ratio -1.05% -0.21% -0.04% -0.13% -0.01% -0.50%
Case 7 Pre-set 0.759 1.048 -0.445 -0.013 0.005 4.655
Computed 0.764 1.045 -0.445 -0.013 0.005 4.655
Diff Ratio 0.66% -0.24% -0.04% -0.09% 0.53% -0.01%
Case 8 Pre-set 97.078 106.723 -0.445 -0.013 0.005 0.042
Computed 97.075 106.703 -0.445 -0.013 0.005 0.041
Diff Ratio -0.003% -0.02% -0.04% -1.13% -0.88% -2.51%
Case 9 Pre-set 0.759 1.048 -0.445 0.781 0.731 0.042
Computed 0.750 1.056 -0.445 0.781 0.731 0.042
Diff Ratio -1.28% 0.79% 0.003% -0.01% -0.01% 0.15%
Case 10 Pre-set 97.078 1.048 1.383 0.781 0.005 4.655
Computed 97.079 1.038 1.387 0.781 0.005 4.654
Diff Ratio 0.002% -0.98% 0.29% 0.0% -0.10% -0.01%
Case 11 Pre-set 97.078 106.723 1.383 0.781 0.731 4.655
Computed 97.086 106.699 1.383 0.781 0.731 4.655
Diff Ratio 0.01% -0.02% 0.002% 0.02% 0.01% -0.002%
x0, y0, z0represent the translational displacements of corneal surface;α,β,γrepresent the angular rotations about the three main axes (x, y and z);
Pre-setmeans the artificial misalignments added to the corneal elevation data pre topography matching;Computedmeans the misalignments calculated using the ICP algorithm;Diff Ratioin percentages means the ratio of the difference compared with Pre-set misalignments
misalignments with similar error ratios of -0.63±1.35%, -0.40±0.86%, -0.35±0.55%, -0.62± 1.30%, and -0.60± 1.50% respectively.
Study of clinical data
There was a wide range of RE (0.13 to -11.13D), Kh(39.52 to 46.71 D), Kv (40.18 to 48.04 D)
and CCT (463 to 607μm). Averages, standard deviations and ranges of misalignment
compo-nents x0, y0, z0,α,β,γwere 0.76±49.14μm (-151.82–156.58), 1.05±53.92μm (-181.02–125.36),
-0.45±0.93μm (-3.99–1.86), -0.01±0.41 degrees (-0.99–1.29), 0.01±0.37 degrees (-1.1–1.15),
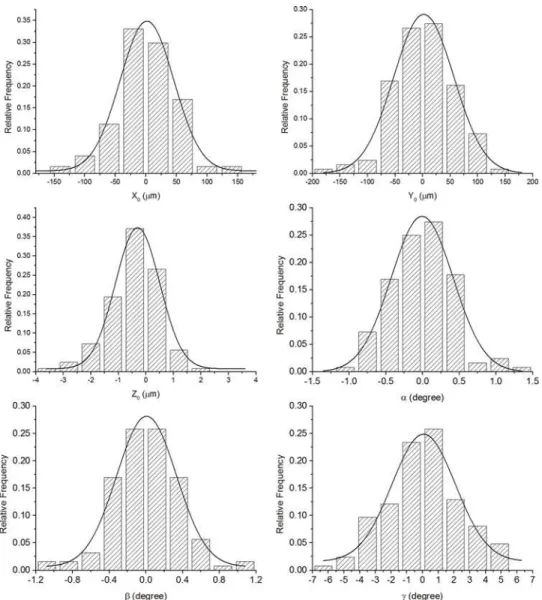
0.04±2.35 degrees (-6.2–5.49), respectively. All misalignment components between successive measurements were normally distributed as demonstrated inFig 2, and most (x0, y0,α,β,γ)
were not significant from zero except for z0(P = 0.000). Before topography matching, the
repeatability test was conducted on successive maps and the RMS of fit errors was 8.46± 2.75μm (3.91–19.89μm) for both anterior and posterior surfaces, considered simultaneously.
The RMS of fit errors then decreased to 7.28±2.58μm (2.52–17.19μm) (reduction of 13.95%)
Fig 2. Column diagrams of the distribution of the six misalignment components (x0, y0, z0,α,β,γ) as
calculated using the ICP algorithm for all clinical data.
following the ICP correction of misalignment. The correction of misalignment was associated with a negligible change in the area of overlap within each pair of topography maps; from 98.17±0.22% to 98.00±0.20% of total area. Due to the expected lower accuracy of posterior maps compared to anterior maps, the map matching exercise was repeated while considering only anterior maps then only posterior maps. With anterior maps, the RMS of fit errors reduced significantly from 4.58±1.84μm (1.79–10.90μm) to 2.97±1.29μm (1.08–7.63μm)
(reduction of 35.13%) following correction for misalignment, while the change was from 11.40±4.05μm (4.95–28.83μm) to 10.25±3.89μm (3.11–25.05μm) (reduction of 10.09%) in
posterior maps.
Distribution of fit errors
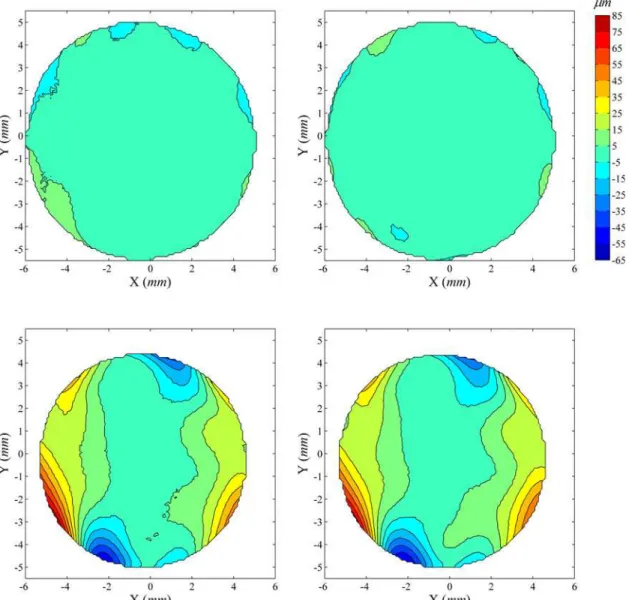
The distribution of fit errors across map area was examined before and after ICP correction of misalignment. Two typical cases are shown in Figs3and4.Fig 3shows a case where ICP cor-rection has improved the repeatability fit error significantly (reduction of 46.5%, from 13.53μm to 7.24μm), whileFig 4shows a case with little error reduction (0.78% from
12.07μm to 11.98μm). In both cases, as well as all other tested cases, the fit errors for both
anterior and posterior surfaces increased from the central to the peripheral region. After ICP correction, the central area with small fit error increased in size, especially in cases with large overall reductions in fit error (Fig 3).
Association between combined misalignment parameter and map fit
quality
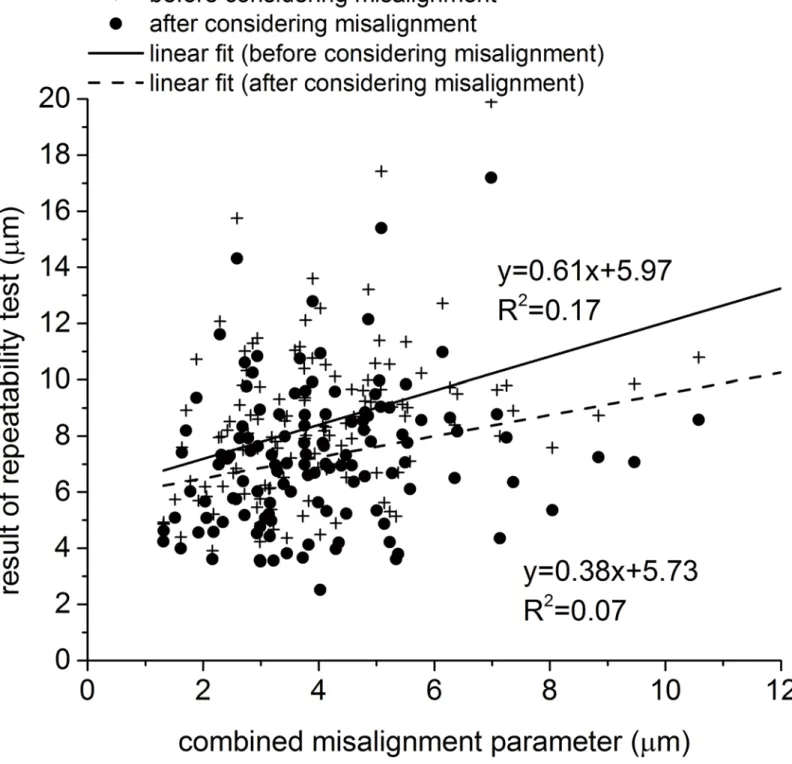
Fig 5shows the correlation between the CM, that is intended to combine the effect of all 6
mis-alignment components, and the RMS of fit error between pairs of maps, both before and after applying the ICP process to correct the second maps for misalignment. As expected, the corre-lation between the CM and the RMS of fit error reduced after correcting for misalignment, however, the effect was weak with limited reductions in correlation gradient from 0.61 to 0.38 and in the coefficient of determination (R2) from 0.17 (P = 0.00) to 0.07 (P = 0.00). This small effect and the low initial values of correlation gradient and R2indicate that the ICP was less successful than expected in estimating and correcting for misalignment. This outcome could be a result of the significantly lower accuracy of posterior maps relative to anterior maps, and the fact that our method necessitated the simultaneous consideration of both sets of maps when using the ICP algorithm. In order to assess the effect of including posterior maps in the analy-sis, the results presented inFig 5were separated for anterior and posterior maps and presented separately inFig 6A and 6B, respectively. These figures show that while both map sets have the same values of misalignment components, as estimated by the ICP, the anterior maps exhibited a stronger correlation between the CM and the RMS of fit error within map pairs. For anterior maps, the gradient of CM–RMS error was 0.84 and the R2was 0.59 (P = 0.00), both reducing significantly after correcting for misalignment to 0.24 and 0.09 (P = 0.00), respectively. On the other hand, posterior maps, which still had the same misalignment components, showed ini-tially a lower gradient of 0.32 and R2of 0.04 (P = 0.02), both reducing slightly after correcting for misalignment to 0.25 and 0.02 (P = 0.06), respectively.
Discussion
Instruments used in clinics should give accurate and repeatable readings. Repeatability, defined as the consistency between readings on the same instrument under the same conditions, should be high, and same or very similar results should be obtained if the measuring instrument pro-duces repeatable data. A common feature of most of the current videokeratography (VK) sys-tems is that their maps are viewer-centered representations of topography, the accuracy and reliability of which are influenced by fixation lags and eye movements. Large misalignments are usually rejected by topography devices or compensated during data acquisition [18,22] but smaller misalignments may be unavoidable. In spite of their small magnitude, these misalign-ments may affect the accuracy of biometric parameter estimates such as corneal curvature and asphericity in both anterior and posterior surfaces and makes comparisons between successive Fig 3. Distribution of elevation difference between successive corneal topographies before and after elimination of misalignment using ICP algorithm: Case 1.The first row shows contour maps of elevation difference in the common region of two successive anterior corneal topographies before (left) and after (right) elimination of misalignment using ICP algorithm, while the second row shows corresponding contour maps for posterior topographies. The four contour maps share the same colour scale (upright inμm). In this particular case, before ICP correction of misalignment, the RMS of fit error is 13.53μm for both anterior and posterior surfaces, considered simultaneously, reduced to 7.24μm (46.49% reduction) following the ICP correction.
maps, either taken in the same setting or over time, less reliable. This study attempts to address this important point as it introduces a method, based on the ICP algorithm, to estimate, and eliminate the effect of, misalignment between successive topography maps and hence improve the repeatability of topographic data.
The ICP algorithm, originally proposed to align 3D surfaces, has become the dominant method for matching maps collected for the same object but from different viewpoints [23]. The use of ICP algorithm to estimate and correct for misalignment in corneal topography maps is believed to be more straightforward and potentially more computationally efficient than earlier methods such as those developed by Tobias et al [8] and Franklin et al [24,25]. Unlike our method, Tobias’s method did not take into account that, concomitant with gaze changes, the area of measurement changed from one map to another, leading to potential inac-curacies. On the other hand, Franklin and co-workers presented a technique based on the least squares method to match central and peripheral maps in which attention was limited to fitting Fig 4. Distribution of elevation difference between successive corneal topographies before and after correction for misalignment: Case 2.Before ICP correction, the RMS of fit error was 12.07μm for both anterior and posterior surfaces, considered simultaneously, and reduced by only 0.78% to 11.98μm following correction.
points on the peripheral maps to points on the central maps, rather than fitting the surfaces together. Their technique further allowed only for relative shifts but not rotations of maps, and considered only the parts of the peripheral maps outside the central map region, rather than using the whole peripheral maps in producing the final overall corneal map. Franklin’s tech-nique is also based on the differences in axial radii of curvature as the alignment criterion, the Fig 5. Correlation between the combined misalignment parameter and the RMS of error of fit within pairs of topography maps before and after correcting for misalignment.Anterior and posterior maps were considered simultaneously in both estimating and correcting for misalignment.
measurement of which depends on the VK axis and represents curvatures only along the meridians while ignoring shape properties in other directions [26]. In the present study, (1) the ICP algorithm was used instead of the least squares method to improve computational effi-ciency, (2) focus has been on fitting surfaces rather than sets of points, (3) both translation and rotation of the peripheral surface was enabled, and (4) elevation rather than curvature data were used. A potential drawback of the method is its reliance on an initial, estimated position of the moving surface. However, the fact that misalignment between topography maps is likely to be small makes it possible to start the calculations while assuming all misalignment compo-nents have zero values.
The ICP algorithm is expected to be more suitable for matching elevation maps than curva-ture maps. Since curvacurva-ture measurements are videokeratograph axis dependent and represent curvatures only along the meridians [22], similar curvature maps may depict different shapes if their reference axes were different, making the ICP algorithm potentially unsuitable in this case. An exception to this rule is when the curvature map becomes independent of the refer-ence axes as in the less-commonly used corneal topography system Cassini (i-Optics, Nether-lands), in which curvature data is obtained from a grid style reflection method. Additionally, elevation maps may present another problem if the shapes under consideration were too smooth and featureless, leading to ambiguous alignment. However, the non-spherical form of the cornea and its lack of rotational symmetry enable exclusion of this possibility and provide confidence in the misalignment estimates.
The effectiveness of the ICP algorithm in estimating misalignment between successive maps was assessed in the study before using it on the clinical data. The assessment relied on a typical topography map, randomly selected from the clinical database. The map was duplicated with the copy subjected to sets of known misalignment components. The maps (original and shifted copy) were then re-aligned using the ICP algorithm and the misalignment estimations were compared with the pre-set values. The results of this exercise provided strong evidence of the effectiveness of the algorithm with the max error of fit between the maps being slightly above 1% of the pre-set values.
Correction of misalignment in the clinical database led to mean reductions in elevation dif-ferences from 8.46±2.75μm to 7.28±2.58μm, when considering anterior and posterior maps
Fig 6. Correlation between the combined misalignment parameter and the RMS of error of fit within pairs of topography maps before and after correcting for misalignment.Anterior and posterior maps were considered simultaneously in estimating misalignment components but the effect of correcting for misalignment was tested in (a) anterior and (b) posterior maps separately.
simultaneously. However, since anterior maps were expected to have higher accuracy com-pared to posterior maps (and hence lower noise levels), the two sets of maps were considered separately, leading to mean reductions in elevation differences from 4.58±1.84μm to 2.97±
1.29μm (mean reduction of 35.13%) in anterior maps, and from 11.40±4.05μm to 10.25±
3.89μm (mean reduction of 10.09%) in posterior maps. These results show that the relatively
Fig 7. Correlation between the combined misalignment parameter and the RMS of error of fit within pairs of topography maps before and after correcting for misalignment.In this exercise only anterior maps were considered through whole process of estimating and correcting for misalignment.
higher accuracy and the lower noise of anterior maps made the ICP algorithm more effective and the resulting improvement in repeatability more pronounced.
Column diagram plots showed that the misalignments (transformations determined by the ICP algorithm) between successive measurements had a normal distribution with an even dis-persion around zero values. Further, most of the misalignment components were not signifi-cantly different from zero except for z0, for which, the 95% limit of agreement (95% LoA) was
-3.22μm to 2.33μm, and was not high enough to have clinical significance. Additionally, the
overlap area ratio between the first and second measurements was 98.17±0.22% and 98.00± 0.20% for anterior and posterior surfaces after ICP process, respectively, which were quite high and represented the good repeatability of the Pentacam.
The errors of fit calculated at individual measurement points (i.e. the elevation difference between successive maps determined at each grid point) consistently grew from the corneal central region to the periphery. After the ICP correction of misalignment, the central area with smaller fit errors increased in size while the bigger values of fit errors in the periphery
remained. It also can be seen that posterior maps, while showing the same pattern of error growth from the central region to the periphery as anterior maps, always exhibited larger values of fit errors.
The more pronounced fit errors in peripheral areas compared to central areas and in poste-rior maps compared to anteposte-rior maps may have been caused by optical distortion due to aber-rations in the instrument’s measuring lens [17,23], and is expected to have affected the values of misalignment between measurements, as estimated by the ICP algorithm. It can therefore be argued that the accuracy of topographic data and the repeatability of VK maps could be improved by utilising only the central regions of anterior maps when estimating misalignment.
A new parameter has been developed to combine the effects of individual misalignment components and enable quantifiable assessment of the relationship between misalignment and data repeatability. The parameter considered the effects of individual components on an ideal-ised map with the average corneal dimensions in order to enable comparison between the effects of individual misalignment components and between the combined effects of whole components’sets. Using the values of this parameter, there was a clear correlation between misalignment and the results of the repeatability tests, although this correlation is thought to have been affected by the inevitable data noise. The results also showed the better accuracy of data in anterior maps relative to posterior maps as has been illustrated earlier in the study.
The CM enabled a comparative assessment of the effects of individual misalignment com-ponent. For cases involving the following individual misalignments; (1) x0= 1μm, (2) y0=
1μm, (3) z0= 1μm, (4)α= 1 min (1/60 degree), (5)β= 1 min, and (6)γ= 1 min, CM had
val-ues of 0.314μm, 0.322μm, 1.000μm, 0.734μm, 0.731μm and 0.004μm, respectively. These
results showed that translation along x and y axes led to similar overall misalignment effects and similar effects on repeatability, and the same was true for rotations around x and y axes. The study attempted to evaluate the effects of possible misalignment between successive corneal maps on the accuracy of topographic data. Although the misalignment values were small, and in most cases not statistically different from zero, they led to considerable reductions in data repeatability and could therefore have an effect on the topography data guiding clinical decisions. The study showed that while topography maps suffered from data noise, the central cornea and the anterior surface had better repeatability than the peripheral cornea and the pos-terior surface. The study showed that the ICP algorithm was successful in estimating and elimi-nating the effect of misalignment, leading to improved repeatability and hence more
successive maps should be eliminated in applications where topographic data is important for clinical decision making.
Acknowledgments
The authors thank Jia Chen from the Affiliated Eye Hospital of Wenzhou Medical University for data collection, and Charles Whitford from School of Engineering, University of Liverpool and Dr Giacomo Savini from Studio Oculistico d'Azeglio, Bologna, Italy, for technical assis-tance with the study.
Author Contributions
Conceived and designed the experiments: FJB JJW QMW PGD AE. Performed the experi-ments: FJB JJW JHH YY MLD LNL AYY. Analyzed the data: FJB JJW JHH YY MLD LNL AYY QMW PGD AE. Contributed reagents/materials/analysis tools: FJB JJW JHH YY MLD LNL AYY. Wrote the paper: FJB JJW JHH YY MLD LNL AYY QMW PGD AE.
References
1. Fatt I. Physiology of the eye: An introduction to the vegetative functions. London: Butterworths;. 1978:1–42.
2. Karabatsas CH, Cook SD, Figueiredo FC, Diamond JP, Easty DL. Surgical control of late postkerato-plasty astigmatism with or without the use of computerized video keratography: a prospective, random-ized study. Ophthalmology. 1998; 105(11):1999–2006. Epub 1998/11/18. S0161-6420(98)91115-0 [pii] doi:10.1016/S0161-6420(98)91115-0PMID:9818596.
3. Alessio G, Boscia F, La Tegola MG, Sborgia C. Topography-driven excimer laser for the retreatment of decentralized myopic photorefractive keratectomy. Ophthalmology. 2001; 108(9):1695–703. Epub 2001/09/06. S0161-6420(01)00706-0 [pii]. PMID:11535475.
4. Maeda N, Klyce S, Smolek M. Comparison of methods for detecting keratoconus using videokeratogra-phy. Arch Ophthalmol. 1995; 7(113):870–4.
5. Levy D, Hutchings H, Rouland JF, Guell J, Burillon C, Arne JL, et al. Videokeratographic anomalies in familial keratoconus. Ophthalmology. 2004; 111(5):867–74. Epub 2004/05/04. doi:10.1016/j.ophtha. 2003.12.024S0161-6420(03)01731-7 [pii]. PMID:15121361.
6. Szczotka LB. Clinical evaluation of a topographically based contact lens fitting software. Optom Vis Sci. 1997; 74(1):14–9. Epub 1997/01/01. PMID:9148262.
7. Bhatoa NS, Hau S, Ehrlich DP. A comparison of a topography-based rigid gas permeable contact lens design with a conventionally fitted lens in patients with keratoconus. Cont Lens Anterior Eye. 2010; 33 (3):128–35. Epub 2010/01/08. S1367-0484(09)00155-6 [pii] doi:10.1016/j.clae.2009.11.004PMID: 20053579.
8. Guler E, Yagci R, Akyol M, Arslanyilmaz Z, Balci M, Hepsen IF. Repeatability and reproducibility of Gali-lei measurements in normal keratoconic and postrefractive corneas. Cont Lens Anterior Eye. 2014; 37 (5):331–6. Epub 2014/06/19. doi:10.1016/j.clae.2014.04.004PMID:24938125.
9. Yang C, Gérard M. Object modelling by registration of multiple range images. Image and Vision Com-puting. 1992; 10(3):145–55.
10. Paul J B, Neil D M. Method for registration of 3-D shapes. IEEE Transactions on Pattern Analysis and Machine Intelligence. 1992; 14(2):239–56.
11. Kawamorita T, Uozato H, Kamiya K, Bax L, Tsutsui K, Aizawa D, et al. Repeatability, reproducibility, and agreement characteristics of rotating Scheimpflug photography and scanning-slit corneal topogra-phy for corneal power measurement. J Cataract Refract Surg. 2009; 35(1):127–33. Epub 2008/12/23. doi:10.1016/j.jcrs.2008.10.019PMID:19101435.
12. Miranda MA, Radhakrishnan H, O'Donnell C. Repeatability of corneal thickness measured using an Oculus Pentacam. Optom Vis Sci. 2009; 86(3):266–72. Epub 2009/02/14. doi:10.1097/OPX. 0b013e318196a737PMID:19214132.
13. Chen D, Lam AK. Intrasession and intersession repeatability of the Pentacam system on posterior cor-neal assessment in the normal human eye. J Cataract Refract Surg. 2007; 33(3):448–54. Epub 2007/ 02/27. doi:10.1016/j.jcrs.2006.11.008PMID:17321396.
Ophthalmology. 2006; 113(11):1918–26. Epub 2006/08/29. doi:10.1016/j.ophtha.2006.05.053PMID: 16935339.
15. Huang J, Ding X, Savini G, Pan C, Feng Y, Cheng D, et al. A Comparison between Scheimpflug imag-ing and optical coherence tomography in measurimag-ing corneal thickness. Ophthalmology. 2013; 120 (10):1951–8. Epub 2013/05/16. doi:10.1016/j.ophtha.2013.02.022PMID:23672973.
16. Guilbert E, Saad A, Grise-Dulac A, Gatinel D. Corneal thickness, curvature, and elevation readings in normal corneas: combined Placido-Scheimpflug system versus combined Placido-scanning-slit sys-tem. J Cataract Refract Surg. 2012; 38(7):1198–206. Epub 2012/06/26. doi:10.1016/j.jcrs.2012.01.033 PMID:22727289.
17. Bao F, Chen H, Yu Y, Yu J, Zhou S, Wang J, et al. Evaluation of the shape symmetry of bilateral normal corneas in a Chinese population. PLoS One. 2013; 8(8):e73412. Epub 2013/09/07. doi:10.1371/ journal.pone.0073412PMID:24009752; PubMed Central PMCID: PMC3757004.
18. Lackner B, Schmidinger G, Skorpik C. Validity and repeatability of anterior chamber depth measure-ments with Pentacam and Orbscan. Optom Vis Sci. 2005; 82(9):858–61. Epub 2005/09/29. PMID: 16189497.
19. Szymon. R, Marc. L. Efficient variants of the ICP algorithm. Proceedings of 3rd International Confer-ence on 3-D Digital Imaging and Modeling. 2001:145–52.
20. Alkhaldi W, Iskander DR, Zoubir AM. Model-order selection in Zernike polynomial expansion of corneal surfaces using the efficient detection criterion. IEEE Trans Biomed Eng. 2010; 57(10):2429–37. Epub 2010/07/14. doi:10.1109/TBME.2010.2050770PMID:20624703.
21. Schwiegerling J. Modal reconstruction methods with Zernike polynomials. J Refract Surg. 2005; 21(5): S552–7. PMID:16209460.
22. Buehl W, Stojanac D, Sacu S, Drexler W, Findl O. Comparison of three methods of measuring corneal thickness and anterior chamber depth. Am J Ophthalmol. 2006; 141(1):7–12. Epub 2006/01/03. doi: 10.1016/j.ajo.2005.08.048PMID:16386970.
23. Wang J, Elsheikh A, Davey P, Wang W, Bao F, Mottershead J. Corneal topography matching by itera-tive registration. Proc IMechE Part H: J Engineering in Medecine. 2014; 228(11):1154–67.
24. Franklin RJ, Morelande MR, Iskander DR, Collins MJ, Davis BA. Combining central and peripheral videokeratoscope maps to investigate total corneal topography. Eye Contact Lens. 2006; 32(1):27–32. PMID:16415690.
25. Read SA, Collins MJ, Carney LG, Franklin RJ. The topography of the central and peripheral cornea. Invest Ophthalmol Vis Sci. 2006; 47(4):1404–15. doi:10.1167/iovs.05-1181PMID:16565374. 26. Barsky BA, Klein SA, Garcia DD. Gaussian power with cylinder vector field representation for corneal