3Saint Louis University, Saint Louis, MO, USA
Received: 2 June 2008 – Published in Atmos. Chem. Phys. Discuss.: 1 July 2008 Revised: 1 October 2008 – Accepted: 8 October 2008 – Published: 11 December 2008
Abstract.This study investigates the improvement of ozone (O3) simulations in the Mexico City basin using a
three-dimensional variational (3DVAR) data assimilation system in meteorological simulations during the MCMA-2003 field measurement campaign. Meteorological simulations from the NCAR/Penn State mesoscale model (MM5) are used to drive photochemical simulations with the Comprehensive Air Quality Model with extensions (CAMx) during a four-day episode on 13–16 April 2003. The simulated wind cir-culation, temperature, and humidity fields in the basin with the data assimilation are found to be more consistent with the observations than those from the reference deterministic forecast. This leads to improved simulations of plume po-sition, peak O3 timing, and peak O3 concentrations in the
photochemical model. The improvement in O3simulations
is especially strong during the daytime. The results demon-strate the importance of applying data assimilation in mete-orological simulations for air quality studies in the Mexico City basin.
1 Introduction
Air pollution episodes are determined by a complicated inter-action among three factors: emissions of pollutants to the at-mosphere, chemical reactions, and meteorology (Banta et al., 2005). Meteorological conditions play a key role in air qual-ity forecast (Seaman, 2000; Solomon et al. 2000), which de-termine the dilution or accumulation of pollutant emissions and can also impact other key processes, such as chemical reaction rates. Past attempts to investigate photochemical
Correspondence to:N. Bei ([email protected])
sensitivity to meteorological uncertainty include adjoint sen-sitivity studies (Menut, 2003) and Monte Carlo simulations with randomly specified meteorological and photochemical variables (Hanna et al., 2001; Beekmann and Derognat, 2003). The impacts of realistic meteorological uncertain-ties on ozone pollution predictability in Houston and the sur-rounding area have been demonstrated recently by Zhang et al. (2007) through meteorological and photochemical ensem-ble forecasts.
In order to improve the accuracy of weather forecasts, data assimilation has been used operationally for meteorological modeling and prediction but seldom used for air quality mod-eling. Previous works aimed to improve the representation of meteorological fields have mostly focused on observa-tional nudging, which is one of the four-dimensional data assimilation (FDDA) schemes (see e.g. Stauffer et al., 1990, 1991; Grell et al., 1994; Stauffer and Seaman, 1994; Fast, 1995; Seaman, 2000). Nudging is a continuous assimila-tion method that relaxes the model state toward the observed state by adding artificial tendency terms to one or more of the prognostic equations based on the difference between the two states. When differences are computed directly using observations which are distributed non-uniformly in space and time, it is called “Obs-Nudging”. Several studies have demonstrated that the simulation of O3 is significantly
im-proved when the nudged meteorological fields are used in the chemical simulations (Barna and Lamb, 2000; Davakis et al., 2007; Lee et al., 2007). However, Lee et al. (2007) have also pointed out that the influence of the FDDA on the O3
con-centrations is not the same in all areas and the complexity of the terrain might affect the efficiency of the FDDA.
through the iterative solution of a prescribed cost function (Ide et al., 1997). The practical advantages of VAR systems over their predecessors include: 1) observations can easily be assimilated directly; 2) all observations are used simul-taneously; 3) asynoptic data can be assimilated near its va-lidity time. However, VAR data assimilation systems also have their weaknesses. First, the quality of the output anal-ysis depends crucially on the accuracy of prescribed errors for observations and background information. Second, the variational method allows for the inclusion of linearized dy-namical/physical processes, while in fact real errors in the numerical weather prediction (NWP) system may be highly nonlinear.
The main reason for using 3DVAR rather than 4DVAR is because 3DVAR is computationally cheaper to run since it does not require the tangent linear (TL) or the adjoint of the forecast model. 4DVAR can provide an improved analy-sis under certain situations, but 3DVAR can also achieve the same goal by using a rapidly updating cycle. Another ben-efit of 4DVAR is the use of flow-dependent background er-ror covariance, which may also be approximated in 3DVAR through grid transformations, anisotropic recursive filters and/or the use of ensemble information. The 3DVAR system provides an efficient training ground for crucial aspects of the data assimilation system because many of the algorithms used in 4DVAR are found in the much less computation-ally expensive 3DVAR system. These include observation operators, minimization, preconditioning, multivariate back-ground error specification and data assimilation diagnostics. 3DVAR has been widely used in operational weather fore-casting, although it has not been used in air quality studies.
The Mexico City Metropolitan Area (MCMA) is situated inside a basin at 2240 m altitude and 19◦N latitude and
is surrounded on three sides by mountains averaging over 3000 m a.s.l. The main opening of the basin is towards the Mexico Plateau to the north. To the southeast there is a gap in the mountains, referred to as the Chalco passage, which leads to significant gap winds. The combination of weak winds and numerous emission sources results in high levels of air pollution (Molina and Molina, 2002). Because of its com-plex topography, the meteorology of the MCMA depends on the interplay of the basin with the Mexican Plateau and the lower coastal areas. Both regional and synoptic-scale mete-orological conditions are important for understanding flows and dispersion within the Mexico City basin (Bossert, 1997). Fast and Zhong (1998) explored the important role of meteo-rological processes in producing the spatial variations in the ozone distributions within the Mexico City basin by using a mesoscale dynamics and dispersion modeling system. The thermally driven gap winds in the southeast of the basin play an important role in the formation of a convergence zone, which can further affect the surface air pollutant distributions in the basin (Doran and Zhong, 2000).
The complex wind circulation in the Mexico City basin have been analyzed in previous studies (see, e.g. Streit and
Guzman, 1996; Fast and Zhong, 1998; Jazcilevich et al., 2003). However, meteorological mesoscale model simu-lations and evaluations are inherently uncertain for cases with complex terrain and weak synoptic forcing. In addi-tion, the MCMA has an urban heat island effect with poten-tial impacts on the wind circulation in the basin (Jauregui, 1997). Bossert (1997), Wellens et al. (1994), and Williams et al. (1995) evaluated the local circulations produced by mesoscale models and the transport of pollutants simulated by dispersion models using data from a 1991 field campaign. Tie et al. (2007) used a newly developed regional chemi-cal/dynamical model (WRF-Chem) to study the formation of chemical oxidants, particularly ozone in Mexico City. As a major field study investigating the atmospheric chemistry of the MCMA, the MCMA-2003 campaign revealed impor-tant new insights into the meteorology, primary polluimpor-tant emissions, ambient secondary pollutant precursor concen-trations, photochemical oxidant production, and secondary aerosol particle formation in North America’s most popu-lated megacity (Molina et al., 2007). de Foy et al. (2005a) identified three episode types based on wind circulation pat-terns: “O3-South” (O3peak occurs in the south of the basin),
“Cold Surge” (cold northerlies sweep the basin atmosphere clean), and “O3-North” (O3peak occurs in the north of the
basin). This classification has provided a means of under-standing pollutant transport in the Mexico City basin as well as the basis for future meteorological and chemical analysis. de Foy et al. (2006a) further explored the different wind con-vergence patterns in the basin under different meteorologi-cal conditions. On the basin smeteorologi-cale, convergence zones form at the interface between southerly gap winds and northerly plateau flows. High resolution satellite-derived land surface parameters were coupled into the mesoscale simulations and led to improved meteorological simulations during a high O3
episode of MCMA-2003 (de Foy et al., 2006b). A study us-ing a mesocale meteorological model and a particle trajectory model indicated that the residence times of urban plumes in the basin are less than 12 h with little carry-over from day to day and little recirculation of air back into the basin (de Foy et al., 2006c).
The episode selected for this study is 13 to 16 of April 2003, which is the first “O3-South” episode during
Fig. 1. (a)MM5 domains (black, blue, red box) and radiosonde locations: Mexico City (MEX), Acapulco (ACAP), Veracruz (VER), Monterrey (MTY), Guadalajara (GUAD), Manzanillo (MANZ), and Mazatlan (MZT).(b)CAMx domain (indicated by the green box in Fig. 1a) and surface meteorological measurement locations in the Mexico City basin. The star represents the CENICA supersite. Crosses are surface meteorological stations of the UNAM-CCA high school network. Triangles are two temporary stations operated during the campaign. Multiplication signs are RAMA stations; locations indicated by red characters are the five selected stations used in Fig. 8. Squares are the National Meteorological Service surface stations. Contours in both panels represent terrain height.
inaccurate modeling of the timing of the surface winds in-crease and the wind shift due to the gap flow (such as on 14 and 16 of April). In addition to the atmospheric chemical measurements obtained during the MCMA-2003 campaign, there are meteorological observations, which have not been assimilated in the meteorological simulations yet. This pa-per attempts to examine the impact of assimilating both the routine and the additional meteorological observations on the modeled O3formation in the Mexico City basin by using the
MM5 3DVAR data assimilation system (Barker et al., 2004). The observations and modeling experiments are described in Sect. 2. The episode and its related studies are reviewed in Sect. 3. Section 4 describes the modeling results and compar-ison with observations, Sect. 5 presents a discussion, while the conclusions are given in Sect. 6.
2 Available observation and experiment descriptions
Both routine and additional meteorological observations dur-ing the MCMA-2003 campaign are used in this study. The routine observations include radiosondes at 6 sites (shown in Fig. 1a), surface observations with 1-h interval (not shown), and the surface observations of the Mexico City Ambient Air Monitoring Network (RAMA) (www.sma.df.gob.mx/simat). The regular soundings are launched at 12:00 UTC every day. The additional meteorological observations during MCMA-2003 used in this study are shown in Fig. 1b, which include radiosonde observations at the headquarters of the Mexican National Weather Service (GSMN) every 6 h, surface obser-vations at the National Center for Environmental Research and Training (CENICA) supersite, the automatic weather
stations (EHCA, indicated by SMN in Fig. 1b), 10 surface observation stations located in high schools throughout the MCMA (ENP-CCH), two temporary stations located at ININ (Instituto Nacional de Investigaciones Nucleares), and a mo-bile van deployed at Santa Ana Tlacotenco (SATL).
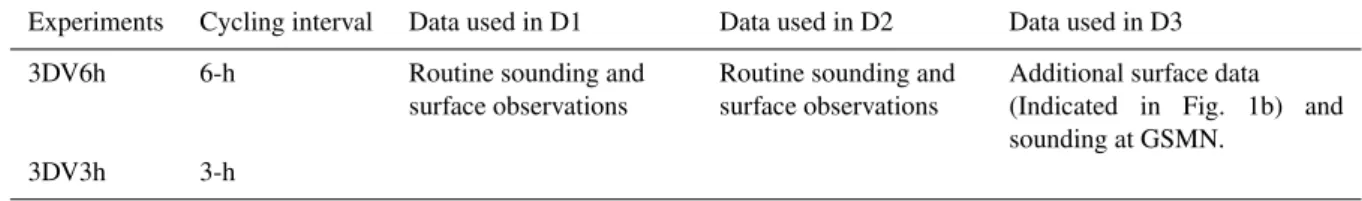
Table 1.Experiment descriptions
Experiments Cycling interval Data used in D1 Data used in D2 Data used in D3
3DV6h 6-h Routine sounding and surface observations
Routine sounding and surface observations
Additional surface data (Indicated in Fig. 1b) and sounding at GSMN.
3DV3h 3-h
way to produce the background error covariance in 3DVAR system. However, the background error covariance derived using the NMC method is stationary and isotropic, which does not reflect the flow dependent error information. This will affect the analysis results because the real background error covariance should be flow dependent. Future work will focus on the role of background error covariance formation in 3DVAR system and the possibility of obtaining them from ensemble forecasts. The assimilation time window used in 3DV6h and 3DV3h are 6-h and 3-h, respectively. The rest of the input set-ups for the three simulations are the same.
The CAMx model is designed to simulate air quality on urban and regional scales. It uses hourly meteorological out-put fields from the three MM5 simulations mentioned above, which include wind, temperature, water vapor, cloud/rain, land-use and vertical diffusivity. The hourly outputs of MM5 in domain 3 are used to drive the CAMx model to simulate the high O3 events during 13–16 April 2003. The first 5 h
of the MM5 output are excluded as spin-up period, therefore CAMx is initialized at 00:00 CDT every day and then inte-grated for 24 h. The CAMx model domain is similar to the MM5 domain 3, with four grids trimmed from each edge and 15 vertical layers corresponding to the lowest 15 layers in the MM5. The model set-up and the input data used for CAMx in this study is the same as described in Lei et al. (2007) except the meteorological fields. The emission input is con-structed based on the official MCMA emissions inventory for the year 2002 (CAM, 2004) as described in Lei et al. (2007). For all the experiments, the initial and boundary conditions for chemical fields are the same, since we only focus on the effects due to changes in the meteorological fields.
3 Overview of the episode on 13–16 April 2003
The episode on 13–16 April 2003 is one of the “O3-South”
episodes defined in de Foy et al. (2005). A detailed descrip-tion of the meteorological fields during this episode can be found in de Foy et al. (2006a, 2006c). During this period, an anticyclone moved from the eastern Pacific Ocean to Mex-ico, leading to subsidence over Mexico. At the same time, there are strong sea breezes developing under these condi-tions both along the Gulf of Mexico and the east coast of the Pacific Ocean, which are clearly indicated by the surface
convergence zone over Mexico. O3-South days have weak
synoptic forcing and a much clearer signature of terrain-induced flow. On the regional scale, a convergence zone is formed in the area where the sea breezes from the Pa-cific Ocean and the Gulf of Mexico meet. On the basin scale, the gap flow coming from the Chalco passage starts at 15:00 CDT and sweeps through the entire city by 22:00 CDT. Similar jets also exist through Toluca to the west and past Puebla on the east (de Foy et al., 2006a, c). The O3-South
days have high O3 peaks in the southwest area of Mexico
City, which is quite consistent with the convergence patterns.
4 Results
4.1 Influence of 3DVAR data assimilation on meteorologi-cal simulations
The simulated large-scale meteorological fields and synoptic patterns have been modified slightly due to the implementa-tion of the data assimilaimplementa-tion. For example, at 07:00 CDT and 13:00 CDT 16 April, the position of 500 hPa anticyclone in 3DV6h is more consistent with the GFS analysis compared with that in FCST (Fig. 2), which in turn leads to the simu-lated wind circulation over Mexico City in 3DV6h that is in better agreement with the GFS analysis fields (inner box in Fig. 2). The impact of 3DVAR data assimilation on meteoro-logical simulations is evaluated in the urban area of Mexico City in the following section.
Fig. 2. The 500 hPa geopotential heights, winds and temperature fields at 07:00 CDT and 13:00 CDT 16 April from the simulations of(a, b)FCST,(c, d)3DV6h, and(e, f)GFS analysis data. Black box inicates domain3 used in MM5.
The mixing layer height is an essential parameter in at-mospheric dispersion modeling, controlling the extent of the vertical mixing of pollutants near the surface. In our sim-ulations, we use the MRF (medium range forecast) bound-ary layer scheme (Hong and Pan, 1996), which diagnoses the mixing layer heights based on the stability class and the vertical profile of virtual potential temperature. Figure 4 il-lustrates the comparison of the modeled hourly mixing layer heights with the observed mixing layer heights diagnosed from the sounding observations at GSMN. Observed mix-ing layer heights are estimated usmix-ing the gradient method, identifying heights at which the vertical gradient of potential temperature exceeds a threshold of 2.5 K/km (de Foy et al., 2006c). Mixing layer heights calculated with the threshold method (de Foy et al., 2006c) are also displayed in Fig. 4. FCST generally underestimates the mixing layer heights, while 3DV6h overestimates the mixing layer heights but is in better agreement with the measurements in terms of tim-ing. The simulated nighttime mixing layer height in 3DV6h and 3DV3h are both higher than those of FCST, which is much more consistent with those measured by the tethered balloon flights, in which the mixing layer height is never lower than 200 m (Velasco et al., 2008). This is an inde-pendent data set used for evaluating the 3DVAR system. In
Fig. 3.The simulated soundings in(a, b)FCST,(c, d)3DV6h, and the observation(e.,f)in Mexico City at 13:00 CDT, 14 and 16 April. A full barb is 10 knots. Red and green curves represent temperature (◦C) and dew point temperature (◦C), respectively.
general, the simulated mixing heights in 3DV6h and 3DV3h do not differ significantly. The surface temperature increased during the daytime (see Fig. 5) when 3DVAR assimilation was used, which contributes to the increase in height of the mixing layer. The increase of horizontal convergence inside the basin also leads to the increase of vertical motion and mixing layer heights (see the analysis in Sect. 4.3).
The main features of the surface wind circulation dur-ing the “O3-South” episode include the weak drainage flows
Fig. 4.The modeled hourly mixing layer heights and observed (di-agnosed from the sounding observation) mixing layer heights at GSMN during 13–16 April 2003. See text for detail descriptions of the legend.
fields in the basin are noticeably modified due to data assim-ilation. A warm bias in the day and cool bias at night are simulated in 3DV3h compared to FCST, demonstrating more accurate temperature simulations through the 3DVAR sys-tem compared with the measurements. Although the wind fields in the northwest of the basin at 08:00 CDT are not well captured in both simulations (Fig. 5a, d, g), the tem-perature simulations have improved significantly in 3DV3h. At 14:00 CDT (Fig. 5b, e, h), upslope flows along the west-ern and southwest-ern slopes of the basin are slightly changed in 3DV3h, and the simulated maximum temperature in the basin is increased in 3DV3h, which decreases the bias between the model and observations. At 20:00 CDT (Fig. 5c, f, i), the strength of the gap flow and the position of the convergence line in the basin are better simulated in 3DV3h than those in FCST. However, neither of the simulations captures the down slope winds along the southern slope of the basin.
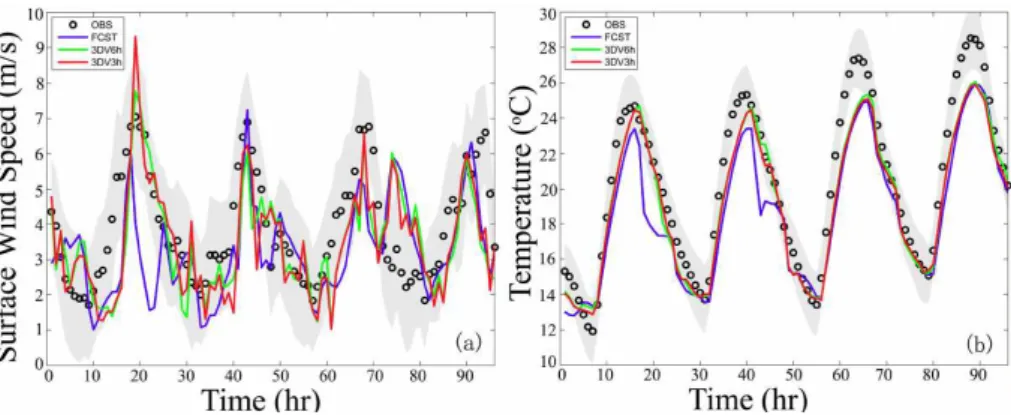
The time series of observed and modeled surface wind speed and temperature averaged over the 31 monitoring sites inside the Mexico City basin are depicted in Fig. 6. Through the use of data assimilation, the simulated averaged wind speeds during the morning hours have been improved on most of the days (such as 13, 14, and 16 April). The sim-ulated averaged temperature is enhanced in midday during the entire episode, especially on 13 and 14 April, which is closer to the observations. Nevertheless, the modeled max-imum temperature appears to be underestimated compared with measurements on average.
We further compare the model results with observations in statistical sense. According to the study by Fox (1981) and Willmott (1982), the average difference between predictions and measurements can be described by the root mean square
Fig. 5.Surface winds (bar) and temperature (contours ina–f, dots in g–i) in the Mexico City basin valid at 08:00, 14:00, and 20:00 CDT 16 April for simulations in(a–c)FCST and(d–f)3DV3h and(g–i) observations. Color dots in(g–i)represent temperature observa-tions. Orange contours in(a–f)and gray contours in(g–i)denote terrain. The thick black lines shown in(c),(f), and(i)indicate the convergence line. The domain showing here is the inner most do-main of Fig. 1b.
error (RMSE) defined in Eq. (1):
RMSE=
"
1 N
N
X
i=1
(pi−oi)2
#1/2
(1)
wherepi andoi are the predicted and observed variables, re-spectively.Nis the number of cases. The decrease of RMSE implies the improvement of the model performance.
Willmott (1981, 1982) and Willmott and Wicks (1980) have also proposed an “index of agreement” (IOA) to de-scribe the relative differences between model and observa-tion. The index IOA is defined as
IOA=1−
N
P
i=1
(pi−oi)2 N
P
i=1
(|pi− ¯o| + |oi− ¯o|)2
(2)
Fig. 7. The RMSE and index of agreement (IOA) calculated in FCST, 3DV6h, and 3DV3h against the measurements in terms of surface wind speed and temperature at the surface monitoring sites during 13–16 April 2003.
1, with 1 indicating perfect agreement between model and observation. The IOA is intended to be a descriptive mea-sure, and it is a relative and bounded measure. We use both RMSE and IOA to examine the performance of the differ-ent simulations respond to wind and temperature fields on the basin scale during this entire episode. Figure 7 shows the RMSE and IOA calculated in FCST, 3DV6h, 3DV3h, and the measurements in terms of wind speed and temperature. The wind speed (temperature) simulations in 3DV6h yield bet-ter results in bet-terms of RMSE at 17 (30) of the 31 monitors (Fig. 7a, b) and IOA at 21 (30) of the 31 monitors (Fig. 7c, d). Consequently, the basin scale wind and temperature sim-ulations at most stations are improved by using the 3DVAR
data assimilation, especially with regard to the temperature fields. In general, the results from 3DV6h and 3DV3h are consistently better than those of FCST. In addition, 3DV3h produce better wind speed simulations than 3DV6h, but the simulated temperature in 3DV6h is slightly better than those of 3DV3h.
4.2 Influence of 3DVAR data assimilation on ozone simu-lations
The O3simulations driven by the three different
Fig. 8.Temporal evolutions of simulated (solid line) and observed (dots) O3concentrations in the Mexico City basin averaged over the
19 sites of RAMA network and the individual temporal evolution of 5 selected stations (TLA, XAL, MER, PED, and CES, shown in Fig. 1b). Shading area in(a)indicates the standard deviation of the observed ozone.
Figure 8 displays the diurnal cycle of observed O3and
simu-lated O3averaged over the 19 sites of RAMA network and at
the five selected individual stations. The five selected stations are TLA, XAL, MER, PED, and CES, respectively (shown in Fig. 1b), representing different areas inside the Mexico City basin. In general, except for 15 April, the averaged simulated O3concentrations at peak time in both 3DV6h and 3DV3h
show significantly improved agreement with the measure-ment from RAMA network when using 3DVAR data assim-ilation. The improvement of peak time O3 concentrations
due to the data assimilation on most of the days is more than 20 ppb. The peak timing of simulated O3 concentrations in
3DV6h and 3DV3h are both shifted later on 13 and 14 April, which is more consistent with the observations. The O3
sim-ulation in 3DV3h is generally better than that in 3DV6h, in-dicating that decreasing the cycling interval in the data as-similation has a positive effect on producing more accurate meteorological simulations. The improvement of peak O3
concentration at the selected individual monitoring stations (Fig. 8b–e) is more noticeable. The variations in the simu-lated maximum O3concentrations at some individual station
can be up to 70 ppb and the O3peak time shift can also reach
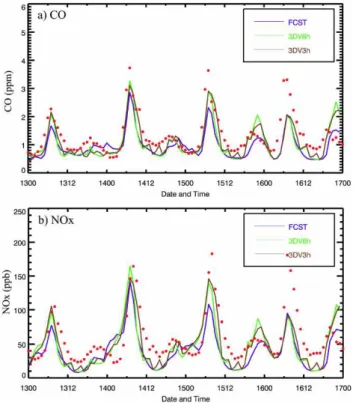
3 h (such as at station PED on 13 and 14 April). Figure 9 shows the observed and simulated time evolution of NOxand
CO during the same period. They are both improved through using 3DVAR data assimilation, which is consistent with the result of the ozone simulation.
Besides the improvement in peak O3, the position of
the outflow plumes are also altered due to changes in the wind and temperature fields caused by data assimilation.
Fig. 9.Temporal evolutions of simulated (solid line) and observed (dots) CO and NOxconcentrations in the Mexico City basin
aver-aged over the 19 sites of RAMA network.
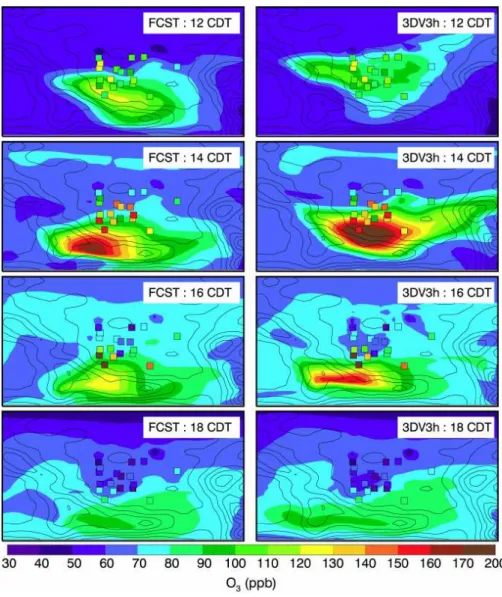
Figure 10 shows the bi-hourly horizontal distributions of O3
from 12:00 CDT to 18:00 CDT on 16 April. The modified meteorological fields change not only the horizontal distri-bution patterns of O3but also the position of the maximum
concentration area. The position of the plume, especially the high O3concentration area, is significantly improved in
com-parison with observations. The simulated high O3 area is
larger in 3DV3h and also displaced to the northeast, which is more consistent with measurements. On 14 April the simu-lated high O3area is smaller and located further northeast in
3DV3h (figure not shown), which is in better agreement with measurements generally.
According to the statistical evaluation methods introduced in Sect. 4.1, we employ the same indices to evaluate the per-formance of the different O3simulations at different
monitor-ing stations. Figure 11 provides the RMSE of simulated O3
in FCST, 3DV6h, and 3DV3h against the RAMA measure-ments. Evaluations are conducted during the entire episode and during the daytime (06:00 a.m. to 17:00 p.m.) hours of the episode. CAMx driven by the meteorological fields with the data assimilation presents better O3simulations in terms
of RMSE at 16 of the 19 monitors (Fig. 11a, b) and better IOA at 16 of the 19 monitors (not shown). The improve-ments are especially noticeable during the daytime. For ex-ample, the maximum reduction in RMSE of O3due to the
Fig. 10.Horizontal distributions of simulated (colored contours) O3concentrations in FCST and 3DV3h versus the measurements (colored
squares) from RAMA in the Mexico City basin between 12:00 to 18:00 CDT on 16 April 2003.
which can be explained by the improvements in both wind and temperature simulations. Several possible reasons might contribute to smaller reductions in RMSE of O3on 15 April,
such as the use of static background errors in the 3DVAR system, the quality and location of additional observations (Morss and Emanuel, 2002) and the uncertainties in emis-sion sources.
4.3 Link between meteorological fields and ozone distribu-tions
It has been known that the O3distribution in the Mexico City
basin is closely related to vertical motions caused by the con-vergence within the basin, recirculation patterns associated with venting and entrainment processes, vertical wind shears, and wind speeds aloft (e.g. Fast and Zhong, 1998; Jazcilevich et al., 2003; de Foy et al., 2006a, c). According to the results
presented in Sect. 4.2 (Fig. 8a), the simulated magnitude of peak O3concentrations over the Mexico City basin are lower
on the 13 and 14 of April but higher on 16 of April when the data assimilation system is adopted in the meteorologi-cal simulation. The simulated O3temporal evolutions during
these days are more consistent with the measurements. The results on 16 April are employed as an example to explain the influence of meteorological fields on O3 distributions.
Fig. 11. The RMSE calculated for FCST (blue), 3DV6h (green), and 3DV3h (brown) against the measurements in terms of O3
con-centrations at 19 RAMA monitors. (a)is calculated over entire episode and(b)is calculated over the daytime of the entire episode.
weaker in 3DV3h, but the gap winds occur earlier in 3DV3h. Along with the build-up of local emissions, the magnitude of the peak O3is higher and the peak O3area is pushed
fur-ther north in 3DV3h compared to FCST. In the late afternoon (Fig. 12e and f), the upslope winds along the western basin and the gap flow are both stronger in 3DV3h. Thus ozone area in 3DV3h is extended westward and moved northward compared to that in FCST.
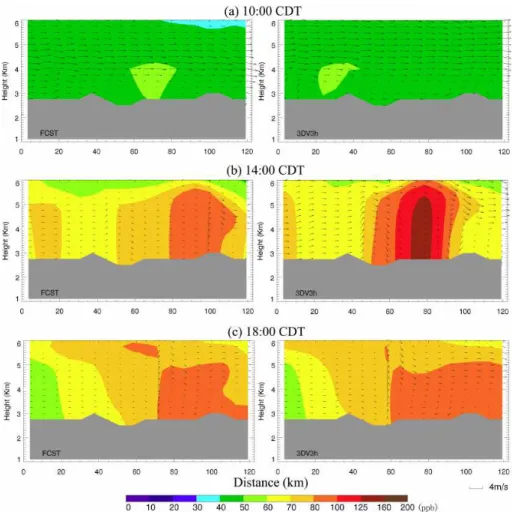
Since the southerly gap flow and the northerly plateau-to-basin winds are important to the accumulation and ven-tilation of pollutants in the Mexico City basin (Doran and Zhong, 2000; de Foy et al., 2006a, c), we further analyze the vertical section of the winds and the O3concentrations along
the cross section from northwest to southeast of the basin (the position of the cross section shown in Fig. 12). In general, as the gap flow through the Chalco passage meets the northerly
Fig. 12. The simulated surface winds in FCST and 3DV3h over the Mexico City basin from 10:00 CDT to 18:00 CDT on 16 April 2003. Orange contours denote terrain height. Line AB represents the position of the cross section shown in Fig. 13.
flow from the Mexico Plateau, there is a convergence zone and the vertical mixing is enhanced over the basin. The pol-lutants produced in the basin are then transported aloft and southwards by the northerly flow. In the morning (Fig. 13a), the simulated gap flow through the Chalco passage is in-creased in 3DV3h, while the upper level winds over the mix-ing layer is slightly weakened in 3DV3h, leadmix-ing to more accumulation of pollutants in the basin. In the early after-noon (Fig. 13b), the horizontal convergence in 3DV3h is much stronger due to the increased gap flow and northerly winds leading to higher O3 concentrations over the basin.
Fig. 13. Vertical distributions of winds and O3concentrations along the cross section (shown in Fig. 12) at 10:00 CDT, 14:00 CDT and
18:00 CDT, 16 April 2003, simulated in FCST and 3DV3h, respectively.
The situation on 14 April is different from 16 April (fig-ure not shown). In the morning, besides the horizontal convergence, the vertical mixing and the upper level northerly flow are both stronger in 3DV3h, which result in stronger ventilation in the basin in 3DV3h. In the early after-noon, along with the increased southward and eastward up-slope winds, the gap winds are decreased in 3DV3h. Mean-while, the vertical mixing and the upper level outflow are enhanced in 3DV3h, and thus the peak ozone area has been pushed further east but at lower concentrations. In late af-ternoon, the horizontal convergence is slightly stronger in 3DV3h because of the increased southerly down slope winds, gap winds and northerly winds. The vertical mixing and the upper winds are both stronger in 3DV3h. Overall, the mag-nitude of the maximum O3concentration is similar between
3DV3h and FCST, but its distribution in both the vertical and the horizontal are different because of variations in the dis-persion strength.
5 Discussions
As the essential inputs for air-quality models, meteorologi-cal fields strongly influence the evolution of emissions and chemical species through many atmospheric processes, in-cluding horizontal and vertical transport, turbulent mixing, convection and lightning-induced generation of nitrogen ox-ides (NOx), and both dry and wet deposition to the surface.
The rates at which secondary species form and certain chem-ical reactions take place are affected directly by the relative humidity, solar energy, temperature and the presence of liq-uid water (clouds) (Seaman, 2000). Data assimilation aims at accurate re-analysis, estimation and prediction of an un-known, true state by merging observed information into a model. The goal of using data assimilation in numerical weather prediction is to improve the simulated wind transport by improving the model initial conditions. 3DVAR has been extensively used in the meteorological community, but not in air quality modeling.
present study. However, simulations are still occasionally unsuccessful compared with observations. One of the pos-sible reasons is the use of static background errors in the 3DVAR system, which does not reflect the flow-dependent background error covariance. An ensemble-based back-ground error covariance will be employed in our next study. Additionally, the intrinsic predictability of the numerical weather prediction might also contribute to the failure of the improvement for meteorological simulations. The ini-tial error and model error inevitably bring about uncertain-ties in meteorological simulations and the initial error growth is also strongly nonlinear. Recent studies (Bei and Zhang, 2007; Tribbia and Baumhefner, 2004) on predictability sug-gest that, while there is significant room to improve forecast skill by improving forecast models and initial conditions, both mesoscale and large scale predictability are inherently limited. Nevertheless, the ensemble forecast approach can provide a probabilistic guidance for reducing uncertainties in meteorological simulations.
Independent verification is an effective way to examine a data assimilation system. We did not have sufficient data to carry out a complete data withholding experiment, but com-parisons of the mixing layer heights with tethersonde obser-vations (Velasco et al., 2008) have provided an independent evaluation of model improvement in terms of a variable that is important for air quality simulations.
6 Conclusions
This study investigates the effects of using a 3DVAR data assimilation system in meteorological modeling to improve O3simulations in the Mexico City basin during the
MCMA-2003 campaign. Both routine and additional meteorologi-cal observations during the campaign have been assimilated into the meteorological model during the episode of 13–16 April 2003. The simulated large-scale meteorological fields and synoptic patterns over Mexico City have been modified slightly due to the implementation of the data assimilation. The simulated wind circulation, temperature, and humidity fields in the basin have been improved due to data assimi-lation. As a result, the simulated position of the plume, the magnitude of peak O3, and the peak O3timing have also
im-proved significantly on most of the days. The improvement in O3simulations is especially prominent during the daytime.
The results clearly demonstrate the importance of applying data assimilation in meteorological simulations of air quality in the Mexico City basin.
Certain days do not show as much improvement in air quality simulations as some others. One possible explanation is the use of static background errors in the 3DVAR system, which does not reflect the flow-dependent background error covariance. We plan to use the ensemble-based background error covariance in the MM5 3DVAR system to evaluate the effect of hybrid 3DVAR data assimilation (Hamill and
Sny-der, 2000) in our future study. In addition, the quality and location of additional observations can also affect the results using the 3DVAR system (Morss and Emanuel, 2002).
Since this work focuses only on one episode, comparisons between the simulations with and without data assimilation during a longer period are also necessary. In addition, the surface observations used in this study are limited to the basin scale. The effect of using 3DVAR data assimilation can be better discerned if there are more available obser-vational data over a wider area within the model domain. We plan to apply this simulation to the larger data set ob-tained from MCMA-2006/MILAGRO Campaign in Mexico City (Molina et al., 2008).
Acknowledgements. The authors gratefully acknowledge financial support from the US National Science Foundation (ATM-0528227 and ATM-511803) and the Mexican Metropolitan Environmental Commission. We would like to thank Zhiyong Meng at Texas A&M University for her help in the implementation of MM5 3DVAR system. Acknowledgment is also made to the National Center for Atmospheric Research, which is sponsored by the National Science Foundation, for the computing time used in this research.
Edited by: C. E. Kolb
References
Banta, R. M., Senff, C. J., Nielsen-Gammon, J., et al.: A bad air day in Houston, Bull. Am. Meteorol. Soc., 86, 657–669, 2005. Barker, D. M., Huang, W., Guo, Y.-R., Bourgeois, A. J., and Xiao,
Q. N.: A three-dimensional variational data assimilation sys-tem for MM5: Implementation and initial results, Mon. Weather Rev., 132, 897–914, 2004.
Barna, M. and Lamb, B.: Improving ozone modeling in regions of complex terrain using observational nudging in a prognostic meteorological model, Atmos. Environ., 34, 4889–4906, 2000. Bei, N. and Zhang, F.: Impacts of initial condition errors on
mesoscale predictability of heavy precipitation along the Mei-Yu front of China, Q. J. R. Meteorol. Soc., 133, 83–99, 2007. Bossert, J. E.: An investigation of flow regimes affecting the
Mex-ico City region, J. Appl. Meteorol., 36, 119–140, 1997. Beekmann, M. and Derognat, C.: Monte Carlo uncertainty
anal-ysis of a regional-scale chemistry model constrained by mea-surements from the Atmospheric Pollution Over the Paris Area (ESQUIF) campaign, J. Geophys. Res., 108, 8559, doi:10.1029/2003JD003391, 2003.
CAM (Comision Ambiental Metropolitana): Inventario de Emi-siones 2002 de la Zona Metropolitana del Valle de Mexico, 2004. de Foy, B., Caetano, E., Maga˜na, V., Zit´acuaro, A., C´ardenas, B., Retama, A., Ramos, R., Molina, L. T., and Molina, M. J.: Mexico City basin wind circulation during the MCMA-2003 field cam-paign, Atmos. Chem. Phys., 5, 2267–2288, 2005,
http://www.atmos-chem-phys.net/5/2267/2005/.
Dudhia, J.: A nonhydrostatic version of the Penn State-NCAR Mesoscale Model: Validation tests and simulation of an Atlantic cyclone and cold front, Mon. Weather Rev., 121, 1493–1513, 1993.
ENVIRON: User’s Guide Comprehensive Air Quality Model with Extension (CAMx) Version 4.31, ENVIRON International Cor-poration, Novato, online: http://www.camx.com, California, 2006.
Fast, J. D.: Mesoscale modeling and four-dimensional data assim-ilation in areas of highly complex terrain, J. Appl. Meteor., 34, 2762–2782, 1995.
Fast, J. D. and Zhong, S.: Meteorological factors associated with inhomogeneous ozone concentrations within the Mexico City basin, J. Geophys. Res., 103, 18 927–18 946, 1998.
Fox, D. G.: Judging air quality model performance, Bull. Am. Me-teorol. Sol., 62, 599–609, 1981.
Hamill, T. M. and Snyder, C.: A hybrid ensemble Kalman filter – 3-D variational analysis scheme, Mon. Weather Rev., 128, 2905– 2919, 2000.
Hanna, S. R., Lu, Z. G., Frey, H. C., Wheeler, N., Vukovich, J., Arunachalam, S., Fernau, M., and Hansen, D. A.: Uncertainties in predicted ozone concentrations due to input uncertainties for the UAM-V photochemical grid model applied to the July 1995 OTAG domain, Atmos. Environ., 35, 891–903, 2001.
Hong, S.-Y. and Pan, H.-L.: Nonlocal boundary layer vertical diffu-sion in a medium-range forecast model, Mon. Weather Rev., 124, 2322–2339, 1996.
Ide, K., Courtier, P., Ghil, M., and Lorenc, A. C.: Unified notation for data assimilation: Operational, sequential and variational, J. Met. Soc. Japan, 75, 181–189, 1997.
Jazcilevich, A. D., Garcia, A. R., and Ruiz-Suarez, L. G.: A study of air flow patterns affecting pollutant concentrations in the Central Region of Mexico, Atmos. Environ., 37, 183–193, 2003. Jauregui, E.: Heat island development in Mexico City, Atmos.
En-viron., 31, 3821–3831, 1997.
Kalnay, E., Kanamitsu, M., and Baker, W. E.: Global numeri-cal weather prediction at the national-meteoroginumeri-cal-center, Bull. Am. Meteorol. Sol., 71, 1410–1428, 1990.
Lei, W., de Foy, B., Zavala, M., Volkamer, R., and Molina, L. T.: Characterizing ozone production in the Mexico City Metropoli-tan Area: a case study using a chemical transport model, Atmos. Chem. Phys., 7, 1347–1366, 2007,
http://www.atmos-chem-phys.net/7/1347/2007/.
http://www.atmos-chem-phys.net/7/2447/2007/.
Molina, L. T., Madronich, S., Gaffney, J. S., and Singh, H. B.: Overview of MILAGRO/INTEX-B Campaign, IGAC Newslet-ter, 38, 2–15, 2008.
Morss, R. E. and Emanuel, K. A.: Influence of added observations on analysis and forecast errors: Results from idealized systems, Quart. J. Roy. Meteor. Soc., 128, 285–322, 2002.
Parrish, D. F. and Derber, J. C.: The National Meteorological Center’s spectral statistical-interpolation analysis system, Mon. Weather Rev., 120, 1747–1763, 1992.
Seaman, N. L.: Meteorological modeling for air-quality assess-ments, Atmos. Environ., 34, 2231–2259, 2000.
Solomon, P., Cowling, E., Hidy, G., and Furiness, C.: Compari-son of scientific findings from major ozone field studies in North America and Europe, Atmos. Environ., 34, 1885–1920, 2000. Stauffer, D. R. and Seaman, N. L.: Use of four-dimensional data
assimilation in a limited-area mesoscale model – Part 1: Experi-ments with synoptic-scale data, Mon. Weather Rev., 118, 1250– 1277, 1990.
Stauffer, D. R. and Seaman, N. L.: Use of four-dimensional data assimilation in a limited-area mesoscale model – Part 2: Effects of data assimilation within the planetary boundary layer, Mon. Weather Rev., 119, 734–754, 1991.
Stauffer, D. R. and Seaman, N. L.: Multiscale 4-dimensional data assimilation, J. Appl. Meteorol., 33, 416–434, 1994.
Streit, G. E. and Guzman, F.: Mexico City air quality: Progress of an international collaborative project to define air quality man-agement options, Atmos. Environ., 30, 723–733, 1996.
Tie, X., Madronich, S., Li, G., Ying, Zh., Zhang, R., Garcia, A. R., Lee-Taylor, J., and Liu, Y.: Characterizations of chemical oxidants in Mexico City: A regional chemical dynamical model (WRF-Chem) study, Atmos. Environ., 41, 1989–2008, 2007. Tribbia, J. J. and Baumhefner, D. P.: Scale interactions and
at-mospheric predictability: an updated perspective, Mon. Weather Rev., 132, 703–713, 2004.
Velasco, E., M´arquez, C., Bueno, E., Bernab´e, R. M., S´anchez, A., Fentanes, O., W¨ohrnschimmel, H., C´ardenas, B., Kamilla, A., Wakamatsu, S., and Molina, L. T.: Vertical distribution of ozone and VOCs in the low boundary layer of Mexico City, Atmos. Chem. Phys., 8, 3061–3079, 2008,
http://www.atmos-chem-phys.net/8/3061/2008/.
wind fields in Mexico City, in: Second International Conference on Air Pollution, Computational Mechanics Publ., Barcelona, Spain, 27–28, 1994.
Williams, M. D., Brown, M. J., Cruz, X., Sosa, G., and Streit, G.: Development and testing of meteorology and air dispersion mod-els for Mexico City, Atmos. Environ., 29, 2929–2960, 1995. Willmott, C. J.: On the validation of models, Phys. Geogr., 2, 184–
194, 1981.
Willmott, C. J.: On the climatic optimization of the tilt and azimuth of flat-plate solar collectors, Sol. Energy, 28, 205–216, 1982.
Willmott, C. J. and Wicks, D. E.: An empirical method for the spatial interpolation of monthly precipitation within California, Phys. Geogr., 1, 59–73, 1980.