Submitted 24 April 2015
Accepted 21 August 2015
Published24 September 2015
Corresponding author Caitlin S. Pepperell,
Academic editor Tara Smith
Additional Information and Declarations can be found on page 17
DOI10.7717/peerj.1237
Copyright 2015 Ackley et al.
Distributed under
Creative Commons CC-BY 4.0
OPEN ACCESS
Modeling historical tuberculosis
epidemics among Canadian First
Nations: e
ff
ects of malnutrition and
genetic variation
Sarah F. Ackley1,2, Fengchen Liu1, Travis C. Porco1,2and Caitlin S. Pepperell3
1Department of Epidemiology and Biostatistics, University of California San Francisco, San Francisco, CA, USA
2Proctor Foundation, University of California San Francisco, San Francisco, CA, USA 3Departments of Medicine (Infectious Diseases) and Medical Microbiology and Immunology,
University of Wisconsin Madison, Madison, WI, USA
ABSTRACT
Late 19th century epidemics of tuberculosis (TB) in Western Canadian First Nations resulted in peak TB mortality rates more than six times the highest rates recorded in Europe. Using a mathematical modeling approach and historical TB mortality time series, we investigate potential causes of high TB mortality and rapid epidemic decline in First Nations from 1885 to 1940. We explore two potential causes of dramatic epidemic dynamics observed in this setting: first, we explore effects of famine prior to 1900 on both TB and population dynamics. Malnutrition is recognized as an individual-level risk factor for TB progression and mortality; its population-level effects on TB epidemics have not been explored previously. Second, we explore effects of heterogeneity in susceptibility to TB in two ways: modeling heterogeneity in susceptibility to infection, and heterogeneity in risk of developing disease once infected. Our results indicate that models lacking famine-related changes in TB parameters or heterogeneity result in an implausibly poor fit to both the TB mortality time series and census data; the inclusion of these features allows for the characteristic decline and rise in population observed in First Nations during this time period and confers improved fits to TB mortality data.
Subjects Mathematical Biology, Epidemiology, Infectious Diseases, Public Health Keywords Tuberculosis, Mathematical model, First Nations, Malnutrition, Genetic predisposition to disease, Epidemics
INTRODUCTION
In the late 19th and early 20th centuries, large-scale epidemics of tuberculosis (TB) swept through First Nations communities in Western Canada (Ferguson, 1928;Lux, 2001;
Mathematical models have been fit to TB mortality time series data from other settings (Murray & Salomon, 1998;Dye et al., 1998;Vynnycky & Fine, 1999). Historical data from the late 19th and early 20th centuries from First Nations communities have not, however, been extensively explored using modeling techniques (Clark & Cameron, 2009). Compartmental models have been used previously to estimate and predict future trends in annual risk of infection with data dating back to 1926 (Clark & Vynnycky, 2004;Clark &
Cameron, 2009). Data from these epidemics provide a unique opportunity to observe TB
dynamics in the early years of an epidemic: while TB mortality time series data were not collected until about 100 years after the start of the epidemics in Europe, data from First Nations communities are available within one to two decades of the epidemic start times as determined by historical accounts (Daschuk & Hackett, 2006).
It has been proposed that malnutrition (Daschuk & Hackett, 2006) and crowding
(Ferguson, 1928;Lux, 2001) played major roles in creating and maintaining high TB
mortalities in First Nations communities during this time period. Early observers also speculated about the role the TB epidemic played in altering the composition of these populations, by increasing relative proportions of individuals with intrinsic resistance to the disease (Ferguson, 1928).
Some aspects of secular TB trends in other settings are unexplained and have attracted research interest. For example, TB mortality declined in North America and Europe prior to the availability of effective chemotherapy (McKeown & Record, 1962;Vynnycky & Fine, 1999). Possible explanations for the decline in TB mortality around the turn of the 20th century in Europe include public health interventions and improvements in housing and nutrition (McKeown & Record, 1962;Szreter, 1988;Mitchell, 1992). Models that account for historical changes in crowding can successfully explain the historical decline in Europe (Vynnycky & Fine, 1999). However, unlike Europe over the course of the 20th century, housing densities and institutionalization of First Nations communities increased as the late 19th century TB epidemic took off(Milloy, 1999;Lux, 2001). Crowding is in fact still a problem in First Nations communities (Clark, Riben & Nowgesic, 2002;Larcombe et al., 2011). It is therefore unlikely that the sharp decline in TB mortality observed in the early 20th century can be explained by improving living conditions.
Building upon previously published TB models (ReVelle, Lynn & Feldmann, 1967;
Blower et al., 1995;Dye et al., 1998;Vynnycky & Fine, 1999), we simulate TB epidemics in Western Canadian First Nations at the turn of the 20th century. Based on the history of First Nations peoples in this region, we propose additional model features not present in previously published TB models: first, we propose that severe famine in the late nineteenth century may have led to time-varying model parameters as the severity of the famine eased in the 20th century (Lux, 2001;Daschuk & Hackett, 2006). Specifically, we allow the following model parameters to be time varying: TB mortality rates, TB progression rates, protective immunity to TB, as well as birth and non-TB death rates.
increased susceptibility to infection withMycobacterium tuberculosis(M. tuberculosis). Over the course of the epidemic, this fraction decreases, as individuals with greater susceptibility are less likely to produce offspring. In the second model—the adaptive immunity model—a fraction of the starting population has a higher risk of TB progression following infection withM. tuberculosis. Again, over the course of the epidemic, this fraction decreases, as individuals with greater susceptibility are less likely to produce offspring.
Using historical mortality data from 1885 to 1940 and census data from 1883 to 1939 from First Nations communities in Saskatchewan, Canada, we compare TB models with time-varying parameters and models with genetic heterogeneity to a “classical” TB model, which does not include these features. Fitting models to the rarely observed takeoffpoint of severe TB epidemics presents a unique opportunity to gain insight into fundamental features of TB transmission dynamics in this and other settings. TB is a global public health emergency, and it remains a significant challenge to the health and well-being of Canadian First Nations (Canadian Thoracic Society and the Public Health Agency of Canada, 2013). A better understanding of epidemic dynamics is needed to address this challenge to global public health.
MATERIALS AND METHODS
Data
Data analyzed here were completely de-identified (no geographic identifiers below the level of province) and aggregated prior to the study. The original data sources are described in (Pepperell et al., 2010). We included TB mortality data from 7 First Nations communities in Saskatchewan, Canada. Data were available from 3 communities between 1885 and 1940, and from 4 communities between 1897 and 1940. The data from 1885 to 1940 were aggregated into one group and the data from 1897 to 1940 were aggregated into a second group. Within these groupings, communities were in close proximity and with similar dynamics, as described elsewhere (Pepperell et al., 2010). Canadian Census reports and Indian Affairs Annual Reports of census were included for years from 1883 to 1940 for which community level data were available for all reserves in a cluster (Library and Archives
Canada, 2014).Library and Archives Canada (2014)provided contemporary birth rate data
for these and similar communities in the area (Lux, 2001).
Natural history of TB
Of individuals who develop active disease, a fraction develops smear-positive disease, which accounts for the majority of transmission; the remaining individuals develop smear-negative disease, which includes less-infectious forms of pulmonary disease as well as extra-pulmonary disease (Narain, 1980). Slightly more than half of individuals develop smear-positive (infectious) disease (Blower et al., 1995;Aparicio & Castillo-Chavez, 2009). A small fraction of active cases recover naturally; however, these individuals can relapse due to reactivation (Tiemersma et al., 2011). In the absence of treatment, the average duration of TB from onset to death or self-cure is about 3 years (Tiemersma et al., 2011).
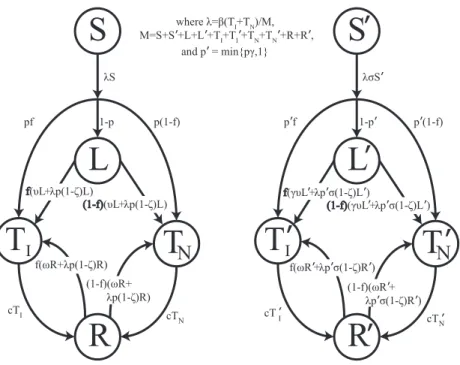
Mathematically, we represent the course of TB according toFig. 1. We distinguish the following non-TB state and TB states: (1) uninfected individuals, (2) latently-infected individuals who have been infected with TB but are asymptomatic and non-infectious, (3) infectious active disease (pulmonary, smear-positive) in which individuals are symptomatic and at a greatly increased risk of death due to disease, (4) non-infectious active disease (pulmonary but smear-negative or extra-pulmonary) in which individuals are symptomatic and at an increased risk of death due to disease, and (5) individuals who recover naturally from active disease and may progress to active disease again. Unlike other TB models, no states involving treatment or recovery following chemotherapy are necessary since there was no chemotherapy available prior to the demonstration of efficacy of streptomycin against tuberculosis during the mid-1940s (Youmans & McCarter, 2011;
Hinshaw, Feldman & Pfuetze, 1946).
It has been suggested that the sharp TB dynamics observed in First Nations reserves around 1900 are due to heterogeneity in susceptibility that existed at the initiation of the epidemic: that is, mortalities declined as the proportion of the population composed of highly susceptible individuals shrank (Ferguson, 1928;Lux, 2001). In TB endemic settings, the disease has its severest impacts on very young children and individuals of childbearing age (Wood et al., 2011). This suggests that TB has the potential to impose strong selection on human evolution. There is evidence to suggest that people vary in their susceptibility to TB, but the mechanism by which some individuals are more susceptible remains unclear (Abel et al., 2014). Heterogeneity in susceptibility toM. tuberculosisinfection (innate immunity model) and heterogeneity in risk of progression once infected (adaptive immunity model) are both possible mechanisms rendering some people more susceptible to TB (Abel et al., 2014). We represent both of these possibilities by including two groups of individuals, as shown inFig. 1, where individuals in the primed states are more susceptible than individuals in the unprimed states.
In previous genetic models of TB susceptibility, it was assumed that ethnic risk groups differed in the length of exposure to TB, and, as a result of long-term selection for genetic variants conferring resistance, differed in their susceptibility toM. tuberculosisinfection and disease (Stead et al., 1990). We are instead hypothesizing that ecological drivers of epidemic TB, such as famine and crowding, resulted in strong selection on existing genetic variation within First Nations.
S
L
R
T
IT
N
S
L
R
T
IT
N
’
’
’
’
’
where λ=β(TI+TN)/M,
M=S+S’+L+L’+TI+TI’+TN+TN’+R+R’, and p’ = min{pγ,1}
λσS’ λS
pf 1-p p(1-f)
cTI
cTN
p’f 1-p’ p’(1-f)
cTI’ cT
N’
f(γυL’+λp’σ(1-ζ)L’)
(1-f)(γυL’+λp’σ(1-ζ)L’) (1-f)(υL+λp(1-ζ)L)
f(υL+λp(1-ζ)L)
f(ωR’+λp’σ(1-ζ)R’) (1-f)(ωR’+ λp’σ(1-ζ)R’) f(ωR+λp(1-ζ)R)
(1-f)(ωR+ λp(1-ζ)R)
Figure 1 Transmission diagram.Representation of compartmental TB models 0, 1, 2, and 3. Individuals who are more genetically susceptible are in the primed states, whereas less genetically susceptible indi-viduals are in the unprimed states.S,L,TI,TN, andRrepresent the numbers of people in the susceptible, latent, infectious active disease, non-infectious active disease, and recovered groups, respectively, as a function of time for the less susceptible group.S′,L′,TI′,TN′ , andR′represent the numbers of people in the susceptible, latent, infectious active disease, non-infectious active disease, and recovered groups, respectively, as a function of time for the more susceptible group. Model parameters are given inTable 1. For models 0 and 1, no individuals start out inS′, and thus all primed states remain empty. For models 2 and 3, a fraction of individuals start inS′. For model 2,σ̸=0 andy=0. For model 3,σ=0 andy̸=0. For simplicity, background mortality and TB specific mortality were omitted from the diagram.
plausible explanation for the observed dynamics because First Nations were not na¨ıve populations: pathogen genetic data indicates that Western Canadian First Nations were exposed toM. tuberculosisduring contact with European immigrants in the 18th century, one hundred years prior to the onset of epidemic TB (Pepperell et al., 2011a). Prior to the severe 19th century epidemics driven by famine and crowding, TB evidently persisted in these populations in a mild endemic form that is likely to have been associated with weak selection against susceptibility variants. There is also evidence of TB throughout Native American populations prior to contact with European immigrants, which raises the possibility that Western Canadian populations encounteredM. tuberculosisprior to their exposure during the fur trade (Stone et al., 2009).
Time varying parameters
Starting in the 1870s, First Nations people in Saskatchewan underwent a large-scale transition from nomadic or semi-nomadic lifestyles to settlement on reserves with attempts to take up farming; this transition was associated with severe famine (Lux, 2001). To account for this, we included five famine-related parameters in one of our models. It is well known that malnutrition, as well as deficiencies of specific micronutrients (Getz, Long & Henderson, 1951;Taylor & Camargo, 2011;Cegielski, Arab & Cornoni-Huntley, 2012), affect the risk of active disease and death among those with active disease. Malnutrition has been conceived of as an individual-level risk factor. Given the exceptionally high rates of TB observed in First Nations reserves coincident with profound famine, we sought to explore potential effects of malnutrition on dynamics of TB. We included five TB parameters that are plausibly affected by malnutrition: the TB death rate (Rao et al., 1998;Gustafson et al., 2007), the probability of fast progression (Downes, 1950;Cegielski, Arab & Cornoni-Huntley, 2012), the level of protective immunity to reinfection conferred by latency, and the rate of progression from latency (Cegielski, Arab & Cornoni-Huntley, 2012). There is reason to believe that malnutrition does not affect susceptibility to initial infection (Cegielski, Arab & Cornoni-Huntley, 2012), so this was not included as a famine-related parameter. Additionally, two demographic parameters are plausibly affected by malnutrition: the birth (Salam, Das & Bhutta, 2014) and death rates (Bresnahan & Tanumihardjo, 2014). Since famine-related changes in parameters are not well characterized, they were allowed to vary by up to a factor of 3. The late 19th century famine contributed to a demographic crash in Saskatchewan Plains First Nations, with some recovery of population numbers evident by the turn of the 20th century (Lux, 2001). The demographic recovery could have been due to both direct effects of the famine easing, as well as indirect effects of improving nutrition on susceptibility to TB (Lux, 2001).
In addition to its association with famine and malnutrition in the late 19th century, the transition from nomadic or semi-nomadic lifestyles to life on a government reserve also resulted in increased population densities (Lux, 2001). The late 19th and early 20th centuries were marked by increasing institutionalization of First Nations, with attendant negative impacts on their health (Milloy, 1999;Lux, 2001;Waldram, Herring & Young, 2006). This is in sharp contrast to Europe at the same time where living conditions were improving (McKeown & Record, 1962;Vynnycky & Fine, 1999). We account for this increase in crowding by allowing the effective contact rate to increase by a constant percentage between 0% and 2% per year over this period.
Models
0. Baseline Model, which models the progression of TB as outlined above and depicted inFig. 1without any time-varying famine-related parameters or heterogeneity in susceptibility. This model will be used as comparison for the subsequent models. 1. Famine model, which is the same as the baseline model but allows for time-varying
famine-related parameters, which change according to a step-function around 1900 (between 1895 and 1905), around when population levels began to increase (Lux, 2001). The time varying parameters are outlined inTable 1.
2. Innate Immunity Model, which is the same as the baseline model with the addition of a group of individuals who are more susceptible to infection withM. tuberculosis. Over the course of the epidemic, this group decreases in size, as individuals with greater genetic susceptibility are less likely to produce offspring.
3. Adaptive Immunity Model, which is the same as the baseline model with the addition of a group of individuals who are at higher risk of progression to active disease once infected. Over the course of the epidemic, this group decreases in size, as individuals with greater risk of disease are less likely to produce offspring.
Parameters
Model parameters with descriptions are given inTable 1, along with a plausible range for each parameter. Ranges were determined from the epidemiologic and modeling literature.
Analysis
All analysis was performed in R version 3.1.0. The following procedure was used to reduce the parameter space: For the full model, the model in which models 0–3 are nested, containing all 25 parameters listed inTable 2, we selected Latin Hypercube samples of parameters chosen uniformly from the parameter ranges given inTable 1. A total of 128 Latin Hypercube samples of 1,024 parameter sets were used, for a total of 131,072 parameters sets.
For each parameter set, a discrepancy was calculated on the relative scale (see equation in theSupplemental Information). The total population and total TB mortality discrepancies were weighted equally. In theSupplemental Information, we show that fits on the absolute scale yield similar results. We used the relative scale for our main analysis since the method to obtain confidence intervals, described below, would not work on the absolute scale, as we would obtain mortalities less than zero. That is, on the absolute scale, a large negative absolute discrepancy added to a small mortality would give a negative bootstrapped mortality. Using the relative scale avoids this issue. Using these results, we fit the discrepancies to the parameters using the polynomial spline-fitting algorithmpolymars in thepolsplinepackage in R to determine the seven most influential parameters for each of the models. The polynomial spline-fitting algorithm approach we used is similar to the partial-rank correlation approach used to reduce the parameter space (Porco & Blower, 1998); however, a key advantage of approach is that it allows for interactions of parameters.
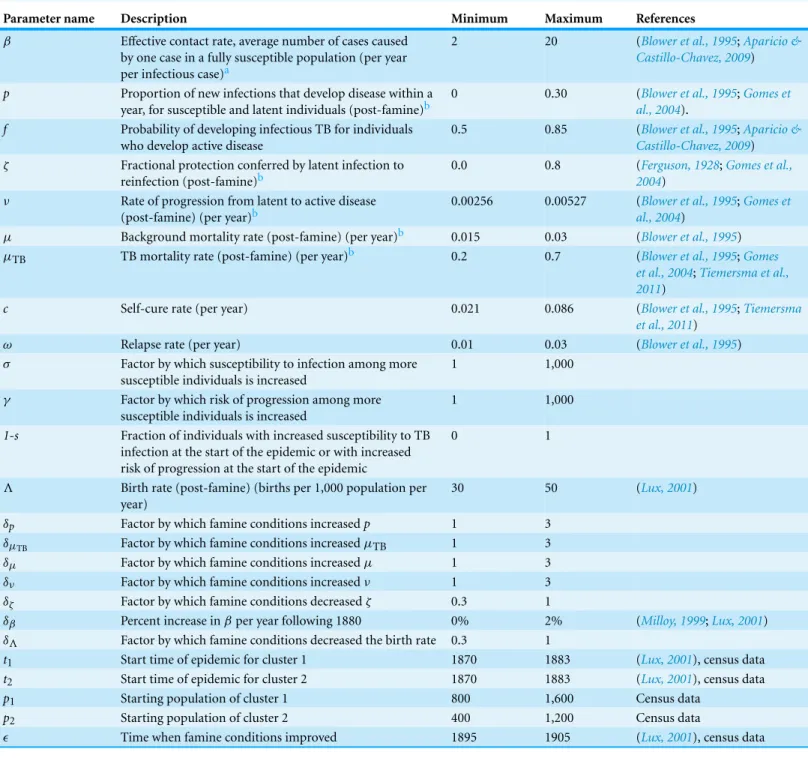
Table 1 Parameters and associated ranges.
Parameter name Description Minimum Maximum References
β Effective contact rate, average number of cases caused by one case in a fully susceptible population (per year per infectious case)a
2 20 (Blower et al., 1995;Aparicio & Castillo-Chavez, 2009)
p Proportion of new infections that develop disease within a year, for susceptible and latent individuals (post-famine)b
0 0.30 (Blower et al., 1995;Gomes et al., 2004).
f Probability of developing infectious TB for individuals who develop active disease
0.5 0.85 (Blower et al., 1995;Aparicio & Castillo-Chavez, 2009) ζ Fractional protection conferred by latent infection to
reinfection (post-famine)b
0.0 0.8 (Ferguson, 1928;Gomes et al., 2004)
ν Rate of progression from latent to active disease (post-famine) (per year)b
0.00256 0.00527 (Blower et al., 1995;Gomes et al., 2004)
µ Background mortality rate (post-famine) (per year)b 0.015 0.03 (Blower et al., 1995)
µTB TB mortality rate (post-famine) (per year)b 0.2 0.7 (Blower et al., 1995;Gomes
et al., 2004;Tiemersma et al., 2011)
c Self-cure rate (per year) 0.021 0.086 (Blower et al., 1995;Tiemersma
et al., 2011)
ω Relapse rate (per year) 0.01 0.03 (Blower et al., 1995)
σ Factor by which susceptibility to infection among more susceptible individuals is increased
1 1,000
γ Factor by which risk of progression among more
susceptible individuals is increased
1 1,000
1-s Fraction of individuals with increased susceptibility to TB infection at the start of the epidemic or with increased risk of progression at the start of the epidemic
0 1
Λ Birth rate (post-famine) (births per 1,000 population per year)
30 50 (Lux, 2001)
δp Factor by which famine conditions increasedp 1 3
δµTB Factor by which famine conditions increasedµTB 1 3
δµ Factor by which famine conditions increasedµ 1 3
δν Factor by which famine conditions increasedν 1 3
δζ Factor by which famine conditions decreasedζ 0.3 1
δβ Percent increase inβper year following 1880 0% 2% (Milloy, 1999;Lux, 2001)
δΛ Factor by which famine conditions decreased the birth rate 0.3 1
t1 Start time of epidemic for cluster 1 1870 1883 (Lux, 2001), census data
t2 Start time of epidemic for cluster 2 1870 1883 (Lux, 2001), census data
p1 Starting population of cluster 1 800 1,600 Census data
p2 Starting population of cluster 2 400 1,200 Census data
ϵ Time when famine conditions improved 1895 1905 (Lux, 2001), census data
Notes.
aSee associatedδparameter since this quantity described by this parameter changes over time.
bSee associatedδparameter andϵsince the quantity described by this parameter changes pre-/post- famine.
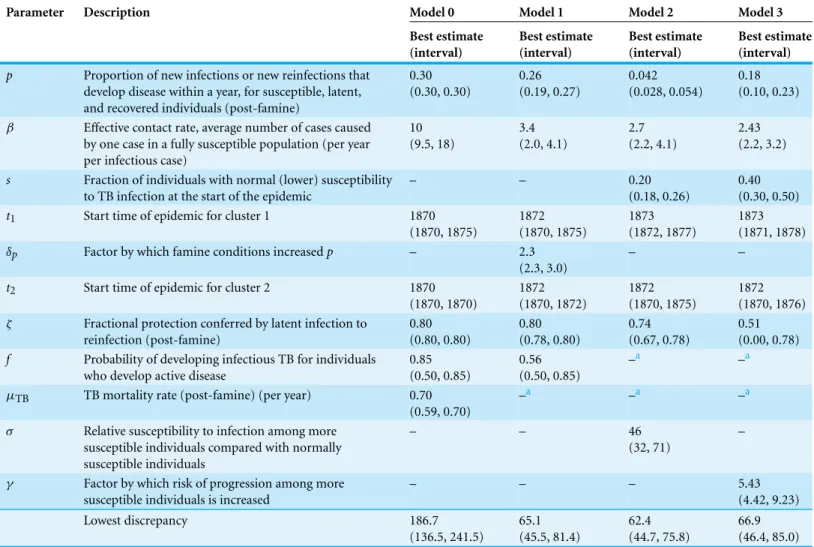
Table 2 Parameter estimates.Parameter estimates for the baseline model, famine model, intrinsic immunity model, and adaptive immunity model, respectively, to two significant figures (or the nearest year). Discrepancies are given to the nearest tenth. Best parameter estimates were obtained from optimization. Intervals were estimated from the 2.5%ile and 97.5%ile of the fits to the bootstrap data sets.
Parameter Description Model 0 Model 1 Model 2 Model 3
Best estimate (interval) Best estimate (interval) Best estimate (interval) Best estimate (interval)
p Proportion of new infections or new reinfections that develop disease within a year, for susceptible, latent, and recovered individuals (post-famine)
0.30 (0.30, 0.30) 0.26 (0.19, 0.27) 0.042 (0.028, 0.054) 0.18 (0.10, 0.23)
β Effective contact rate, average number of cases caused by one case in a fully susceptible population (per year per infectious case)
10 (9.5, 18) 3.4 (2.0, 4.1) 2.7 (2.2, 4.1) 2.43 (2.2, 3.2)
s Fraction of individuals with normal (lower) susceptibility to TB infection at the start of the epidemic
– – 0.20
(0.18, 0.26)
0.40 (0.30, 0.50)
t1 Start time of epidemic for cluster 1 1870
(1870, 1875) 1872 (1870, 1875) 1873 (1872, 1877) 1873 (1871, 1878)
δp Factor by which famine conditions increasedp – 2.3
(2.3, 3.0)
– –
t2 Start time of epidemic for cluster 2 1870
(1870, 1870) 1872 (1870, 1872) 1872 (1870, 1875) 1872 (1870, 1876) ζ Fractional protection conferred by latent infection to
reinfection (post-famine) 0.80 (0.80, 0.80) 0.80 (0.78, 0.80) 0.74 (0.67, 0.78) 0.51 (0.00, 0.78)
f Probability of developing infectious TB for individuals who develop active disease
0.85 (0.50, 0.85)
0.56 (0.50, 0.85)
–a –a
µTB TB mortality rate (post-famine) (per year) 0.70
(0.59, 0.70)
–a –a –a
σ Relative susceptibility to infection among more susceptible individuals compared with normally susceptible individuals
– – 46
(32, 71)
–
γ Factor by which risk of progression among more susceptible individuals is increased
– – – 5.43
(4.42, 9.23)
Lowest discrepancy 186.7
(136.5, 241.5) 65.1 (45.5, 81.4) 62.4 (44.7, 75.8) 66.9 (46.4, 85.0) Notes.
aFor each model, the seven most important parameters relevant to that model were fit to the data. For models 2 and 3,fandµ
TBwere dropped in order to includesand
σandsandγ, respectively. For model 1,µTBwas dropped in order to includeδp.
As a sensitivity analysis, we simulated single realizations of 1,024 parameter sets from a stochastic version of the null model with approximately equal populations. Then, we fit models 0, 1, 2, and 3 to these 1,024 parameter sets to determine the expected variation in model fit under the baseline model. Details are outlined in theSupplemental Information.
As an additional sensitivity analysis, we performed model fits with 10% of the population latently infected at the start of the epidemic. The fraction of latently infected individuals in the 1870s would have been very small, since genetic data indicates thatM. Tb populations were small prior to expansion in the late 19th century: approximately 1–2 First Nations individuals in Western Canada had active TB disease prior to the 1870s (Pepperell et al., 2011a). In addition, endemic and epidemic forms of tuberculosis were not evident in to contemporary observers of these populations prior to the 1870s (Ferguson, 1928). We assume that when living conditions rapidly deteriorated in the 1870s and 1880s most or all of these latently infected individuals progressed to active disease, seeding the resulting epidemics on First Nations reserves. Thus for the main model, we began simulation with no latently infected individuals. However, this fraction is unknown. Therefore, as a sensitivity analysis, we performed fits with the 7 most influential parameters for models 0, 1, 2, and 3 with a larger starting latent fraction of 10%. Results are given below and graphical fits are given inSupplemental Information 2.
RESULTS
We identified the following parameters with the most important effects on disease dynamics, presented in order of importance, from most important to least important: the probability of fast progression (p), the effective contact rate (β), the starting fraction of the population with normal (lower) TB susceptibility at the start of the epidemic (s), the start time of the epidemic for cluster 1 (t1), the famine related change in the probability of fast
progression (δp), the start time of the epidemic for cluster 2 (t2), the protection conferred
by latent infection to reinfection (ζ), the probability of developing infectious disease for those who develop active disease (f), and the TB death rate (µTB). Thus, the final version of
the famine model fit only incorporated one famine-related parameter: the famine related change in the probability of fast progression (δp); the remaining famine-related parameters were constrained at their null values. For models 2 and 3, in addition to including the starting fraction of the population with normal (lower) TB susceptibility at the start of the epidemic (s), we included the relative increased susceptibility of the more susceptible group (σ) and the relative increased rate of progression for the fast progression group (γ), respectively, because the model reduces to the null model if these parameters are fixed at 1. So, these parameters must be not equal to 1 for the starting fraction with normal (lower) susceptibility to TB (s) to affect the model fit to the data.
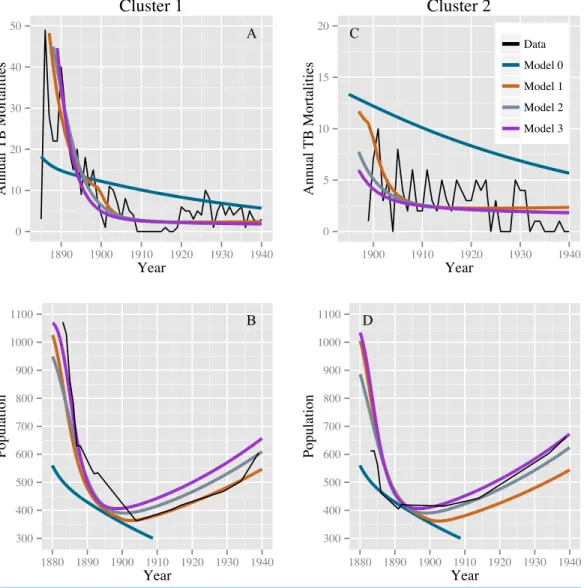
Figure 2 Model fits to the TB mortality time series and census data.Model fits to the TB mortality time series and census data for clusters 1 and 2 on the left (A and B, respectively) and right (C and D, respectively), respectively, and for models 0, 1, 2, and 3. Model 0 yields an implausibly poor fit to the TB mortality time series and census data, while models 1, 2, and 3 confer better fits, capturing the characteristic demographic decline and rise.
for the null model and model 3, indicating a strong preference for model 3. Out of 1,024 simulations, 4 simulated datasets had a ratio smaller than 0.36: one comparing models 0 and 1, two comparing models 0 and 2, and one comparing models 0 and 3. The four sim-ulated datasets with a low discrepancy ratio comparing models 0 and 1 were not the same datasets that produced low discrepancy ratios when comparing models 0 and 2 and 0 and 3. However, in the fits of the observed data, the discrepancy for model 0 was high, whereas the discrepancies for models 1, 2, and 3 were all comparably lower. Based on these simulations, we conclude that stochastic variation is unlikely to account for model 0’s poor fit compared with models 1–3, and that model 0 is therefore not consistent with the observed data. Models 1, 2, and 3 (or combinations therein) are consistent with observed trends.
Lastly, a starting latent fraction of 10% did not appreciably affect results. Models 1–3 outperformed model 0. The discrepancies for models 0–3 are similar to those for fits with a starting latent fraction of 0% (Table 2) and are given by 202.6, 66.6, 65.0, and 63.0, respectively. Graphical results are shown inSupplemental Information 2.
DISCUSSION
A key challenge in fitting TB models to these data was fitting the mortality data while simultaneously producing reasonable population estimates.Figure 3, based on data from
Lux (2001), shows population size trends in this region from 1884 to 1920 for five agencies (groups of reserves with shared administration, as opposed to individual reserves analyzed in this study). Clear trends are apparent: First, for four of the five agencies the population declined appreciably prior to 1900. The fifth, and smallest, may have declined in size prior to the onset of census data collection. Second, for four of the agencies the population did not continue to decline after 1900, and, in fact, began to grow again for three of the agencies. For the one agency for which the population continued to decline over the whole time period, the population did not fall below one-third of its 1884 value. The census data we have for clusters 1 and 2, shown inFig. 2, are consistent with these trends, showing a sharp population decline following the start of TB epidemics followed by a period of increase after 1900. Thus, population trends observed in the 2 clusters for which time series mortality data were available are consistent with the 5 agencies shown here.
In addition to yielding an implausibly poor fit to the TB mortality time series, model 0 failed to qualitatively reproduce the population dynamics. For model 0, populations associated with best fit to the mortality data decline and fail to recover. This is not the case for models 1, 2, and 3: we see a fall followed by a rise in the population levels consistent with both our census time series and regional trends shown inFig. 3.Figure 4shows the predicted population trends as the difference in relative susceptibility to infection (σ) increases, using parameters from the best fit of model 2. We can see here that more realistic demographic trends are achieved as we allow greater heterogeneity in susceptibility to infection.
For the famine model, we found a preference for a famine-related change in the probability of fast progression (δp); however, the remaining famine related parameters
Figure 3 Graph of the populations of five groups of reserves (agencies) from 1884 to 1920 (Lux, 2001).For the census data for clusters 1 and 2, refer toFig. 2. For four of the five agencies, populations decline following the onset of famine; most begin to recover around 1900.
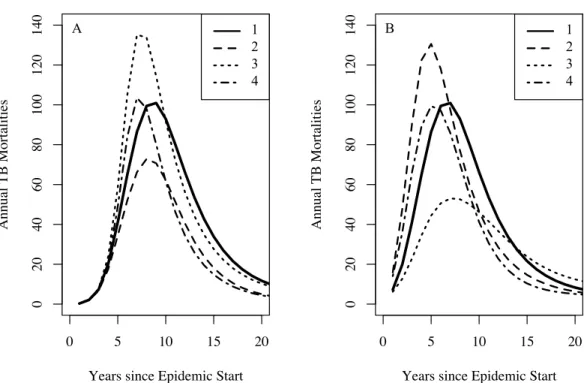
Figure 5 The effect of combinations of famine-related parameters on TB dynamics.Setting the ef-fective contact rate(β)to 3.2, the relative increased susceptibility of the more susceptible group(σ ) to 10, other famine-related parameters to their null values, and all remaining parameters to their midpoint values with no famine end time, we explore the dynamical effect of certain combinations of famine-related parameters on TB dynamics. For both graphs, curve 1 shows the TB mortality curve with no famine-related changes in parameters. (A) A three-fold increase in the background mortality(δµ=3) rate leads to a decrease in the number of TB mortalities since death due to non-TB causes depletes those at-risk for TB death (curve 2). A three-fold decrease in immunity conferred by latency(δζ =0.3)results in more TB mortalities since more individuals become infected (curve 3). However, a three-fold increase in the background mortality rate in combination with a three-fold decrease in immunity conferred by latency results in a minimal change to the TB mortality curve (curve 4). (B) A 25% increase in the probability of fast-progression(δp=1.25)leads to an increase in the model-predicted number of TB mortalities during the first few years of the epidemic (curve 2). However, somewhat paradoxically, higher TB death rates do not necessarily lead to increased TB mortality at population-level. This is due to the fact that with lower TB death rates individuals with TB are infectious for more time and thus are able to infect more individuals, ultimately leading to a greater number of TB deaths in the population. With a two-fold increase in the TB death rate(δ(µTB)=2), we see fewer TB mortalities (curve 3). However, a two-fold increase in the TB death rate in combination with a 25% increase in the probability of fast progression results in a minimal change to the TB mortality curve (curve 4).
Vynnycky & Fine (1999)explained the decline in TB in England and Wales in the late 18th and early 19th centuries with a declining effective contact rate over time and suggest that this may account for declines in other developed countries during the same time period. Here, introducing time-changing heterogeneity in TB susceptibility has similar dynamical effect: heterogeneity in TB susceptibility is dynamically equivalent to a time-decreasing average effective contact rate for this family of models. While alternate models that incorporate a declining effective contact rate may fit these data, we find the explanation of improved living conditions unsatisfactory. In order to explain our observed data, the increase in First Nations population densities associated with the shift from nomadic and semi-nomadic lifestyles to settlement on reserves would have had to immediately reverse itself. The late 19th and early 20th century were instead a time of increasing institutionalization of these populations (Lux, 2001;Waldram, Herring & Young, 2006); the expansion of the residential school system during this period is particularly notable (Milloy, 1999). The severe crowding, poor conditions and extensive TB transmission in schools of this period are well documented (Milloy, 1999). The effective contact rate is likely to have increased over this interval.
Based on our model fits, famine, genetic heterogeneity in susceptibility to infection, and genetic heterogeneity in risk of progression to active disease and combinations thereof are consistent with the observed demographic trends. While there may be other possible expla-nations, out of these three, we favor genetic heterogeneity in risk of progression to active disease for the following reasons. First, contemporary descriptions of the 19th/20th cen-tury epidemic noted that TB affected all families in these communities, and that half of the families were lost within a span of three generations (Ferguson, 1928). This suggests that the epidemic had the potential to impose very strong selection on existing genetic variation.
Second, previous work on these populations has shown that reserves that had early and more severe epidemics—the reserves studied here—currently have lower TB rates than do reserves that had later, less severe epidemics (Pepperell et al., 2011b). Our results could explain this modern-day difference in TB rates: in First Nations with early, severe epidemics, ecological drivers (chiefly famine) could have resulted in strong selection on existing genetic variation within these populations. We hypothesize that selection on populations with delayed TB epidemics was weaker as a result of effective TB treatments available during the later epidemics, and, possibly, less severe ecological drivers associated with later epidemics. There are marked disparities among contemporary First Nations with respect to their incidence of TB (Canadian Thoracic Society and the Public Health Agency of Canada, 2013). Genetic differences traceable to historical experiences with TB may account for some of these disparities.
Third and last, in the later years of the epidemic nearly all school-aged children were infected withM.tb, yet TB mortalities were considerably lower than in the early years of the epidemic. In several early 20th century surveys of children at school entry in this region all children examined showed signs of TB (Bryce, 1922;Milloy, 1999).Ferguson (1928)
of the epidemic, this could indicate that the rate of progression to active disease had slowed, potentially due to a change in the population-averaged risk of progression due to genetic selection. Famine-related changes in the probability of fast progression are also consistent with these observations, but would not explain modern day differences between reserves with early and late epidemics.
In addition, selection for alleles that protect against infectious disease has been observed over short time scales, as we hypothesize occurred for TB in First Nations between 1883 and 1940. Increased frequencies of theCCR5Δ32 genotypes, which protect against HIV-1 infection and progression to AIDS, have been observed both in individuals at high risk for HIV-1 infection and in HIV-1 infected individuals at risk for progression to AIDS (Dean et al., 1996;Marmor et al., 2001;Lederman et al., 2006). In a study that recruited men who have sex with men in 1995 from various sites across the US, a higher prevalence of the CCR5Δ32 allele is significantly associated with increased age among Caucasian individuals from high-prevalence cities, but not from lower prevalence cities (Marmor et al., 2001). In addition, progression to AIDS is slower among individuals with either the heterozygous or homozygous genotype and thus, prior to the widespread availability of HIV-treatment, the frequency of bothCCR5Δ32 genotypes was greatly elevated among individuals who had survived HIV-1 infection for more than 10 years (Dean et al., 1996). Further studies of genetic variation among First Nations Canadians would be required to reach any definitive conclusions on the role of human genetics and heterogeneity in susceptibility to TB in these populations.
There are several potential limitations to our approach. First, there are other potential explanations for the TB dynamics observed in this setting and Ferguson’s observation that half of all families were lost as a result of the epidemic. One such alternative explanation would be saturation of micro-networks (Veen, 1992;Meyers et al., 2005). However, given this extraordinarily high force of infection as apparent from the nearly universal infection of school-aged children, it is unlikely that the TB epidemic declined because of saturation of certain sub-populations (micro-networks) while others escaped the epidemic. In addition, saturation of micro-networks would fail to explain modern day differences between reserves with a history of early versus late epidemics (Pepperell et al., 2011b).
We did not account for epidemics of other diseases during this time period that could also have affected the observed demographic trends. Historical accounts indicate that intercurrent epidemics, while severe in some instances, were short-lived and that First Nations populations recovered quickly. For example, the 1918 influenza pandemic resulted in approximately 4,000 deaths total among all First Nations in Canada corresponding to a mortality rate of 37.7 per 1,000 population. For one First Nations group, for which detailed population level data were available, the population recovered to its pre-1918 levels within 5 years (Lux, 2001).
18-dimensional parameter spaces for models 2 and 3. In addition, we modeled the change in TB and population parameters due to improving famine conditions as a step-function rather than a gradual change. While crude, we believe this was the simplest way to include famine related factors in an absence of information allowing us to parameterize a more gradual change. Lastly, we did not include age structure (Brooks-Pollock, Cohen & Murray, 2010) since we did not have age-specific TB mortality data, age-specific background mortality data, and data on the population age-structure.
In conclusion, we explore the population-level effects of malnutrition and genetic heterogeneity in TB susceptibility on TB epidemics in First Nations reserves from 1885 to 1940. Malnutrition has previously been considered an individual-level risk factor and its population-level effects on TB epidemics have not previously been explored. This investigation demonstrates that changes in a population’s nutritional status can have significant effects on TB dynamics, while also producing the correct qualitative trends in population levels over this time period. In other settings, such famine-related changes in susceptibility may be necessary to explain TB dynamics. In addition, we find that the inclusion of heterogeneity in susceptibility toM. tuberculosisinfection or risk of TB disease yields improved fits to both the TB mortality and census data while also producing the correct qualitative trends in population levels over this time period. Models that fail to account for famine or heterogeneity yield an implausibly poor fit to the TB mortality time series and fail to produce the correct trends in population size. In addition, modeling changes in genetic susceptibility over time has appreciable effects on population dynamics. Further research using human genetic data is required to conclusively determine the cause of modern-day disparities in these communities. In addition, disease dynamical effects of heterogeneity in susceptibility and fluctuating nutritional status should be investigated in other settings. Given the substantial dynamic effects observed with our models, development of TB control strategies aimed at improving nutrition, and/or targeted to highly susceptible individuals may yield substantial benefits at the population level.
ADDITIONAL INFORMATION AND DECLARATIONS
Funding
This study was funded by a Models of Infectious Disease Agent Study (MIDAS) grant from the National Institute of General Medical Sciences at the National Institutes of Health to the University of California, San Francisco (Award Number U01GM087728). The funders had no role in study design, data collection and analysis, decision to publish, or preparation of the manuscript.
Grant Disclosures
The following grant information was disclosed by the authors: Models of Infectious Disease Agent Study: U01GM087728.
Competing Interests
Author Contributions
• Sarah F. Ackley conceived and designed the experiments, performed the experiments, analyzed the data, contributed reagents/materials/analysis tools, wrote the paper, prepared figures and/or tables, reviewed drafts of the paper.
• Fengchen Liu performed the experiments, contributed reagents/materials/analysis tools, reviewed drafts of the paper.
• Travis C. Porco conceived and designed the experiments, contributed reagents/materials/analysis tools, reviewed drafts of the paper.
• Caitlin S. Pepperell conceived and designed the experiments, contributed reagents/materials/analysis tools, wrote the paper, reviewed drafts of the paper.
Supplemental Information
Supplemental information for this article can be found online athttp://dx.doi.org/ 10.7717/peerj.1237#supplemental-information.
REFERENCES
Abel L, El-Baghdadi J, Bousfiha AA, Casanova J-L, Schurr E. 2014.Human genetics of
tuberculosis: a long and winding road.Philosophical Transactions of the Royal Society of London. Series B, Biological Sciences369:20130428DOI 10.1098/rstb.2013.0428.
Aparicio JP, Castillo-Chavez C. 2009.Mathematical modelling of tuberculosis epidemics.
Mathematical Biosciences and Engineering: MBE6:209–237DOI 10.3934/mbe.2009.6.209.
Baltimore RS. 1993.Tuberculosis: a comprehensive international approach.The Yale Journal of Biology and Medicine66:335–336.
Baxter T. 1993.Low infectivity of tuberculosis.Lancet342(8867):371
DOI 10.1016/0140-6736(93)91516-O.
Blower SM, McLean AR, Porco TC, Small PM, Hopewell PC, Sanchez MA, Moss AR. 1995.
The intrinsic transmission dynamics of tuberculosis epidemics.Nature Medicine1:815–821
DOI 10.1038/nm0895-815.
Bresnahan KA, Tanumihardjo SA. 2014.Undernutrition, the acute phase response to infection, and its effects on micronutrient status indicators. Advances in Nutrition5:702–711
DOI 10.3945/an.114.006361.
Brooks-Pollock E, Cohen T, Murray M. 2010.The impact of realistic age structure in simple models of tuberculosis transmission.PLoS ONE5:e8479DOI 10.1371/journal.pone.0008479.
Bryce PH. 1922.The story of a national crime: an appeal for justice to the Indians of Canada. Ottowa: James Hope & Sons.
Canadian Thoracic Society and the Public Health Agency of Canada. 2013.Canadian Tuberculosis Standards. Ottawa: Centre for Communicable Diseases and Infection Control, Public Health Agency of Canada.
Cegielski JP, Arab L, Cornoni-Huntley J. 2012.Nutritional risk factors for tuberculosis among adults in the United States, 1971–1992.American Journal of Epidemiology176(5):409–422
DOI 10.1093/aje/kws007.
Clark M, Riben P, Nowgesic E. 2002. The association of housing density, isolation and tuberculosis in Canadian First Nations communities.International Journal of Epidemiology
31:940–945DOI 10.1093/ije/31.5.940.
Clark M, Vynnycky E. 2004.The use of maximum likelihood methods to estimate the risk of tuberculous infection and disease in a Canadian First Nations population.International Journal of Epidemiology33:477–484DOI 10.1093/ije/dyh001.
Daschuk JW, Hackett P. 2006.Treaties and tuberculosis: First Nations people in late 19th-century western Canada, a political and economic transformation.Canadian Bulletin of Medical History
23:307–330.
Dean M, Carrington M, Winkler C, Huttley GA, Smith MW, Allikmets R, Goedert JJ, Buchbinder SP, VittinghoffE, Gomperts E, Donfield S, Vlahov D, Kaslow R, Saah A, Rinaldo C, Detels R, O’Brien SJ. 1996.Genetic restriction of HIV-1 infection and progression to AIDS by a deletion allele of the CKR5 structural gene. Science273:1856–1862
DOI 10.1126/science.273.5283.1856.
Downes J. 1950.An experiment in the control of tuberculosis among Negroes.The Milbank Memorial Fund Quarterly28:127–159DOI 10.2307/3348094.
Dye C, Garnett GP, Sleeman K, Williams BG. 1998.Prospects for worldwide tuberculosis control under the WHO DOTS strategy. Directly observed short-course therapy.Lancet352:1886–1891
DOI 10.1016/S0140-6736(98)03199-7.
Ferguson RG. 1928.Tuberculosis among the Indians of the Great Canadian plains. London: Adlard and Son.
Getz HR, Long ER, Henderson HJ. 1951.A study of the relation of nutrition to the development of tuberculosis; influence of ascorbic acid and vitamin A.American Review of Tuberculosis
64:381–393.
Gomes MGM, Franco AO, Gomes MC, Medley GF. 2004.The reinfection threshold promotes variability in tuberculosis epidemiology and vaccine efficacy.Proceedings of the Royal Society B: Biological Sciences271(1539):617–623DOI 10.1098/rspb.2003.2606.
Grigg ER. 1958.The arcana of tuberculosis with a brief epidemiologic history of the disease in the USA.American Review of Tuberculosis78:151–172.
Gustafson P, Gomes VF, Vieira CS, Samb B, Naucl´er A, Aaby P, Lisse I. 2007.Clinical predictors for death in HIV-positive and HIV-negative tuberculosis patients in Guinea-Bissau.Infection
35:69–80DOI 10.1007/s15010-007-6090-3.
Hinshaw HC, Feldman WH, Pfuetze KH. 1946.Treatment of tuberculosis with streptomycin; a summary of observations on one hundred cases.Journal of the American Medical Association
132:778–782DOI 10.1001/jama.1946.02870480024007.
Rieder HL, Cauthen GM, Comstock GW, Snider Jr DE. 1988.Epidemiology of tuberculosis in the United States.Epidemiologic Reviews11:79–98.
Larcombe L, Nickerson P, Singer M, Robson R, Dantouze J, McKay L, Orr P. 2011.Housing conditions in 2 Canadian First Nations communities.International Journal of Circumpolar Health70:141–153DOI 10.3402/ijch.v70i2.17806.
Lederman MM, Penn-Nicholson A, Cho M, Mosier D. 2006.Biology of CCR5 and its role in HIV infection and treatment.JAMA296:815–826DOI 10.1001/jama.296.7.815.
Library and Archives Canada. 2014.Indian Affairs Annual Reports, 1864–1990.Available athttp: //www.bac-lac.gc.ca/eng/discover/aboriginal-heritage/first-nations/indian-affairs-annual-reports/
Pages/introduction.aspx.
Marmor M, Sheppard HW, Donnell D, Bozeman S, Celum C, Buchbinder S, Koblin B, Seage GR, HIV Network for Prevention Trials Vaccine Preparedness Protocol Team. 2001.
Homozygous and heterozygous CCR5-Delta32 genotypes are associated with resistance to HIV infection.Journal of Acquired Immune Deficiency Syndromes (1999)27:472–481
DOI 10.1097/00126334-200108150-00009.
McKeown T, Record RG. 1962.Reasons for the decline of mortality in england and wales during the nineteenth century.Population Studies16:94–122DOI 10.1080/00324728.1962.10414870.
Meyers LA, Pourbohloul B, Newman MEJ, Skowronski DM, Brunham RC. 2005.Network theory and SARS: predicting outbreak diversity.Journal of Theoretical Biology232:71–81
DOI 10.1016/j.jtbi.2004.07.026.
Milloy JS. 1999.A national crime: the Canadian government and the residential school system, 1879 to 1986. Vol. 11. Winnipeg: University of Manitoba Press.
Mitchell A. 1992.Tuberclosis statistics and the McKeown thesis: a rebuttal to David Barnes.Social History of Medicine5:291–296DOI 10.1093/shm/5.2.291.
Motulsky AG. 1989.Metabolic polymorphisms and the role of infectious diseases in human evolution.Human Biology61(5–6):835–869.
Murray CJL, Salomon JA. 1998.Modeling the impact of global tuberculosis control strategies.
Proceedings of the National Academy of Sciences of the United States of America95:13881–13886
DOI 10.1073/pnas.95.23.13881.
Narain R. 1980.Establishing priority during investigation of tuberculosis contacts.The American Review of Respiratory Disease121:189–190.
Nelder JA, Mead R. 1965.A simplex method for function minimization.The Computer Journal
7:308–313DOI 10.1093/comjnl/7.4.308.
Pepperell C, Hoeppner VH, Lipatov M, Wobeser W, Schoolnik GK, Feldman MW. 2010.
Bacterial genetic signatures of human social phenomena among M. tuberculosisfrom an Aboriginal Canadian population. Molecular Biology and Evolution 27:427–440
DOI 10.1093/molbev/msp261.
Pepperell CS, Granka JM, Alexander DC, Behr MA, Chui L, Gordon J, Guthrie JL, Jamieson FB, Langlois-Klassen D, Long R, Nguyen D, Wobeser W, Feldman MW. 2011a.Dispersal of Mycobacterium tuberculosis via the Canadian fur trade.Proceedings of the National Academy of Sciences of the United States of America108:6526–6531DOI 10.1073/pnas.1016708108.
Pepperell C, Chang AH, Wobeser W, Parsonnet J, Hoeppner VH. 2011b.Local epidemic history as a predictor of tuberculosis incidence in Saskatchewan Aboriginal communities.The International Journal of Tuberculosis and Lung Disease15:899–905DOI 10.5588/ijtld.10.0556.
Porco TC, Blower SM. 1998.Quantifying the intrinsic transmission dynamics of tuberculosis.
Theoretical Population Biology54:117–132DOI 10.1006/tpbi.1998.1366.
Rao VK, Iademarco EP, Fraser VJ, Kollef MH. 1998. The impact of comorbidity on mortality following in-hospital diagnosis of tuberculosis. Chest 114:1244–1252
DOI 10.1378/chest.114.5.1244.
ReVelle CS, Lynn WR, Feldmann F. 1967.Mathematical models for the economic allocation of tuberculosis control activities in developing nations.The American Review of Respiratory Disease
96:893–909.
Stead WW, Senner JW, Reddick WT, Lofgren JP. 1990.Racial differences in susceptibility to infection by Mycobacterium tuberculosis.The New England Journal of Medicine322:422–427
DOI 10.1056/NEJM199002153220702.
Stone AC, Wilbur AK, Buikstra JE, Roberts CA. 2009.Tuberculosis and leprosy in perspective.
American Journal of Physical Anthropology140:66–94DOI 10.1002/ajpa.21185.
Styblo K. 1986.Tuberculosis control and surveillance.Recent Advances in Respiratory Medicine
4:77–108.
Szreter S. 1988.The importance of social intervention in Britain’s mortality decline
c.1850–1914: a re-interpretation of the role of public health.Social History of Medicine1:1–38
DOI 10.1093/shm/1.1.1.
Taylor CE, Camargo Jr CA. 2011.Impact of micronutrients on respiratory infections.Nutrition Reviews69:259–269DOI 10.1111/j.1753-4887.2011.00386.x.
Tiemersma EW, Van der Werf MJ, BorgdorffMW, Williams BG, Nagelkerke NJD. 2011.Natural history of tuberculosis: duration and fatality of untreated pulmonary tuberculosis in HIV negative patients: a systematic review.PLoS ONE6:e17601DOI 10.1371/journal.pone.0017601.
Veen J. 1992.Microepidemics of tuberculosis: the stone-in-the-pond principle.Tubercle and Lung Disease73:73–76DOI 10.1016/0962-8479(92)90058-R.
Vynnycky E, Fine PE. 1999.Interpreting the decline in tuberculosis: the role of secular trends in effective contact.International Journal of Epidemiology28:327–334DOI 10.1093/ije/28.2.327.
Waldram JB, Herring A, Young TK. 2006.Aboriginal health in Canada: historical, cultural, and epidemiological perspectives. Toronto: University of Toronto Press.
Wood R, Lawn SD, Caldwell J, Kaplan R, Middelkoop K, Bekker L-G. 2011.Burden of new and recurrent tuberculosis in a major South African city stratified by age and HIV-status.PLoS ONE
6:e25098DOI 10.1371/journal.pone.0025098.