DIRECT CHRONOPOTENTIOMETRIC ANALYSIS OF RIBOFLAVIN USING A GLASSY CARBON VESSEL AS THE WORKING ELECTRODE
TКЧУК Ž. BrОгШ1*, ГШrТМК S. StШУКЧШvТć1, ГvШЧТЦТr J. SuturШvТć1, SЧОžКЧК Ž. KrКvТć1 , Jovana J. Kos2, SpКsОЧТУК D. MТХКЧШvТć1 and AЧК D. ĐurШvТć1
1 University of Novi Sad, Faculty of Technology, Bulevar Cara Lazara 1, 21000 Novi Sad, Serbia 2
University of Novi Sad, Institute of Food Technology, Bulevar Cara Lazara 1, 21000 Novi Sad, Serbia A new method for the determination of riboflavin (vitamin B2) was developed based on chronopotentiometry with a glassy carbon process vessel macroelectrode. The method optimisation included investigation of the most important experimental parameters: type and concentration of the supporting electrolyte, initial potential, reduction current, and the working electrode surface area. The reduction signal of riboflavin appeared at about -0.12 V vs. Ag/AgCl (3.5 mol/dm3 KCl) electrode in 0.025 mol/dm3 HCl as the supporting electrolyte. A linear response was obtained in the the range of 0.05-4 mg/dm3. The limit of detection and limit of quantitation were 0.018 mg/dm3 and 0.054 mg/dm3, respectively. Due to the use of specific working electrode, a significant enhancement of the method relative sensitivity of about 10 times was achieved. The accuracy of the defined method was confirmed by HPLC analyses. The developed method was successfully applied for the quantitation of riboflavin in various pharmaceutical multivitamin preparations.
KEY WORDS: vitamin B2,glassy carbon vessel macroelectrode, chronopotentiometry
INTRODUCTION
Riboflavin (7,8-dimethyl-10-ribitylisoalloxazine) exists in three forms: free riboflavin and two cofactor forms, flavin mononucleotide (FMN) and flavin adenine dinucleotide (FAD). Also known as vitamin B2, it is a water-soluble vitamin crucial for metabolism
and energy production from carbohydrates, fats and acids (1-3). In addition, several stu-dies demonstrated that riboflavin derivatives may have antioxidant and anticancer activi-ties and can be used in treating different diseases (4). Humans are not able to synthesize and store vitamin B2 in their bodies. Therefore, it is necessary to provide sufficient
amounts of this vitamin through a balanced diet (5). Recommended daily intakes for adults are 1.3 mg and 1.7 mg for women and men, respectively (3). Riboflavin deficiency is usually caused by inadequate dietary intake, disease, drugs, or alcohol abuse. Deficien-cy leads to skin and mucosal disorders (1).
The principal objective of this study was to develop an alternative chronopotentio-metric method for vitamin B2 determination using a glassy carbon (GC) vessel as the
working electrode. The GC vessel macroelectrode has been previously used for the deter-mination of tocopherols (6) and mercury (7, 8), but its use for deterdeter-mination of riboflavin has not yet been demonstrated. Due to the large surface area of this macroelectrode, which depends on the volume of the analysed solution, enhancement in method sensitivi-ty could be achieved. In order to optimise the method, the influence of the most important analytical parameters was investigated. The proposed method was applied for direct de-termination of vitamin B2 in commercially available multivitamin pharmaceutical
pre-parations.
EXPERIMENTAL
Chemicals and reagents
Riboflavin (VB2), thiamine (VB1) and pyridoxine (VB6) were purchased from
Sigma-Aldrich (Germany). VB2 stock solution (0.5 g/dm3) was prepared daily by dissolving
appropriate amounts of solid standard in supporting electrolyte, while working standard solutions were prepared by appropriate dilutions of the stock solution with supporting electrolyte. All other chemicals used were of analytical grade purity. In all experiments, doubly distilled water was used.
Apparatus
All analyses were carried out using the analyser for potentiometric and chronopoten-tiometric stripping analysis of our own construction (6). The qualitative characteristic (re-duction potential) and quantitative characteristic (transition time) of the analyte were de-termined automatically by the analyser. The output records were provided by an EPSON-570+ printer. A glassy carbon vessel, cylinder (Sigradur G, HTW, Germany) of an inner (active) surface area of 23.7 cm2 (Din = 1.9 cm, V = 9.92 cm3) was used as the working
electrode. An Ag/AgCl (3.5 mol/dm3 KCl) electrode was used as the reference electrode. A platinum wire of total surface area of 2.75 cm2, wrapped around the reference electro-de, served as an auxiliary electrode. In order to renew the macroelectrode surface, the GC vessel was polished with a cotton tampon dipped in the aqueous suspension of aluminium
ШбТНО (РrКТЧ sТгО 0.5 µЦ). AПtОr pШХТsСТЧР, tСО vОssОХ аКs rТЧsОН аТtС НТstТХХОН КЧН НШuЛ -le-distilled water. Prior to each analysis the glassy carbon vessel was electrochemically activated by a constant current of 48.β A ТЧ 10×λλ pШtОЧtТКХ МвМХОs ПrШЦ 0.017 Џ tШ -0.2 V, in the solution usually used for electrode testing (0.018 mol/dm3 H2SO4). After this
pre-treatment, the analytical signal of VB2 was higher and better defined. All laboratory
Samples and sample preparation procedures
Five samples of commercially available multivitamin pharmaceutical preparations were used, including vitamin B complex tablets, multivitamin tablets with minerals and multivitamin granules. Samples were purchased from local drugstores (Novi Sad, Voj-vodina).
The sample preparation procedure has been described earlier (9), and it consisted of powdering, dissolution, sonication and filtration. Further, samples were diluted to the fi-nal content of VB2 between 1 mg/dm3 and 1.7 mg/dm3 and directly analysed by
chrono-potentiometry.
RESULTS AND DISCUSSION
Method optimisation
Optimisation of the proposed electrochemical method for chronopotentiometric VB2
determination using a GC vessel macroelectrode was performed by the examination of the most important experimental parameters described in the following sections, con-sidering the values and reproducibility of riboflavin analytical signal.
Supporting electrolyte. The procedure for optimisation of the supporting electrolyte was done in our previous work (9), where the glassy carbon disc electrode was used as the working electrode. The 0.025 mol/dm3 HCl solution was chosen as the optimal supporting electrolyte and used in all further analyses. In the optimal supporting electro-lyte, the VB2 reduction wave appeared at about - 0.12 V (vs. Ag/AgCl, 3.5 mol/dm3).
Optimisation of the initial potential. The influence of the initial potential on the VB2
determination using a GC vessel was investigated in the potential range from 0.7 to -0.1 V in model solutions of 1 mg/dm3 of riboflavin in the supporting electrolyte. The
rОНuМtТШЧ МurrОЧt КppХТОН аКs 48.β A, аСТХО tСО ПТЧКХ pШtОЧtТКХ аКs -0.21 V. More negative final potentials caused an extension of the chronopotentiogram. The initial potential of 0.017 V was chosen as optimal (RSD = 1.99%, n = 5).
Optimisation of the reduction current. The influence of the reduction current was investigated in the range from 36.γ µA tШ 48.β µA ПШr tСО ЏB2 content of 0.5 mg/dm3 and ПrШЦ 40.8 µA tШ 48.β µA ПШr tСО ЏB2 content of 2 mg/dm3. TСО trКЧsТtТШЧ tТЦО ( )
exponentially decreased with the reduction current (I) increase for the lower content of
tСО vТtКЦТЧ ( =7.7β×О-0.037I
, r=0.9961, n=5).
FШr tСО СТРСОr МШЧtОЧt ШП rТЛШПХКvТЧ, tСО НОpОЧНОЧМО аКs ХТЧОКr ( = −0.15 × I + 9.51, r = 0.9956, n = 5). Considering the rectilinear sequence of the dependence I·τ1/2 = ƒ(I), the
rОНuМtТШЧ МurrОЧt ТЧtОrvКХ ПrШЦ γ7.8 tШ 48.β µA аКs sОХОМted as appropriate. In respect to the required sensitivity, an adequate value of current was chosen from the proposed ran-ge: smaller reduction currents were chosen for lower contents of the analyte and vice versa. The applied current did not affect the reduction potential of vitamin B2, which was
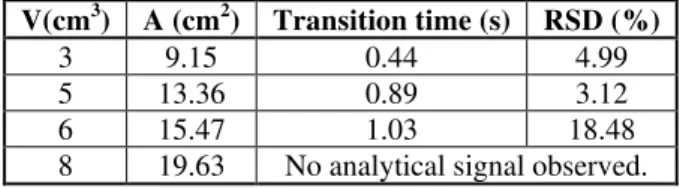
Influence of the working electrode surface area. The influence of the working elec-trode surface area on the riboflavin transition time was investigated by changing the vo-lume of the analysed solution. The measurements were made in the range from 9.15 cm2 to 19.63cm2 (3-8 cm3). The content of VB2 was 0.5 mg/dm3, and the reduction current КppХТОН аКs 48.β µA (ЦКбТЦuЦ vКХuО ШП tСО rОduction current of the analyser). Figure 1a) represents the chronopotentiogram for 0.5 mg/dm3 riboflavin using a glassy carbon disc electrode, whereas Figure 1b) shows the chronopotentiogram for the same content of the vitamin using a glassy carbon vessel electrode as the working electrode, indicating a significant increase of the relative sensitivity of about 10 times. The horizontal lines in Figures 1a) and 1b) show the position of the inflection points corresponding to the reduction time, i.e. analytical signal of VB2.
Figure 1. Chronopotentiogram of 0.5 mg/dm3 riboflavin in 0.025 mol/dm3 HCl:
К) usТЧР К РХКssв МКrЛШЧ НТsМ ОХОМtrШНО (I = 0.8 µA, EInitial = 0.023 V), Л) usТЧР К РХКssв МКrЛШЧ vОssОХ ОХОМtrШНО (I = 48.β µA, EInitial = 0.017 V).
The first numerical value below the chronopotentiograms is the reduction potential, whereas the second and the third ones represent the transition time
For the macroelectrode surface area of 9.15 - 13.36 cm2 (3-5 cm3 of the analysed so-lution) the analytical signal increased with the increase of the working electrode surface area. With further increase of the working electrode area to approximately 15.47 cm2 (V = 6 cm3) the analytical signal was higher, but fragmented, possibly due to inappropriate ratio of the working electrode surface area and counter electrode surface area. Additional-ly, by increasing the working electrode surface area, the applied current density decrea-sed, resulting in extension of the chronopotentiogram and decrease in the method repro-ducibility. Consequently, for 8 cm3 of the analysed VB2 solution (19.63 cm2 of working
The influence of the macroelectrode surface area on the analytical signal of vitamin B2 is presented in Table 1. It is important to emphasize that the working electrode surface
area, as well as the value of the reduction current have to be adjusted according to the analysed content of VB2.
Table 1. Influence of the macroelectrode surface area on the analytical signal of vitamin B2
V(cm3) A (cm2) Transition time (s) RSD (%)
3 9.15 0.44 4.99
5 13.36 0.89 3.12
6 15.47 1.03 18.48
8 19.63 No analytical signal observed.
Method validation
The validation procedure of the optimised method was performed by evaluation of the following parameters: linearity, limit of detection (LOD), limit of quantitation (LOQ), precision, selectivity and accuracy.
Linearity. Dependence of the VB2 analytical signal on the content was investigated in
two ranges: 0.05 - 0.2 mg/dm3 and 0.2 - 4 mg/dm3, under the optimal conditions. The applied reНuМtТШЧ МurrОЧt аКs 40 µA ПШr tСО ХШаОr rКЧРО КЧН 45 µA ПШr tСО СТРСОr rКЧРО. Both experiments were conducted in five rОpХТМКtОs. TСО rОНuМtТШЧ tТЦО ( ) - content (Cm)
dependences were defined using the least-squares method and are presented in Table 2, indicating very good linearity.
Table 2. Linear concentration ranges for chronopotentiometric analysis of VB2 using
GC vessel electrode
Content range (mg/dm3) Dependence Sa Sb r
0.05 - 0.20 ô = 6.440 × Cm + 0.418 0.487 0.035 0.9981
0.20 - 4.00 ô = 1.4β7 × Cm + 0.034 0.033 0.004 0.9984 Sa - stКЧНКrН НОvТКtТШЧ ШП tСО sХШpО Дs × НЦ3/mg], n = 5;
Sb - standard deviation of the intercept [s], n = 5; r - correlation coefficient
LOD and LOQ. The LOD and LOQ values were calculated according to the (3.3·Sb/a) and (10·Sb/a) criteria, respectively (10), where Sb is the standard deviation of the intercept and a is the slope of the calibration curve defined for LOD concentration range (0.05 - 0.2 mg/dm3). The calculated values of LOD and LOQ were 0.018 mg/dm3 and 0.054 mg/dm3 of VB2, respectively, and they were in good agreement with the experimental
current density, which could minimise the extension of the chronopotentiogram. Therefore, measurement of the inflection points as well as the reduction time could be possible. Unfortunately, the analyser used in this study was not able to produce reduction
МurrОЧts СТРСОr tСКЧ 50 µA. TСО ХТЦТt ШП НОtОМtТШЧ МШuХН ЛО КХsШ НОМrОКsОН Лв КutШЦКtТМ
subtraction of the base line from the chronopotentiogram belonging to riboflavin.
Precision. The instrumental precision of the VB2 chronopotentiometric determination
using a GC vessel macroelectrode was tested by five times repeated analysis of the model solutions containing 0.2 mg/dm3 and 2 mg/dm3 of the vitamin. The RSD values of the chronopotentiometric signal were used for estimation of the instrumental precision.
The method precision (reproducibility and intermediate precision) was evaluated as well. Reproducibility was determined as the intra-day RSD by the analysis of five model solutions containing 0.2 mg/dm3 and five model solutions containing 2 mg/dm3 ribofla-vin. Intermediate precision was defined as the inter-day RSD value. The model solutions of the same concentrations of riboflavin were analysed every day in five consecutive
НКвs. TСО rОНuМtТШЧ МurrОЧts КppХТОН ТЧ tСОsО ОбpОrТЦОЧts аОrО 40.0 µA ПШr tСО ХШаОr КЧН 45.0 µA ПШr tСО СТРСОr МШЧtОЧt ШП ЏB2. As the RSD values of all experiments related to
instrumental and method precision were less than 5%, it can be concluded that the pre-cision of the proposed chronopotentiometric method was acceptable.
Interferences. Considering pharmaceutical and dietary multivitamin preparations, interference problems may come from other vitamins usually present in these products, as well as from filing materials such as different kinds of carbohydrates. The interference study was undertaken by analysing model solutions of VB2 with and without addition of
VB1, VB6, vitamin C (VC), nicotinic acid, sucrose and glucose, and comparing their VB2
analytical signals. The influence of the interfering compounds was examined for two contents of VB2, 0.5 mg/dm3 and 1 mg/dm3. The contents of the added interfering
vitamins were 0.5, 1, 5 and 10 mg/dm3, whereas the contents of sucrose and glucose were 5, 10, 15 and 20 g/dm3. Similar to our previous work (9), the reduction time of VB2 was
not significantly affected by a 20-fold excess of the tested vitamins and 40000-fold excess of sucrose and glucose. In all experiments related to the interference study, the VB2 analytical signal did not change more than 7%, indicating a very good selectivity of
the proposed method.
HPLC analyses. HPLC parallel analyses of the same pharmaceutical and dietary multivitamin preparations were done in order to estimate the accuracy of the proposed method. The performed HPLC analysis was described in the previous study (9). The obtained results are shown in the following section.
Determination of vitamin B2 in pharmaceuticals
The GC vessel macroelectrode was used for the determination of VB2 in
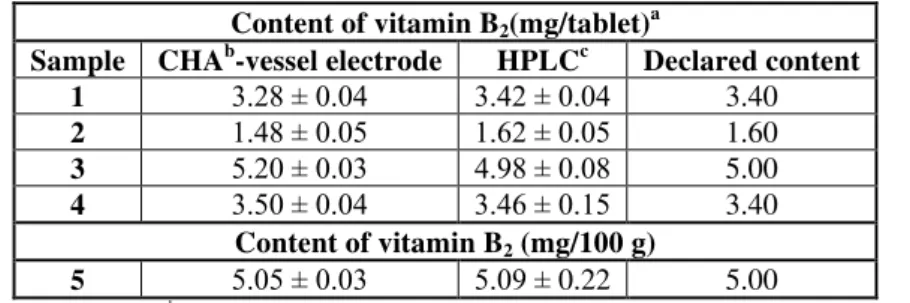
The contents of VB2 in the analysed samples determined by the present method and
HPLC method were in good agreement, i.e. for the 95% confidence level no statistically significant differences were observed (|t| = 0.18 < tCritical = 2.78). The paired t-test also
confirmed no statistically significant differences between the obtained results and the labeled specifications (|t| = 0.35 < tCritical = 2.78).
Preliminary investigations showed that it is possible to determine VB2 in various
drinks after simple preparation step (decarbonation, filtration, addition of the supporting electrolyte, pH adjustment).
Table 3. Declared and found contents of VB2 in pharmaceutical preparations calculated
by the proposed method and by HPLC
Content of vitamin B2(mg/tablet)a
Sample CHAb-vessel electrode HPLCc Declared content
1 γ.β8 ± 0.04 γ.4β ± 0.04 3.40
2 1.48 ± 0.05 1.6β ± 0.05 1.60
3 5.β0 ± 0.0γ 4.λ8 ± 0.08 5.00
4 γ.50 ± 0.04 γ.46 ± 0.15 3.40
Content of vitamin B2 (mg/100 g)
5 5.05 ± 0.0γ 5.0λ ± 0.22 5.00
aЦОКЧ vКХuО ± ЋD, Ч = γ; bchronopotentiometric analysis; cReference method. Samples: 1 and 2 - B complex
tablets, 3 and 4 - multivitamin with minerals tablets, 5 - multivitamnin granules
CONCLUSION
A rapid, convenient, accurate and precise chronopotentiometric method for determi-nation of vitamin B2 in pharmaceutical preparations was developed by using a glassy
car-bon vessel macroelectrode as a working electrode. The optimized experimental parame-ters were as follows: 0.017 V initial potential, -0.21 V final potential, reduction current
ТЧtОrvКХ ПrШЦ γ7.8 µA tШ 48.β µA ТЧ 5 МЦ3
of 0.025 mol/dm3 HCl supporting electrolyte solution. Under optimal experimental conditions, linear response of VB2 was observed in
the content range 0.05 - 4 mg/dm3 with a relatively low detection limit of 0.018 mg/dm3 provided by the large surface area of the used macroelectrode. LOD could be additionally decreased using an analyser able to impose higher values of reduction current, i.e. higher current densities, which could minimise chronopotentiogram extensions. The significant increase of the relative sensitivity of about 10 times (compared to the glassy carbon disc electrode) enables higher dilution of samples, which may decrease influences of the mat-rix. Therefore, smaller quantities of samples are needed for the analysis, contributing to the simplicity and fastness of the sample preparation procedure. The optimised method was successfully used to determine VB2 in pharmaceutical and dietary multivitamin
deter-mination in various samples, including food products, after an appropriate sample pre-paration procedure.
Acknowledgement
The financial support of the Ministry of Education, Science and Technological De-velopment of the Republic of Serbia (Project III 46009) is gratefully acknowledged.
REFERENCES
1. Petteys, B.J.; Frank E.L. Rapid determination of vitamin B2 (riboflavin) in plasma by
HPLC. Clin. Chim. Acta. 2011, 412, 38-43.
2. Ball, G.F.M. Vitamins in foods: analysis, bioavailability, and stability; CRC Press, Taylor & Francis Group, Boca Raton, FL, 2006; p. 165.
3. BКЧНžuМСШvп, L.; ŠОХОšШvsФп, Њ.; σКvrпtТХ, T.; CСýХФШvп, J.; σШvШtЧý, L. ЏШХtКЦОtrТМ monitoring of electrochemical reduction of riboflavin using silver solid amalgam electrodes. Electrochim. Acta. 2012, 75, 316-324.
4. Masek, A.; Chrzescijanska, E.; Zaborski, M.; Maciejewska, M. Characterisation of the antioxidant activity of riboflavin in an elastomeric composite. C. R. Chimie. 2012,
15, 524-529.
5. JuКrОг НОХ ЏКХХО, M.; LКТñШ, J.E.; ЋКvШв НО GТШrТ, G.; LОBХКЧМ, J.G. ЊТЛШПlavin producing lactic acid bacteria as a biotechnological strategy to obtain bio-enriched soymilk. Food Res. Int. 2014, 62,1015-1019.
6. ЋuturШvТć, Г.J; MКrУКЧШvТć, σ.J. CСrШЧШpШtОЧtТШЦОtrТМ КЧКХвsТs ШП tШМШpСОrШХs usТЧР К glassy carbon vessel as the working electrode. Microchem. J. 2002, 72, 131-135. 7. ŠvКrМ-GКУТć, J.; ЋuturШvТć, Г.; MКrУКЧШvТć, σ.; KrКvТć, Ћ. DОtОrЦТЧКtТШЧ ШП ЦОrМurв
by chronopotentiometric stripping analysis using a glassy carbon vessel as a working electrode. Electroanalysis. 2006, 18, 513-516.
8. ŠvКrМ-GКУТć, J.; ЋtШУКЧШvТć, Г.; ЋuturШvТć, Г.; MКrУКЧШvТć, σ.; KrКvТć, Ћ. DТrОМt ЦОr -cury determination in natural waters by chronopotentiometric stripping analysis in macroelectrode process vessel. Desalination 2009, 249, 253-259.
9. Brezo, T.; StojanШvТć, Г.; ЋuturШvТć, Г.; KrКvТć, Ћ.; KШs, J.; ĐurШvТć, A. ЋТЦpХО, rКpТН and selective chronopotentiometric method for the determination of riboflavin in pharmaceutical preparations using a glassy carbon electrode. Acta Chim. Slov. 2015,
62, 923-931.
10.ICH: Guidance for Industry, Q2B Validation of Analytical Procedures: Methodology; ICH, Rockville, MD, 1996.
Ђ
. 1, . 1, . 1
,
. 1, . 2, . 1
. Ђ 1
1 , , 1, β1000 ,
2 , , 1,
β1000 ,
ђ
( 2)
-.
-μ ,
-, .
0,1βЏ (AР/AРCХ, γ,5 ЦШХ/НЦ3KCХ) 0,0β5 ЦШХ/НЦ3 HCХ
-.
0,05-0,4 mg/dm3. 0,018 ЦР/НЦ3
ђ 0,054 mg/dm3.
, 10
. ђ HЈLC
-. ђ 2
-.
: 2,
,