Article
Printed in Brazil - ©2014 Sociedade Brasileira de Química0103 - 5053 $6.00+0.00A
*e-mail: [email protected], [email protected]
A Comparative Study Between Two Different Conventional Working Electrodes
for Detection of
∆
9-Tetrahydrocannabinol Using Square-Wave Voltammetry: a New
Sensitive Method for Forensic Analysis
Marco A. Balbino,*,a Izabel C. Eleotério,a Laura S. de Oliveira,a Matheus M. T. de Menezes,a
José Fernando de Andrade,a Antônio José Ipólitob and Marcelo F. de Oliveiraa
aDepartamento de Química, Faculdade de Filosofia, Ciências e Letras de Ribeirão Preto,
Universidade de São Paulo, 14040-901 Ribeirão Preto-SP, Brazil
bNúcleo de Perícias Criminalísticas de Ribeirão Preto, Superintendência de Polícia
Técnico-Científica do Estado de São Paulo, 14015-040 Ribeirão Preto-SP, Brazil
A maconha é uma das drogas ilícitas mais consumidas no mundo. Sendo assim, os traficantes têm procurado novos meios para mascarar o teste preliminar (colorimétrico) atualmente utilizado. Este trabalho descreve uma metodologia para detecção de delta-9-tetraidrocanabinol (∆9-THC)
por voltametria de onda quadrada (SWV) em meio orgânico N,N-dimetilformamida utilizando tetrafluoroborato de tetrabutilamônio (TBATFB) como eletrólito de suporte e eletrodos de trabalho de disco de carbono vítreo e platina. Aplicando-se um potencial de –0,5 ± 0,01 V vs. Ag/AgCl, KCl(sat), verifica-se um pico de corrente anódica após etapa de pré-concentração. Utilizando eletrodo de disco de carbono vítreo como eletrodo de trabalho, obteve-se uma dependência linear na faixa de concentração entre 1,0 × 10⁻⁹ mol L-1 a 2,2 × 10⁻⁸ mol L-1, com um coeficiente de correlação linear
em 0,999 e um limite de detecção de 6,2 × 10⁻¹⁰ mol L-1. Tais resultados apontam que a técnica
SWV, utilizando eletrodo de trabalho de disco de carbono vítreo, permite a análise qualitativa de ∆9-THC em concentrações maiores que 1,0 nmol L-1.
Marijuana is a widely consumed illicit drug. Therefore, drug dealers have sought new ways to mask its forensic (spot test) analysis. In this article we describe a methodology for delta-9-tetrahydrocannabinol (∆9-THC) detection by square-wave voltammetric (SWV) analysis in organic
medium (N,N-dimethylformamide) using tetrabutylammonium tetrafluoroborate (TBATFB) as supporting electrolyte, and glassy carbon and platinum disc as working electrode. Applying a potential of –0.5 ± 0.01 V vs. Ag/AgCl, KCl(sat), we detected a well-defined anodic peak current
after the pre-concentration step; ∆9-THC detection presented linear dependence at concentrations
ranging from 1.0 × 10⁻⁹ mol L-1 to 2.2 × 10⁻⁸ mol L-1, with a linear correlation coefficient 0.999
and a detection limit of 6.2 × 10⁻¹⁰ mol L-1, using the glassy carbon disc working electrode. These
results confirm that optimized SWV technique using glassy carbon disc working electrode enables qualitative analysis of ∆9-THC at concentrations higher than 1.0 nmol L-1.
Keywords: square-wave voltammetry, tetrahydrocannabinol, forensic science, marijuana
Introduction
Illicit drugs are substances that change one’s perception and feelings by stimulating, depressing, or disturbing the central nervous system. They can be classified as depressants (barbiturates, alcohol, and opiates), stimulants (nicotine, cocaine, crack, cocaine, and amphetamines), hallucinogens (lysergic acid, LSD), disturbing (marijuana derivatives), and mixed-action
drugs (ecstasy) depending on their effect on the central nervous system.1 Illicit drug abuse is a global concern
because it poses risks to human health.2,3
Marijuana is a plant that contains over 400 chemicals. A series of compounds containing 21 carbon atoms each accounts for its biological activity. More specifically, this plant displays over 60 different cannabinoids with terpene phenolic structures that have not been isolated from any other plant or animal species. ∆9-tetrahydrocannabinol
(∆9-THC) is a molecule of forensic interest because it
Physiological and psychological effects of ∆9-THC are
discernible soon after marijuana consumption settles a few minutes, and it reaches maximum concentration in the brain within 15 minutes. If inhaled or administered intravenously, cannabinoids spread through the organism and affect the brain, lungs, liver, kidneys, and ovaries.5
∆9-THC acts on
the central nervous system receptors located in specific regions of the brain called CB1. These areas are responsible for motor activity, posture, memory, cognition, emotion, sensory perception, endocrine and autonomic functions, and peripheral nerve functioning; their activation inhibits the release of neurotransmitters in the heart, bladder, and bowel.6,7
∆9-THC also affects CB2 receptors, which occur in
spleen macrophages and play an important immunological role.5 However,
∆9-THC leads to low mortality rates: the
brainstem, which controls vital functions, lacks ∆9-THC
receptors.7
In forensic analysis, ∆9-THC can be identified
by instrumental techniques such as liquid and gas chromatography, spectroscopy, and colorimetric tests. Police forces worldwide use a colorimetric test to initially identify ∆9-THC and other cannabinoids in seized samples.
This test consists in extracting cannabinoids with organic solvents such as hexane or methanol and adding the Fast Blue B salt C14H12Cl2N4O2.ZnCl2 to the resulting
solution.8 A coupling reaction between
∆9-THC and other
cannabinoids with Fast Blue B salt generates a deep red or purple chromophore with the active ingredients of the substance of forensic interest.
Analytical techniques can help identify drugs of abuse according to the recommendation of United Nations (UN) and the Drug Enforcement Administration (DEA) Scientific
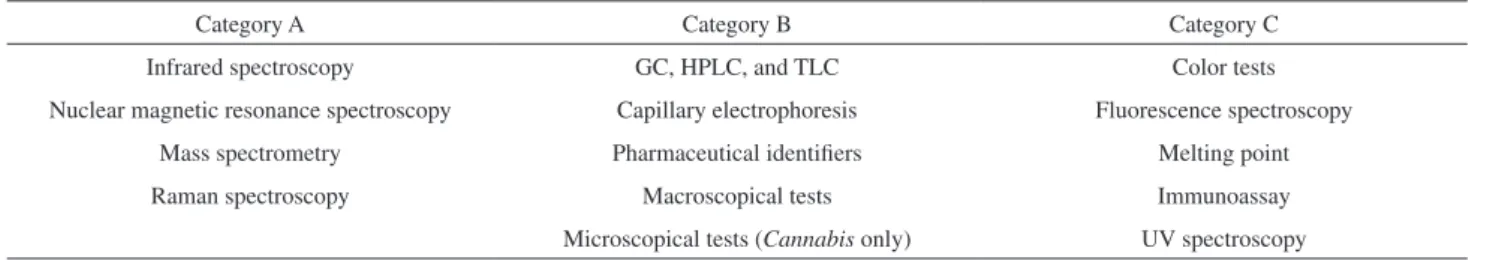
Working Group for the Analysis of Seized Drugs, named “SWGDRUG”. These techniques comprise three categories: A, B, and C (Table 1). However, to identify illicit substances it is necessary to employ one (or two) techniques belonging to class A and another technique belonging to class B or C. If class A technique is not available, two (or three) class B techniques and one class C technique should be used (Table 1).9
Electroanalytical techniques aid analysis of a wide range of substances in different areas.10-14 These techniques
are simple, easy to miniaturize, highly sensitive, specific, fast, and inexpensive, so they are an interesting alternative for detection of electroactive species. Electrochemical techniques demand lower amounts of chemicals as compared with chromatographic techniques. Additional advantages are their good analytical frequency and the possibility to apply them to handheld field analysis devices.15
Electrochemical methodologies can be used to detect illicit drugs. Several studies have used electrochemical analysis to detect cocaine in seized samples, for instance.12,15-17 In the context of marijuana, cyclic and
linear sweep voltammetry was applied for direct analysis of ∆9-THC using glassy carbon electrode. It was observed
an anodic peak at 0.0 V after pre-concentration step in 30 seconds.18 Combining voltammetric analysis with
pre-concentration step offers higher sensitivity and allows determination of trace compounds in different matrices.19-21
Square wave voltammetry (SWV) is a pulse voltammetric technique where the current peak stems from overlapping pulses at high potential (pulse amplitude). The limits of detection are comparable to those of the chromatographic and spectroscopic techniques.11
Several studies have demonstrated optimization of marijuana production in tropical countries.7 Therefore, it
is necessary to develop even more sensitive and fast ways to detect ∆9-THC in seized samples apprehended by the
police forces.
Therefore, the aim of this research was to develop and to optimize a square-wave voltammetric method for determination of ∆9-THC in seized samples using glassy
carbon and platinum as working electrodes.
Figure 1. Molecular structure of ∆9-THC.
Table 1. Recommended techniques for the analysis of seized drugs of abuse9
Category A Category B Category C
Infrared spectroscopy GC, HPLC, and TLC Color tests
Nuclear magnetic resonance spectroscopy Capillary electrophoresis Fluorescence spectroscopy
Mass spectrometry Pharmaceutical identifiers Melting point
Raman spectroscopy Macroscopical tests Immunoassay
Experimental
Reagents and samples
∆9-THC samples were provided through a cooperation
between this research group and the laboratory of toxicological analysis, Institute of Criminalistics, Ribeirão Preto, São Paulo state, Brazil. A standard sample of 3.2 × 10⁻³ mol L-1
∆9-THC (Cerrilliant®) in
methanol was employed. The supporting electrolyte used during the electrochemical analyses was prepared with tetrabutylammonium tetrafluoroborate (TBATFB), by addition of 0.66 g TBATFB into a 100 mL volumetric flask.
N,N-dimethylformamide (DMF) and deionized water 9:1 (v/v) were added to the flask containing TBATFB, giving a supporting electrolyte solution in DMF/water at 9:1 (v/v), resulting in a final TBATFB concentration of 0.1 mol L-1.
In order to remove electroactive oxygen from the solution, the supporting electrolyte solution was previously purged with nitrogen gas for 15 minutes.
Preparation of the standard ∆9-THC solution
For voltammetric analysis, 1 mL of a 3.2 × 10⁻³ mol L-1
∆9-THC standard solution was evaporated to remove
methanol present in the solution. Next, 25 mL DMF were added, giving a final ∆9-THC concentration of
1.1 × 10⁻⁶ mol L-1.
Square-wave voltammetry (SWV)
SWV experiments were carried out on a potentiostat from Autolab, model PGSTAT 128N, coupled to a microcomputer. A 5.0 mL conventional electrochemical cell was employed. The electrode arrangement consisted of a working electrode (glassy carbon and platinum disc, 2 mm diameter, from Metrohm), an Ag/AgCl (saturated aqueous KCl) reference electrode, and a spiralized platinum auxiliary electrode. The potential scans were performed between –0.3 and 0.3 V for glassy carbon working electrode. Square-wave amplitude of 100 mV and a frequency of 12 Hz were optimized and used in all SWV experiments. Measurements were performed in triplicate and sextuplicate (for intra-day and inter-day assay precision accuracies).
Preparation of the working electrodes
The working electrodes were polished to a mirror-like appearance with alumina powder, rinsed with water, cleaned in an ultrasonic aqueous bath, and rinsed again with water before use.
Purification of the ∆9-THC present in the marijuana samples
seized by the police by thin layer chromatography (TLC)
This technique was used for pre-purification. TLC silica plates (Whatman®) containing a fluorescent indicator UV (254 nm) were employed. The eluent was hexane/ methanol 8:2 (v/v). A shortwave UV light device was used to locate the spot containing ∆9-THC. The analyte was
conditioned after grating, dilution in DMF, and filtering (for chromatographic silica separation).
Comparative HPLC analyses
Reversed phase high performance liquid chromatography (HPLC) analyses of the marijuana sample were performed for comparison with voltammetric analyses. They were carried out on a Thermo Scientific® Dionex Ultimate
3000 coupled with a microcomputer and a photodiode-array detector (DAD) for detection. Stationary phase was Ace® C18 (250 mm, 6 µm), mobile phase was constituted
of methanol (LiChrosolv®) and water (9:1, v/v), and was
previously filtered through a 0.45 mm filter (Milipore, Milex®) and degassed by an ultrasonic device. An isocratic
mode was applied for HPLC analyses. The total runtime was 15 min. A wavelength detector was selected at 209 nm, flow rate of 1.0 mL min-1, 20 µL injection volume of
analytes. All analyses were carried out at 30 °C.
Results and Discussion
Choice of supporting electrolyte and solvent
DMF/water 9:1 (v/v) as solvent and 0.1 mol L-1 TBATFB
as supporting electrolyte proved to be effective in the potential range –0.5 to 1.2 V vs. Ag/AgCl, KCl(sat) for glassy
carbon working electrode. Non-faradaic peak currents were significantly in this medium (see Figure 2). The supporting electrolyte provided better degree of ionization as well as chemical and electrochemical stability and the selected DMF/water solvent was selected because both analyte and supporting electrolyte are highly soluble in this medium.18
Accumulation time
The instrumental parameters were optimized after applying potential amplitude of 100 mV and a frequency of 12 Hz, and potential range from –0.3 to 0.3 V vs. Ag/AgCl, KCl(sat). We studied the effect of different accumulation times. First, we applied an electric negative potential to pre-concentrate the electroactive species of the ∆9-THC
SWV analysis, applied potentials above –0.5 V did not increase the anodic peak current, whereas potentials below –1.2 V did not increase the anodic peak current signals. In this context, the anodic current peaks due to the presence of ∆9-THC in solution were time-dependent at an applied
potential of –0.5 V, which created an accumulation of electroactive species on the electrode surface.18
We obtained square-wave voltammograms for the
∆9-THC species at different time intervals between 0 and
120 s. The anodic peak current increased linearly up to 30 s, reaching a plateau thereafter. This time dependence indicates that, after adsorption step on the electrode surface and subsequent anodic potential scan, it is possible to produce the oxidation of the phenol group22-24 of
∆9-THC
in one electron process.18,25
We conducted further measurements using an accumulation time of 30 s and an applied potential of –0.5 V. Initially, we tested a low concentration (18 nmol L-1)
of ∆9-THC in the electrochemical cell and recorded the
square wave voltammogram using a glassy carbon electrode (Figure 3) and platinum electrode (Figure 4), which furnished an anodic peak current at ±0.025 V vs. Ag/AgCl, KCl(sat), after accumulation time of 10 s.
Influence of ∆9-THC concentration
We recorded voltammograms for different ∆9-THC
concentrations by successively adding the ∆9-THC standard
solution to the electrochemical cell and determined the best concentration range for the glassy carbon and platinum working electrodes.
SWV analysis using the glassy carbon disc electrode
Figure 5 shows the voltammograms obtained using the glassy carbon disc working electrode. It is possible to carry
out pre-concentration step studies at concentrations in the range of nmol L-1 for an accumulation time of 30 s.18 We
investigated ∆9-THC concentrations ranging from 1.0 × 10⁻⁹
to 2.0 × 10⁻⁸ mol L-1 and detected a current peak after adding
2.0 × 10⁻⁹ mol L-1 (10 µL)
∆9-THC standard solution in the
electrochemical cell. We found that the concentration of the analyte is proportional to the peak current and verified a well-resolved peak after addition of 1.2 × 10⁻⁸ mol L-1
∆9-THC standard solution to the electrochemical cell using
a potential range of –0.3 to 0.3 V vs. Ag/AgCl, KCl(sat), a potential amplitude of 100 mV, and a frequency of 12 Hz. Figure 5 depicts the anodic peak current (ipa) analytical curve vs. ∆9-THC concentration in the electrochemical
cell.Analyte accumulation upon application of a potential of –0.5 V increased the sensitivity of the amperometric analytical signal (m) at 1.00 µA mol L-1, showing that the
voltammetric determination of ∆9-THC can be conducted in
nmol L-1. The analytical curve displayed good linearity over
the concentration range of 2.0 × 10⁻⁹ to 2.1 × 10⁻⁸ mol L-1. Figure 2. Square wave voltammogram of the supporting electrolyte
(TBATFB) 0.1 mol L-1 in DMF/water 9:1 (v/v) using glassy carbon (---)
and platinum (__) disc working electrode. Amplitude potential: 100 mV;
frequency: 12 Hz.
Figure 3. Square-wave voltammogram at different times of analyte accumulation using a glassy carbon disc working electrode. Supporting electrolyte: TBATFB in DMF/water 9:1 (v/v); ∆9-THC standard solution in
the electrochemical cell: 1.8 × 10⁻⁸ mol L-1; amplitude potential: 100 mV;
frequency: 12 Hz. Inset: anodic peak current (ipa) vs. time.
Figure 4. Square-wave voltammogram at different accumulation times using a platinum disc working electrode. Supporting electrolyte: TBATFB in DMF/water 9:1 (v/v); ∆9-THC standard solution in the electrochemical
cell: 1.8 × 10⁻⁸ mol L-1; amplitude potential: 100 mV; frequency: 12 Hz.
The linear correlation coefficient (r) and a standard deviation (SD) value were 0.999 and 0.21 µA, respectively; the corresponding equation was:
ipa = 0.81 µA + 1.02 × 10⁹ µA (in mol L-1∆9-THC) (1)
These results allowed for a limit of detection (LOD) of 6.2 × 10⁻¹⁰ mol L-1 and a limit of quantification (LOQ) of
2.1 × 10⁻⁹ mol L-1 using the relations 3SD/m and 10SD/m,
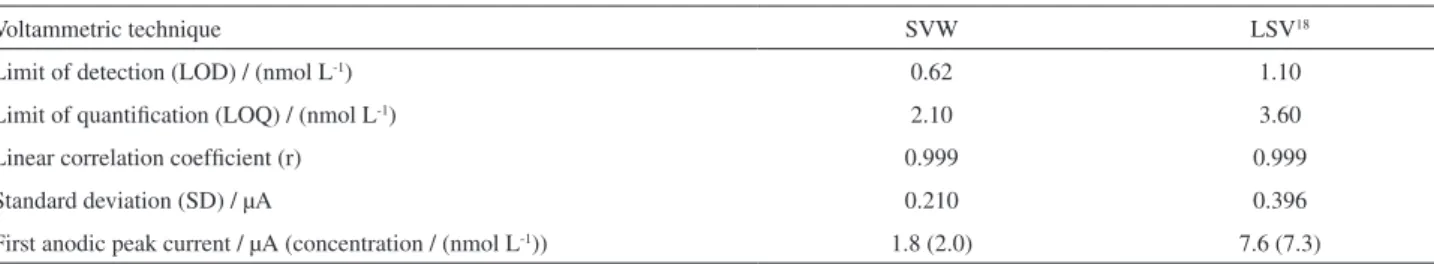
respectively, where m is the amperometric sensitivity of the curve.12,18-21 These results showed that SWV technique
is more sensitive than linear sweep voltammetry (LSV) technique (described in the literature)18 for
∆9-THC
analysis when glassy carbon disc work electrode is used. The comparative of LOD and LOQ values reported in the literature18 is given in Table 2.
SWV analysis using the platinum disc electrode
We applied, as experimental conditions, a potential of –0.5 V vs. Ag/AgCl, KCl(sat) for anodic stripping and the voltammograms were recorded in a work range from –0.3 to 0.3 V vs. Ag/AgCl, KCl(sat). We investigated
∆9-THC concentrations ranging from 1.0 × 10⁻⁹ to
4.0 × 10⁻⁸ mol L-1. The analyte concentration was
proportional to the peak current. The anodic peaks were not well-defined as in the case of the glassy carbon working electrode (see Figure 6). However, we observed a peak current at 0.014 V vs. Ag/AgCl, KCl(sat) after the
accumulation time and addition of 8.0 × 10⁻⁹ mol L-1
(40 µL) ∆9-THC standard solution to the electrochemical
cell. The anodic peak current (ipa) analytical curve vs.
∆9-THC concentration using the platinum disc working
electrode was plotted. ∆9-THC pre-concentration step by
application of a negative potential of –0.5 V contributed to increased sensitivity of the amperometric analytical signal (m) obtained at 0.24 µA nmol L-1 and allowed us
to conduct the voltammetric determination of ∆9-THC in
nmol L-1. The corresponding analytical curve presented
good linearity over concentrations ranging from 8.0 × 10⁻⁹
to 4.0 × 10⁻⁸ mol L-1. We obtained a linear correlation
coefficient (r) and a standard deviation (SD) value of 0.992 and 1.45 µA for this dependence, respectively; the corresponding equation was:
ipa = –0.05 µA + 1.6 × 10⁸ µA (in mol L-1∆9-THC) (2)
These results afforded a limit of detection (LOD) of 2.7 × 10⁻⁸ mol L-1 and a limit of quantification (LOQ) of
9.0 × 10⁻⁸ mol L-1 using the relations 3SD/m and 10SD/m, Table 2. Values of LOD and LOQ for ∆9-THC analysis obtained by SWV technique and LSV technique using glassy carbon disc work electrode
Voltammetric technique SVW LSV18
Limit of detection (LOD) / (nmol L-1) 0.62 1.10
Limit of quantification (LOQ) / (nmol L-1) 2.10 3.60
Linear correlation coefficient (r) 0.999 0.999
Standard deviation (SD) / µA 0.210 0.396
First anodic peak current / µA (concentration / (nmol L-1)) 1.8 (2.0) 7.6 (7.3)
Figure 5. Square-wave voltammogram referring to successive additions
of 1.1 × 10⁻⁶ mol L-1
∆9-THC standard using the supporting electrolyte
TBATFB in DMF/water 9:1 (v/v). Working electrode: glassy carbon disc. Amplitude potential: 100 mV, frequency: 12 Hz; potential range: –0.3 to 0.3 V vs. Ag/AgCl, KCl(sat). Inset: ipa analytical curve vs. concentration
of ∆9-THC.
Figure 6. Square-wave voltammogram referring to successive additions of 1.1 × 10⁻⁶ mol L-1
∆9-THC standard using the supporting electrolyte
TBATFB in DMF/water 9:1 (v/v). Working electrode: platinum disc. Amplitude potential: 100 mV, frequency: 12 Hz; potential range: –0.3 to 0.3V vs. Ag/AgCl, KCl(sat). Inset: ipa Analytical curve vs. concentration
respectively, where m is the amperometric sensitivity of the curve.12,18,20
Comparison between the voltammetric results of the two different working electrodes
After voltammetric analyses of ∆9-THC standard,
we proposed a voltammetric analysis of a ∆9-THC
seized sample. A ∆9-THC seized sample solution had
the same concentration of ∆9-THC standard solution
(1.1 × 10⁻⁶ mol L-1). However, a previous thin layer
chromatography (TLC) is required to purify the extract. Other cannabinoids such as cannabinol and cannabidiol can affect the results, increasing the current peak or displacing the peak potential by 0.14 V. The phenol group is present in these substances. Figure 7 shows voltammograms when two different disc work electrodes are used.The results indicate a similar voltammetric response as a voltammogram of
∆9-THC standard solution. Voltammetric measurements
showed the relevant influence between the voltammetric signal and the ∆9-THC concentration in the cell electrode.
∆9-THC concentrations ranging from 5.0 × 10⁻¹⁰ to
4.0 × 10⁻⁸ mol L-1 were investigated. The anodic peak
current were well-defined at 0.00 V vs. Ag/AgCl, KCl(sat), after addition of 1.2 × 10⁻⁹ mol L-1 (glassy carbon disc
working electrode) and –0.01 V vs. Ag/AgCl, KCl(sat), after addition of 2.2 × 10⁻⁸ mol L-1 (platinum disc work
electrode).
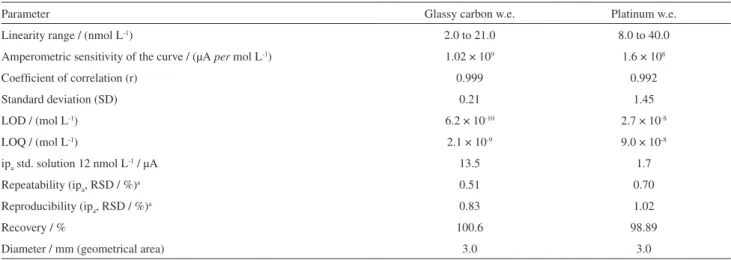
Table 3 reveals that the glassy carbon disc working electrode is highly sensitive, enabling detection of lower
∆9-THC concentrations than the platinum disc working
electrode. Under optimized procedure conditions, two commercial working electrodes showed good linearity (confirmed with statistical Student t-test). The recoveries
varied from 98 to 100.6%, with confidence interval based on 95%. According to F-test and Student t-test used to compare ipa values, the variance and means between two
work disc electrodes is significantly different (at 95% confidence level). Values of limit of detection (LOD),
Table 3. SWV results of two different commercial work electrodes (w.e.) for ∆9-THC analysis
Parameter Glassy carbon w.e. Platinum w.e.
Linearity range / (nmol L-1) 2.0 to 21.0 8.0 to 40.0
Amperometric sensitivity of the curve / (µA per mol L-1) 1.02 × 10⁹ 1.6 × 10⁸
Coefficient of correlation (r) 0.999 0.992
Standard deviation (SD) 0.21 1.45
LOD / (mol L-1) 6.2 × 10⁻¹⁰ 2.7 × 10⁻⁸
LOQ / (mol L-1) 2.1 × 10⁻⁹ 9.0 × 10⁻⁸
ipa std. solution 12 nmol L-1 / µA 13.5 1.7
Repeatability (ipa, RSD / %)a 0.51 0.70
Reproducibility (ipa, RSD / %)a 0.83 1.02
Recovery / % 100.6 98.89
Diameter / mm (geometrical area) 3.0 3.0
aFor 6 measurements.
Figure 7. Square-wave voltammogram referring to successive additions
of 1.1 × 10⁻⁶ mol L-1
∆9-THC seized sample solution using the supporting
limit of quantification (LOQ), standard deviation (SD), linear correlation coefficient (r), amperometric sensitivity of the curve and standard solution peak current after addition of 1.2 × 10⁻⁸ mol L-1
∆9-THC standard solution
(ipa std. solution) were compared. The ratio of LOD and
LOQ values obtained with glassy carbon disc electrode is 48 times (approximately) higher than the platinum disc work electrode. Addition of 1.2 × 10⁻⁸ mol L-1
∆9-THC
standard solution to the electrochemical cell affords 6.43 fold higher ipa values for the glassy carbon disc working electrode as compared with the platinum disc working electrode. These working disc electrodes have the same geometrical area.
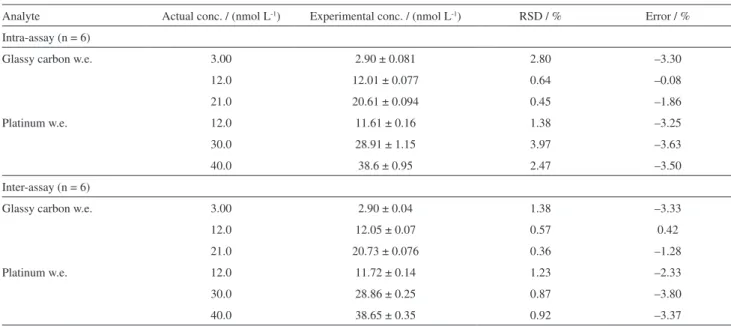
Values of repeatability and reproducibility are reported in Table 4. For intra-assay precision, six successive measurements (n = 6) were performed and calculated during one day; inter-assay precision was performed between 6 days during one week. Intra-assay and inter-assay results were expressed as:
%RSD = (standard deviation / experimental
concentration) × 102 (3)
The error (%) values were calculated as (experimental concentration / actual concentration) × 102. This step
was performed for glass carbon disc work electrode and platinum disc work electrode for three different concentrations of ∆9-THC solution (see Table 4). The
accuracy results were between 96 and 100.5%.
A certified ∆9-THC standard solution was diluted into
different concentrations and analyzed at concentrations ranging from 3.2 × 10⁻⁶ to 3.2 × 10⁻⁴ mol L-1. A well-defined
peak for ∆9-THC was visualized at a retention time of
9.1 min. The recovery efficiencies curve was calculated between 98.1% and 100.8%, considering the value of the concentration in the analytical curve. The relationship between the registered signal and the concentration of the ∆9-THC species was linear over the whole interval
investigated, with a correlation coefficient of 0.999, a limit of detection (LOD) of 11 µmol L-1 and a limit of quantification
(LOQ) of 36 µmol L-1. The ∆9-THC contained in the seized
marijuana samples was 3.7% (m/m), with relative standard deviation (RSD) value of 0.03% (see Table 5). However, the consumption of chemicals and the analytical frequency is 40 times higher than the proposed voltammetric methodology.
Table 4. Accuracy and precision data for ∆9-THC by the proposed SWV technique using two different commercial work electrodes (w.e.)
Analyte Actual conc. / (nmol L-1) Experimental conc. / (nmol L-1) RSD / % Error / %
Intra-assay (n = 6)
Glassy carbon w.e. 3.00 2.90 ± 0.081 2.80 –3.30
12.0 12.01 ± 0.077 0.64 –0.08
21.0 20.61 ± 0.094 0.45 –1.86
Platinum w.e. 12.0 11.61 ± 0.16 1.38 –3.25
30.0 28.91 ± 1.15 3.97 –3.63
40.0 38.6 ± 0.95 2.47 –3.50
Inter-assay (n = 6)
Glassy carbon w.e. 3.00 2.90 ± 0.04 1.38 –3.33
12.0 12.05 ± 0.07 0.57 0.42
21.0 20.73 ± 0.076 0.36 –1.28
Platinum w.e. 12.0 11.72 ± 0.14 1.23 –2.33
30.0 28.86 ± 0.25 0.87 –3.80
40.0 38.65 ± 0.35 0.92 –3.37
Table 5. Comparative values obtained (in triplicate) by the voltammetric (SWV) and chromatographic (HPLC) methods for quantitative analysis of ∆9
-THC in marijuana samples seized by the police
Technique Work electrode ∆9-THC / % (m/m) RSD / % CoV / %
SWV Glassy carbon 3.5 0.02 0.57
SWV Platinum 3.4 0.08 2.35
HPLC – 3.7 0.03 0.81
Conclusions
SWV analysis of ∆9-THC is useful to determine low ∆9-THC concentrations (about 1.0 nmol L-1) when using
glassy carbon or platinum disc working electrodes. An accumulation time of 30 s is considered ideal for ∆9-THC
analysis, which can be quantitative assayed by the analytical curve method, offering an important comparison parameter for forensic investigation. These results have been demonstrated to be more sensitive than the other voltammetric methods reported in the literature for ∆9-THC
analysis when glassy carbon work electrode is used. To the best of our knowledge, this is the first work on the direct determination of ∆9-THC by square-wave voltammetric
technique. At last, these results showed that voltammetric analysis might be useful in forensic analysis for drug detection using different work electrodes.
Acknowledgements
The authors acknowledge Fundação de Amparo à Pesquisa do Estado de São Paulo (FAPESP, Process 2012/00084-7) for financial support. The authors also thank Dr. Cynthia Maria de Campos Prado Manso, who revised and edited the text.
References
1. http://www.imesc.sp.gov.br/infodrogas/classifi.htm accessed in February 2014.
2. Postigo, C.; de Alda, L. M.; Barceló, D.; Environ. Int.2011, 37, 49.
3. http://www.unodc.org/documents/wdr/WDR_2009/WDR2009_ eng_web.pdf accessed in February 2014.
4. Stephens, R. S. In Addictions: A Comprehensive Guidebook; McCrady, B. S.; Epstein, E. E., eds.; Oxford University Press: Oxford, 1999, pp. 121-139.
5. Simões, C. M .O.; Schenckel, E. P.; Gosmann, G.; de Mello, J. C. P.; Mentz; L. A.; Petrovick, P. R.; Farmacgonosia, da Planta ao Medicamento, 6a ed.; UFRGS/UFSC: Florianópolis,
Brasil, 2007.
6. Drummer, O. H.; Odell, M.; The Forensic Pharmacology of Drugs of Abuse; Arnold: London, England, 2001.
7. Compton, R. G.; Goodwin, A.; Banks, C. E.; Electroanalysis,
2006, 18, 1063.
8. Bell, S.; Forensic Chemistry, 1st ed.; Prentice Hall: New Jersey,
USA, 2006.
9. Velho, J. A.; Geiser, G. C.; Espindula, A.; Ciências Forenses: Uma Introdução as Principais Áreas da Criminalística Moderna, 1a ed.; Millennium: Campinas, Brasil, 2012.
10. Okumura, L. L.; Saczk, A. A.; de Oliveira, M. F.; Fugêncio, A. C. C.; Torrezani, L.; Gomes, P. E. N.; Peixoto, R. M.; J. Braz. Chem. Soc.2011, 22, 652.
11. Souza, D.; Machado, S. A. S.; Avaca, L. A.; Quim. Nova2003, 26, 81.
12. Oye, E. N.; de Figueiredo, N. B.; de Andrade, J. F.; Tristão, H. M.; de Oliveira, M. F.; Forensic Sci. Int.2009, 192,94.
13. Kizek, R.; Trnkova, L.; Palecek, E.; Anal. Chem.2001, 73, 4801.
14. Adam, V.; Zehnalek, J.; Petrlova, J.; Potesil, D.; Sures, B.; Trnkova, L.; Jelen, F.; Vitecek, J.; Kizek, R.; Sensors 2005, 5,
70.
15. Pavlova, V.; Mirceski, V.; Komorsky-Lovric, Š.; Petrovska-Jovanovic, S.; Mitrevski, B.; Anal. Chim. Acta2004, 512, 49. 16. Fernandez-Abedul, M. T.; Rodriguez, J. R. B.; Electroanalysis,
1991, 3, 409.
17. Fernandez-Abedul, M. T.; Costa-Garcia, A.; Anal. Chim. Acta
1996, 328, 67.
18. Balbino, M. A.; de Menezes, M. M. T.; Eleotério, I. C.; Saczk, A. A.; Okumura, L. L.; Tristão, H. M.; de Oliveira, M. F.; Forensic Sci. Int.2012, 221, 29.
19. Czopa, E.; Economoua, A.; Bobrowski, A.; Electrochim. Acta
2011, 56, 2206.
20. El-Desoky, H. S.; Ghoneim, M. M.; Abdel-Galeil, M. M.; J. Braz. Chem. Soc. 2010, 21, 669.
21. Stradiotto, N. R.; Yamanaka, H.; Zanoni, M. V. B.; J. Braz. Chem. Soc.2003, 14, 159.
22. Rosatto, S. S.; Freire, R. S.; Duran, N.; Kubota, L. T.; Quim. Nova2001, 24, 77.
23. King, W. P.; Joseph, K. T.; Kissinger, P. T.; J. Assoc. Off. Anal. Chem.1980, 63, 137.
24. Burestedt, E.; Narvaez, A.; Ruzgas, T.; Gorton, L.; Emneus, J.; Domingues, E.; Marko Varga, G.; Anal. Chem.1996, 68, 1605.
25. Yamakura, S. In The Chemistry of Phenols; Rappoport, Z., ed.; John Wiley & Sons: West Sussex, 2003.
Submitted: September 10, 2013 Published online: February 14, 2014