Electric properties of granitic rocks
H.G. Silva, M. Tlemçani, A. Albino, M. Bezzeghoud, R. N. Rosa, B.
Caldeira, J.F. Borges
Geophysics Centre of Évora and Physics Department, ECT, University of Évora, Portugal
Abstract
The objective of this work is to clarify the role of water content on the charge trans-port mechanisms of different granitic rocks. The mineralogical content of the rocks will also be taken into account. From the electrical point of view these materials are rather insulating porous media where charge injection creates different phenomena like build-up charges, space charge limited currents, surface effects and other behav-iors that resemble much a variety of oxides, like AlO.
1. Introduction
Interesting electric properties of rocks are a result of their behaviour as both conductor and dielectric. In fact, dielectric behaviour of rocks is being used for decades in different logging tools, Garrouch et al. (2009), to determine the water content in oil and gas wells, Kenyon et al. (1994). Additionally, these properties can also be used in rock-type classification, Garrouch et al. (2009). Moreover, recently these properties have become of capital importance in lithosphere exploration using electromagnetic techniques like ground-penetrating radar (GPR), Reppert et al. (2000). Furthermore present investi-gations, Freund et al. (2006), have shown interesting pressure stimulated cur-rents, Vallianatos et al. (2008), and voltages, Aydin et al. (2009), that could have some implications in the so called seismo-electromagnetic phenomena, Uyeda et al. (2009). For that reason electric properties of rocks are now re-ceiving a highly relevant research effort.
The earlier studies in this area were done by P. Sen and co-works, Sen (1981) and Chew and Sen (1982), who gave a very important contribution to it. These works were focused in the anomalously high values of the real part of the dielectric constant, ', at low frequencies and authors presented different models to explain such behaviour. Later studies have considered the effect of water in porous media like calcite rocks, Kenyon et al. (1994), and artificial porous glass specimen, Haslund et al. (1994). In this work we will follow this perspective by measuring the electrical properties of different granitic rock
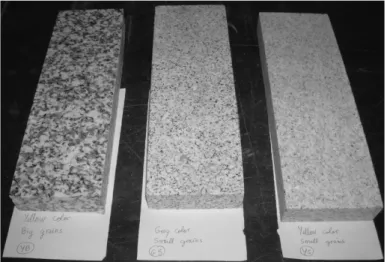
types (initially there types will be considered, presented in Fig. 1) varying the content of water in four samples of the same rock class. The simplified classi-fication of the different rocks is as follows: 1) the left most rock of Fig. 1 is a coarse grained biotitic granite, yellow coloured and characterized by an abun-dance of large feldspar megacrystals usually showing poorly defined shapes (abbreviated to Yellow Coarse, YC); 2) the middle one is a quartz diorite grey coloured and medium grained rock with homogeneous appearance, domi-nantly biotitic (reduced in waht follows to Grey Medium, GM); 3) the right one is a medium grained homogeneous granite, with light rosy colour deter-mined by the tonality of the feldspar crystals that stand out from a greyish with matrix containing dark grains (condensed to Rose Medium, RM). The results will be discussed in terms of local porosity, Kenyon et al. (1994) and Haslund et al. (1994), and fractal geometry of the fissures network, Miguel et
al. (2000).
Fig. 1. Picture of the three granitic rock types considered in this work.
In addition, the measurements will be done using a recent digital-signal processing algorithms based on Personal Computer and analog to digital converters. The algorithms are based on ellipse fitting for the extraction of the acquired sine signal parameters so that the impedance magnitude and phase can be determined, Ramos et al. (2009).
2. Experimental
The experimental work is divided in two parts, first the samples will be pre-pared with different water contents and then different electrical measure-ments are preformed in order to clarify the charge transport measuremeasure-ments.
2.1. Rock samples preparation
Granitic rock samples are prepared with geometry 9×9×3 cm3. Figure 2 shows a photograph of a typical sample. The top and down squared sides of the samples, after the preparation process (described below), will be covered with conductive silver paint to act as electrodes. With this method it is ex-pected that we could reduce the low-frequency electrode polarization effect.
Fig.2. Photograph of a typical sample used in the research process.
The preparation process is as follows, after being cut all samples are heated up from room-temperature (RT) in low vacuum to 150 ºC and then they are cooled down to RT to the effect of being completely dried. The samples are then left in a desiccator containing dry silica gel. Afterwards, the samples are subjected at a fixed RT to isothermal adsorption of water. One sample from each lot is not subjected to this process to be left completely dry for compari-son.
Isothermic adsorption equilibrium curves for water vapor in the rock sam-ples is obtained by placing the samsam-ples in different ambient conditions with variable relative humidity (RH) and monitoring the samples weight (using a precision balance with 1 mg resolution) and the dielectric constant until no further changes were detected on both, this process takes approximately one to two weeks. Once the samples are saturated with a given content of water
(depending on the RH that the adsorption process occurred) the following measurements are performed.
2.2. Measurements
Based on our previous work in rather insulating materials, Silva et al. (2009a,b), we have elaborated the following set of measurements:
Current-Voltage characteristics (I-V): it is planned that this measurements
will be done at fixed (stabilized) temperatures ranging from −60 ºC, below the common fusion point of water and near its supercooled state transition, Go-mes et al. (2006), to 150 ºC, above its evaporation point. Due to the high re-sistance of the samples, low-current/high-rere-sistance picoammeter/voltage source equipments are required. The voltage ramps are expected to be con-trolled automatically by a program with several parameters: voltage step typi-cally V ∼ 0.1 V, trigger time t ∼ 100 ms, maximum, Vmax, and minimum
voltages, Vmin, and initial voltage, VI , normally set to zero. The voltage cycles
will be as follows: starting from VI up to Vmax, then down to Vmin and finally
to VI again. The current passing through the samples is expected to vary
strongly with the water content.
Current versus Temperature (I-T): it is expected to be obtained by
con-tinuously changing the temperature at a typical rate of ∼1 ºC/min from −60 ºC to 150 ºC. Both current measurement and DC voltage biasing, typically V = 20 V, can be made with the use of a picoammeter/voltage source instru-ment.
Impedance spectroscopy ( -f): it is projected to be done with the
applica-tion of a stabilizing (fixed throughout the measurement) DC bias input signal, up to ∼50 V, modulated by an AC test signal. The test signal level typically varies between 10 mV to ∼2 V. The frequency is varied in the range of inter-est from 1 Hz to 1 MHz. The temperature conditions are the same as the I-V measurements. The measured samples are modeled through a capacitance (C) and resistance (R) parallel association, Fig. 3, so that the real and imaginary parts of the complex dielectric constant:
(1) can be written, defining ' = d/A×C, '' = / and normalizing them to the permittivity of vacuum K* = */ 0, through simplified expressions:
(2b) here Z is the complex impedance, is its phase, the angular frequency, A the electrodes area, and d the distance between them. Please notice that the dielectric constant is the result of the measurements, not of a model. The R and C association model is useful only if the results prove R and C to be con-stants within the measuring ranges.
Fig.3. Schematic diagram that represents the model used in the present work.
Impedance-Voltage characteristics ( -V): it is planned to be performed in
a similar away as -f curves, but with given fixed frequencies and varying the DC voltage with the same voltage ramp protocol used in the I-V characteris-tics. Additionally, the temperature settings are the same as for I-V and -f measurements.
2.3. First results
We have successfully obtained impedance results for a dry GM sample apply-ing VAC=1V at T ≈ 20 ºC and in ambient air conditions. Such results are
pre-sented in Fig.4 (a,b). Capacitance shows the expected decrease with the fre-quency and apparently no anomaly at low frequencies exists consistent with dry samples. On the other hand, the dissipation factor (D) besides the normal decrease with frequency also presents a small anomaly in the 0.5 MHz region that could be related with a Maxwell-Wagner relaxation, Maxwell (1892) and Wagner (1914), caused by the rock plus air system. This anomaly requires a
better study in future measurements, in particular it is important to analyse its behaviour with temperature.
Fig.4. First impedance spectrum for GM sample applying VAC=1V at T ≈ 20 ºC and in ambient air conditions: a) Capacitance (C); b) Dissipation factor (D).
3. Expected results and Future work
The main results coming out from this research plan are the understanding of charge transport mechanisms in different granitic rock types with distinct wa-ter content, mineralogical composition, and porosity. Ultimately, these studies will give an indication of the materials porosity and composition through their electrical response, Garrouch et al. (2009) and Haslund et al. (1994). Fu-ture studies could involve the analysis of pressure stimulated currents, Freund
et al. (2006) and Vallianatos et al. (2008), and voltages, Aydin et al. (2009), near fracture and other extreme conditions like the study of the electric response of samples submitted to drastic temperature changes or internal gradients.
Acknowledgments
One of the authors (HGS) is grateful to the support from the Portuguese Sci-ence Foundation, FCT - Fundação para a Ciência e a Tecnologia, through grant SFRH/BPD/63880/2009. Further, we are in debt with Prof. Alexandre Araújo from University of Évora for his help in the sample preparation and we also acknowledge Prof. Henrique Gomes from University of Algarve for his collaboration in obtaining the first impedance results.
References
Aydin, A., Prance, R.J., Prance, H., and Harland, C.J. 2009, Observation of pressure stimulated voltages in rocks using an electric potential sensor, Appl. Phys. Lett., Vol. 95, 124102.
Chew, W.C., and Sen, P.N. 1982, Dielectric enhancement due to electrochemical double layer: Thin double layer approximation, J. Chem. Phys., Vol. 77, 4683.
Freund, F.T., Takeuchi, A., Lau, B.W.S. 2006, Electric currents streaming out of stressed igne-ous rocks - A step towards understanding pre-earthquake low frequency EM emissions, Phys.
Chem. Earth, Vol. 31, 389.
Garrouch, A.A., Alsafran, E.M., and Garrouch, K.F. 2009, A classification model for rock typ-ing ustyp-ing dielectric permittivity and petrophysical data, J. Geophys. Eng., Vol. 6, 311.
Gomes, H.L., Stallinga, P., Cölle M., de Leeuw, D.M., and Biscarini, F. 2006, Electrical insta-bilities in organic semiconductors caused by trapped supercooled water, Appl. Phys. Lett., Vol. 88, 082101.
Haslund, E., Hansen, B.D., Hilfer, R., and Nøst, B. 1994, Measurement of local porosities and dielectric dispersion for a water saturated porous medium, J. Appl. Phys., Vol. 76, 5473. Kenyon, W.E. 1994, Texture effects on megahertz dielectric properties of calcite rock samples,
J. Appl. Phys., Vol. 55, 3153.
Maxell, J.C. 1892, Electricity and Magnetism, Vol. I, Oxford Press, London.
Miguel, A.F., Rosa, R.N., and Silva, A.M. 2000, Fractal geometry description of the permeabil-ity of a natural fissured rock, 9th International Congress on Deterioration and Conservation of Stone. Ramos, P.M., Janeiro, F.M., Tlemçani, M., and Serra, A.C. 2009, Recent developments on im-pedance measurements with DSP-based ellipse-fitting algorithms, IEEE Trans. Instrum. Meas., Vol. 58, 1680.
Reppert, P.M., Morgan, F.D., and Toksöz, M.N. 2000, Dielectric constant determination using ground-penetrating radar reflection coefficients, J. of Appl. Geophysics, Vol. 43, 189.
Sen, P.N. 1981, Relation of certain geometrical features to the dielectric anomaly of rocks,
Geo-physics, Vol. 46, 1714.
Silva, H.G., Gomes, H.L., Pogorelov, Y.G., Pereira, L.M.C., Kakazei, G.N., Sousa, J.B., Araújo, J.P., Mariano, J.F.L. , Cardoso, S., and Freitas, P.P. 2009a, Magnetic and transport properties of diluted granular multilayers, J. Appl. Phys., Vol. 106, 113910.
Silva, H., Gomes, H.L., Pogorelov, Y.G., Stallinga, P., de Leeuw, D.M., Araújo, J.P., Sousa, J.B., Meskers, S.C.J., Kakazei, G., Cardoso, S., and Freitas, P.P. 2009b, Resistive switching in nanostructured thin films, Appl. Phys. Lett., Vol. 94, 202107.
Uyeda, S., Nagao, T., Kamogawa, M. 2009, Short-term earthquake prediction: Current status of seismo-electromagnetics, Tectonophysics, Vol. 470, 205.
Vallianatos, F., and Triantis, D. 2008, Scaling in Pressure Stimulated Currents related with rock fracture, Physica A, Vol. 387, 4940.
Wagner, K.W. I914, Erklarung der Diclektrischen Nachwirkungen auf Grund Maxwellscher Vosrtellungen. Arch. Electr. v. 2. p. 371-387.