O R I G I N A L A R T I C L E
Effect of temperature on the sorption curves of earthen
materials
Antonin Fabbri .Fionn McGregor.Ines Costa.Paulina Faria
Received: 16 August 2017 / Accepted: 27 November 2017 / Published online: 5 December 2017 RILEM 2017
Abstract Unfired earth is a sustainable construction material with low embodied energy, but its develop-ment requires a better evaluation of its moisture– thermal buffering abilities and its mechanical behav-ior. Both of them are known to strongly depend on the amount of water contained in its porous network and its evolution with external conditions (temperature, humidity), which can be assessed through several sorption–desorption curves at different temperature. However, the direct measurement of these curves is particularly time consuming (up to 2 month per curve) and thus, indirect means of their determination appear of main importance for evident time saving and economical reasons. In this context, this paper focuses on the prediction of the evolution of sorption curves with temperature on earth plasters and compacted earth samples. For that purpose, two methods are proposed. The first one is an adaptation of the isosteric
method, which gives the variation of relative humidity with temperature at constant water content. The second one, based on the liquid–gas interface equilib-rium, gives the variation of water content with temperature at constant relative humidity. These two methods lead to quite consistent and complementary results. It underlines their capability to predict the sorption curves of the tested materials at several temperatures from the sole knowledge of one sorption curve at a given temperature. Finally, these predictions are used to scan the range of temperature variation within which the evolution of water content with temperature at constant humidity could be neglected or should be taken into account.
Keywords Vapor sorption in porous mediaLatent heat of sorption/desorptionHygroscopic behavior Earthen material
1 Introduction
Earthen materials for building construction are gain-ing nowadays in interest due to their large ecological potential. Indeed, they allow to drastically reduce fossil energy consumption and greenhouse gas emis-sions associated with the manufacture compared to conventionally used materials [1,2]. In addition, they are known to have moisture buffering and temperature A. Fabbri (&)F. McGregorI. Costa
LTDS-LGCB, UMR 5513 CNRS, ENTPE, Universite´ de Lyon, 69100 Vaulx-en-Velin, France
e-mail: [email protected] F. McGregor
e-mail: [email protected] I. Costa
e-mail: [email protected] I. CostaP. Faria
CERIS and Department of Civil Engineering, NOVA University of Lisbon, 2829-516 Caparica, Portugal e-mail: [email protected]
controlling properties [3–5]. At building scale, it was shown that the use of hygroscopic materials leads to a significant reduction of moisture variation amplitudes, which thus induces energy savings on ventilation and heating [6].
This is due to the microstructure of the earth, which enables hydric exchanges between the environment and water molecules on the pore surfaces through condensation/evaporation and sorption/desorption phenomena. This affinity with water molecules also significantly impacts mechanical behavior of earth materials. For example, the decrease in strength with moisture, which is well known in soil mechanics, has been demonstrated for rammed earth [7–9]. Conse-quently, it appears that the liquid water content of a rammed earth wall is a key parameter in order to understand the behavior and the strength of this material.
At the macroscopic scale, sorption isotherm char-acterizes the water uptake with increasing ambient humidity at a constant temperature, while the desorp-tion isotherms characterizes water expulsion with decreasing ambient humidity at a constant tempera-ture. These curves are strongly non-linear. Further-more, a hysteresis can be observed between sorption and desorption. This phenomenon is quite common and has been widely studied by many authors for a large variety of materials like soil, wood and hemp concrete [10–13]. In addition, sorption–desorption curves are known to vary with temperature. The general tendency is a small decrease of the water content at constant relative humidity as temperature rise.
It follows that a proper determination of the evolution of the water content of an hygroscopic material with the external conditions (temperature, humidity) would require to perform several sorption– desorption curves at different temperature. Knowing that the measurement of a single sorption–desorption loop on earthen material lasts from two weeks to more than two months in function on the experimental protocol, this option appears to be not acceptable for most of earthen construction projects for quite evident duration and economical reasons. Thus, any procedure which would allow to accurately assess the sorption and desorption curves from indirect measurement is of main importance.
In this context, this paper aims at proposing a method to predict the evolution of sorption curves with
temperature. This effect has already been studied for a quite large range of porous materials including concrete [14], bio-based [15] and even clayey [16] materials. These studies are mainly based on the chemical equilibrium between adsorbed water and water vapor, which allows to link this temperature dependence of the sorption curves to the isosteric heat. However, since no clear data exists on the evolution of isosteric heat with temperature and relative humidity (or water content), these methods do not manage to predict the evolution of sorption–desorption curves with temperature. To overcome this problem, this paper proposes two different methods. The first one is based on the analysis of the heat of phase change in order to predict the isosteric heat evolutions. The second one is based on the link between morphology of the porous network and the water content. These two methods were applied on two kind of earthen materials: compacted earth blocks and samples of earth plasters and the obtained results were compared to experimental data which were obtained at 10 and 40C. At end, this approach was used in order to discuss on the impact of temperature dependency of sorption curves on hygrothermal modeling.
Finally, it is important to note that a good under-standing of the earthen constructions requires taking into account their large variability, which is due to the inner nature of the material (depending on the soil location and history) and on the great numbers of construction technics (compacted earth, adobe, cob, rammed earth, plaster, extruded bricks [17]…). It is not possible, however, to explore all the possibilities at the same time. In this paper the choice of compacted earth and earth plaster has been made since it allows to encompass the behavior of a quite important number of systems. It follows that the results presented in this paper cannot be directly generalized to all earthen construction techniques.
2 Materials and methods
2.1 Material
France: either STR from Saint-Trivier de Courtes or CRA from Cras-sur-Reyssouze. This choice ensures that the earths are suitable to construct earthen buildings. The complete characterization of these two earths is given in [8]. To sum up, the plasticity index and the Methylene Blue Value of CRA are almost twice as high as those for STR, while their grading curves are similar. These two values allow us to have a first insight on the nature of the clays within the material: the clayey proportion of STR should mainly be composed of Kaolinite and Illite, while much more active clays are expected in CRA. Having said that, the X-ray diffraction analysis of these two earths shows that their clayey proportions are both mainly composed by Illite.
The first step of the compacted samples fabrication protocol consists in crushing the rammed earth pieces of wall (which were taken directly from the construc-tion sites) into small particles sieved through a 2-mm sieve to obtain a homogenous material. An homemade double-compaction process is then used to realize cylindrical samples of diameter 3.5 and 7 cm in height with a loading charge of 4 MPa. This charge is in the range of the one applied for the realization of compacted earth blocks with a manual press. The water content of fabrication was fixed in order to reach the higher dry density. This fabrication procedure ensures a global homogeneity of the resulting samples and a good repeatability of their main characteristics (density, compressive strength, deformability, vapor resistance factor, sorption–desorption curves). The compressed samples made with the earth CRA were referenced as C1, while the compressed samples made with the earth STR were referenced as C2.
Two earth plaster formulations, denoted by P1 and P2, were studied. The plasters P1 were composed by 25 wt% of Kaolinite (clay with a low specific surface compared to other clays; yet with a high sorption capacity compared to most minerals, whose particle size distribution is 43%\2lm and 95%\80lm), 73 wt% of sand (particle size lower than 2 mm), and 2 wt% of straw particles (size between 30 and 50 mm). The plasters P2 were composed by 31 wt% of Ascal10 (commercial fine calcareous-clay material whose particle size distribution is: 14%\2lm and 97%\80lm), 67 wt% of the same sand (particle size lower than 2 mm), and 2 wt% of straw particles (size between 10 and 30 mm). Each plaster was mixed with
water (30 wt% for P1 and 24 wt% for P2) before being cast in a specific formwork (5050 cm2 cm).
All the samples (either compacted earths or earth plasters) were dried in a controlled environment in a conditioning room at 20±2 C and 55±5% of relative humidity. Periodical measurements were realized to follow the drying stage of the samples, and they were not tested before a stable mass was reached. A summary of samples composition is given in the Table1.
2.2 Determination of the sorption isotherms
Several methods exist to estimate the isothermal sorption and desorption curves, but the two most widely used are the desiccator and dynamic gravimet-ric vapor sorption methods.
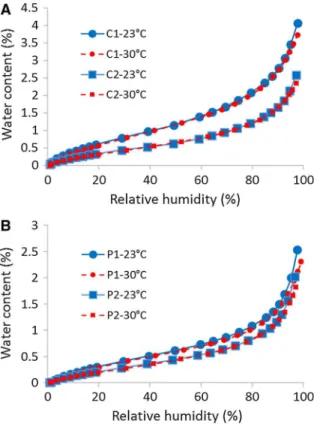
The dynamic gravimetric sorption method, com-monly called the DVS (dynamic vapor sorption) method, consists in measuring uptake and loss of moisture by flowing a carrier gas at a specified relative humidity (or partial pressure) over a small sample (from several milligrams to several grams depending on the device used) suspended from the weighing mechanism of an ultrasensitive recording microbal-ance. Variations in the gas’s relative humidity are automatically calculated by the device when the target condition in mass stability is reached. This method was used to draw the sorption–desorption curves at 23 and 30C for all the formulations with the DVS Intrinsic from Surface Measurement Systems. The results are reported in the Fig. 1. Only the sorption curve is drawn to ease the reading. Whatever the material, a small but visible decrease in water content with temperature was observed. It is however impor-tant to keep in mind that the difference of temperature between the curves were quite limited (only 7C).
least) in several environments of decreasing relative humidity until mass is constant and at constant temperature.
The relative humidity within the desiccators is fixed by equilibrium with saturated saline solutions through the activity of its solvent (that is liquid water). This latter tends to decrease with salt concentration, but it is also impacted by the nature of the salt, the tempera-ture, etc. The value of the equilibrium relative humidity at saturation for a dozen salts of different solubility levels and at several temperatures is given in the standard. However, this value remains quite
theoretical, and it can be modified by a great number of factors like impurities in salts or water, non-saturation of the saline solution at the liquid–gas interface… To avoid this problem, the effective relative humidity in the desiccators near the samples have been measured with Rotronic HygroLog HL-NT sensors. The salts which were used in this study as well as the target and measured relative humidity within the desiccators are summarized in Table2.
Using this protocol, a sorption–desorption loop can be made in approximatively 2 months for earthen materials, while only a period of 2 weeks is necessary if the DVS method is used. On the other hand, the desiccator method can test several specimens at the same time, and it is the only way to test materials with high levels of heterogeneity because of the small dimensions of DVS samples.
Whatever method used, the isothermal sorption curves should be intrinsic to the tested material. However, direct comparisons between the curves obtained by the DVS or the desiccator methods is not possible since, as it is already underlined by Labat et al. [18], the reference dry mass used to calculated the water content is intrinsically different for the two Table 1 Compacted earth and earth plaster compositions, water content at fabrication and dry density
Ref. Type Composition (wt%) wm (wt%) qd (kg=m3)
C1 Compacted Earth CRA (100) 11 1970
C2 Compacted Earth STR (100) 11 1950
P1 Cast Ka(25) Sd(73) St(2) 30 1596
P2 Cast A10(31) Sd(67) St(2) 24 1660
Kakaolinite,A10Ascal10,Sdsand,Ststraw
Fig. 1 Sorption curves at 23 and 30C for the compacted earths (a) and the earth plasters (b) obtained with the DVS method
Table 2 Summary of the salts used in this study, their equi-librium relative humidity (in %) as it is given in the standard ISO 12751 (Targ), and the measured relative humidity in the desiccators (Meas)
methods: the dry mass considered by the DVS is obtained by drying the sample through a flow of dry air, while the dry mass for the desiccator method is commonly estimated from the drying at 105C.
One option to compare the two methods should be to dry the DVS sample in an oven at 105C after (or before) the sorption–desorption test. If this dry mass, denoted bym105C
d , is taken as the reference, the water content given by the DVS, denoted bywDVS, must be corrected as follows:
wcorrectedDVS ¼ m 105C
d
m23C
d
ðwDVSþ1Þ 1 ð1Þ wherem23C
d is the dry mass obtained at 23C under the dry atmosphere of the DVS. However, the oven drying stage is particularly complicated to perform. Indeed, since the sample mass for the DVS is extremely low (around 1 g), any dust supply or release may significantly change the results. To avoid this complexity, another option is to modify the desiccator experimental protocol by adopting a drying process similar to the DVS’s one. For that purpose, a vacuum drying at 23C within a dessicator with silica gel, insuring a relative humidity lower than 5% during at least the whole drying period (approx. 2 weeks), was used in this study.
The isothermal sorption curves of compacted earth C1 and earth plaster P1 at 23C for the two methods (either DVS or dessicator) and the two kinds of reference dry mass (eitherm105d Corm23d C) are showed in the Fig.2. This comparison gives some confidence on the consistency between DVS and dessicator methods if the same protocol is used to estimate the dry mass. In the following of this study, for convenient purpose, no correction was applied on the DVS results and the dry mass of the desiccator method, which is also used to calculate the dry density, was determined using the vacuum drying procedure at 23C.
3 Sorption curve and enthalpy of phase change
3.1 Integral and differential enthalpy of phase change
The natural definition of the specific enthalpy of desorption is the difference between the specific enthalpies of the vapor and of the adsorbed water,
denoted by Dhv. If thermodynamical equilibrium is assumed between adsorbed water and water vapor, it is linked to the specific entropy of these two phases (denoted bysLfor adsorbed water and bysvfor water vapor) through the equation (proof in ‘‘Appendix’’):
Dhv¼Tðsv sLÞ ð2Þ
whereTis the temperature at which the phase change occurs. Using the expression ofsLandsvreported in the ‘‘Appendix’’, the Eq. (2) becomes:
Dhv¼Leþ ðCv CLÞðT TeÞ
RT MH2O
lnu ð3Þ whereLe¼2:26 MJ=kg is the specific latent heat of evaporation of free water at boiling temperature, denoted by Te¼373 K, R¼8:31 J=mol=K is the perfect gas constant, MH2O¼18 g=mol is the molar
constant. Finally,uis the relative humidity, which is defined as the ratio between the partial pressure of vapor at which the phase change occurs (pv) and the partial pressure of vapor at saturation (psatv ).
The last term of (3), namely ð RT=MH2OÞlnu
leads to an increase in Dhv when the equilibrium relative humidity decreases. As is depicted by the Eq. (2) this stems from the quite logical increase of vapor entropy when the concentration of vapor molecules within the air phase decreases. Note that uin this expression is the relative humidity at the local sorption/desorption front (that is the interface between adsorbed water and water vapor). For free pure water, the relative humidity at the evaporation/condensation front is always equal to 1, and thus this last term vanishes. However, it is almost always neglected even for confined adsorbed in-pore water (for whichu\1 at the liquid–gas interface), while as already discussed by Soudani et al. [5], the variations ofDhvwithTand uappear to be on the same order of magnitude. Let us eventually notice that the expression (3) is based on the assumption that the entropy of adsorbed water only depends on temperature. This assumption will surely be wrong at very low saturation where strong inter-actions occur between adsorbed water and pore walls. In such case, an additional corrective term should be added, but its quantification is out of the scope of this paper.
Another way to assess the enthalpy of phase change is to use the differential specific internal energy and entropy of the adsorbed phase, respectively denoted by
_
uLands_L, and defined as _
uL ¼ 1 qd
oUL
ow
T
; _sL¼ 1 qd
oSL
ow
T
ð4Þ wherew¼mL=md, withmLthe mass of adsorbed and/ or liquid water andmdthe dry mass, is the gravimetric water content, while UL and SL¼qdwsL are the internal energy and the entropy of the adsorbed phase per unit of initial total volume of the material andqdis the dry density.
The combined use of these notations with the chemical equilibrium condition provides:
Dh_¼hv u_L¼Tðsv s_LÞ ð5Þ
By analogy with the Eq. (2),Dh_¼hv u_Lis defined as the differential enthalpy of desorption. It is also commonly called isosteric heat. This form of the
enthalpy of phase change is particularly interesting because it satisfies the following Clapeyron-like equation (proof in ‘‘Appendix’’):
Dh_¼ R
MH2O
olnpv
o1=T
w
ð6Þ
It follows thatDh_ can be experimentally determined from the analysis of the sorption–desorption curve variations with temperature. If the two temperatures remain sufficiently close, it is possible to ignore the variation ofDh_ with temperature, and the integration of the Eq. (31), which is reported in the ‘‘Appendix’’, provides:
Dh_ðTm;wÞ ¼ R MH2O
ln pvðT2;wÞ
pvðT1;wÞ
T
1T2
T1 T2
ð7Þ wherexis the water content, which is held constant,
T1 and T2 are the two temperatures at which the sorption–desorption curves are drawn, Tm¼ ðT1þ
T2Þ=2 is the average temperature, whilepvðT1;wÞand
pvðT2;wÞ are the vapor pressure at equilibrium with the water content wfor the temperatures T1 andT2, respectively.
The combination of equations (2) and (5) leads to the following relation betweenDhv andDh_:
Dhv Dh_¼Tw
osL
ow ð8Þ
Under the assumption that sL only depends on the temperature, the term osL=owbecomes null and the
isosteric heat (Dh_) can henceforth be assumed to be equal to the integral enthalpy of the phase change (Dhv). A way to check this assumption is to compare the values of Dhv given by the Eq. (2) and the differential enthalpy estimated from the isosteric method on sorption curves at 23 and 30C for each tested materials. The results are reported in the Fig.3. The experimental points appear to be quite scattered, in particular at low humidity. This may be due to measurement uncertainties, since an error of 3% in the measurement of the relative humidity leads to a theoretical relative error of approximatively 20% in
when the relative humidity decreases. Thus, even if they can not be considered as hard proofs, these results give some confidence on the validity of this approach for the materials considered in this study.
3.2 Isosteric method: variation of relative humidity with temperature at constant water content
Alternatively, the combined use of the Eq. (7) and the assumption Dhv¼Dh_ can be used to estimate the evolution of sorption curve with temperature:
uðw;T2Þ uðw;T1Þ¼
psat v ðT1Þ
psat v ðT2Þ
exp DhvMH2O R
T1 T2
T1T2
ð9Þ Throughout the rest of the paper, this way to estimate the variation of sorption curve with temperature is called the ‘‘isosteric method’’.
The difference between the sorption curves at 23 and 30C is not sufficient in order to scan the accuracy of this method. In consequence, the comparison is made between sorption curves of the same samples at 10 and 40C. Due to technical limitation of the DVS which is used in this study, the sorption curves are obtained with the desiccator method with the salts reported in the Table 2. In addition, only the compacted earth C1 and the earth plaster P1 have been tested.
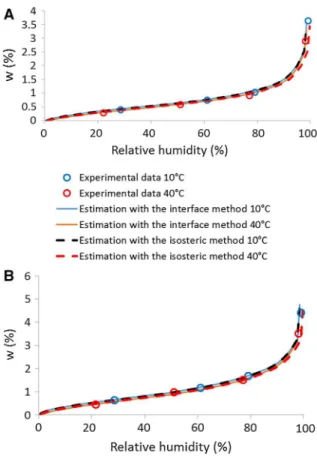
Calculations are made using the sorption curve at 23C obtained with the DVS as a reference. In other words, the Eq.9is used withT1¼296 K whileT2¼ 283 K to build the sorption curve at 10C, andT2¼ 313 K for the sorption at 40C. The results, are shown in Fig. 4. In order to ease the reading of the results, the
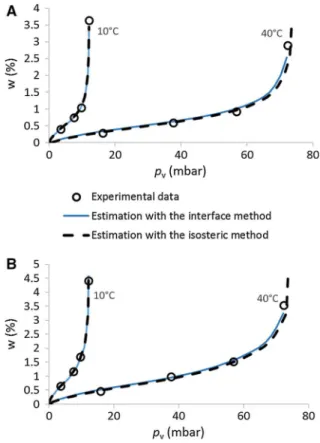
water content was also drawn in function of vapor pressure instead of the relative humidity in Fig.5.
Whatever the tested material, results underlines a good correlation between the predicted curves and the experimental data.
4 Sorption curve and pore size distribution
4.1 Theoretical background
One other way to assess the evolution of sorption curves is the analysis of the mechanical equilibrium of the liquid–gas interface, which can be depicted by the Young-Laplace law:
Patm PL¼cL;GjL;G ð10Þ
wherePatmis the atmospheric pressure,PLis the liquid pressure,jL;Gis the average curvature of the liquid– gas interface andcL;Gis the apparent surface tension Fig. 3 Evolution of the enthalpy of phase change with relative
humidity estimated from the Clapeyron equation (dots) and from the Eq. (3) (line)
between the liquid water and the in-pore gas. It is quite difficult to assess this latter since its value may be modified by the interactions between the water molecules and the pore walls. In this study, the assumption was made that the tabulated expression determined for pure unconfined water, that is cL;G¼ 72:74 0:1513ðT 293:13Þin [mN/m] [19], can be used.
If the deformation of in-pore space (due to mechanical loading or thermal dilation for example) and hysteresis phenomena are ignored, jL;G can directly be linked to the morphology of the porous network. This link has been already widely used in order to estimate the pore size distribution of porous material from their sorption/desorption curves [20,21]. Under this strong assumption, which should however be checked, in particular for earthen mate-rials with a high content in vegetal fibres (like straw or hemp),jL;Gcan be written in the form:
jL;G¼ F 1ðwÞ ð11Þ where F 1
is a monotonous bijective decreasing function of the water content, denoted by w, which satisfies F 1ðwsatÞ ¼
0, with wsat being the water content at saturation.
Alternatively, the chemical equilibrium between the adsorbed water and its vapor leads to the celebrated Kelvin’s law:
PL Patm¼ qLRT
MH2O
lnu ð12Þ
whereqL is the density of water,Ris the perfect gas constant,MH2Ois the molar mass of water, whileTand
uare the temperature and the relative humidity at the local sorption/desorption front.
The combined use of (12), (10), and (11) allows to writexin the form:
wðu;TÞ ¼ F Patm PL cL;G
!
¼ Fð ÞX ð13Þ
whereF is the inverse function ofF 1 , and
X¼ qLRT cL;GMH2O
lnu ð14Þ
The existence of this monotonous bijective functionF between the water content andXhave been checked for the earth plaster P1 and the compacted earth C1 using the DVS’s sorption curves at 23 and 30C as well as the desiccator’s sorption curves at 10, 23 and 40C. The results are reported in the Fig.6. They lead to quite consistent results, which tends to validate the existence of this function, at least for the tested materials.
Using this formalism, and assuming that the surface tension only depends on temperature, the variation of the water content with temperature at constant hygrometry can be linked to the slope of the isothermal sorption curve through the equation (proof in ‘‘Appendix’’):
ow
oTðT;uÞ ¼ulnu
1
T
d lncL;G dT
nðT;uÞ ð15Þ where
nðT;uÞ ¼ow
ouðT;uÞ ð16Þ
is the slope of the sorption curve at the temperatureT
for the relative humidityu.
4.2 Interface method: Variation of water content with temperature at constant relative humidity Similarly to what it is done in the previous section, the Eq. (15) is used to estimate the variation of water content at constant humidity between 10 and 40C for the compacted earth C1 and the plaster P1:
wðu;T2Þ wðu;T1Þ
¼ulnu T2 T1
T1
ln cL;GðT2Þ cL;GðT1Þ
!! nðu;T1Þ
ð17Þ Throughout the rest of the paper, this way to estimate the variation of sorption curve with temperature is called the ‘‘interface method’’.
The results, using the sorption curve at 23C obtained with the DVS as the reference curve, are showed in Fig. 5. They underline a good correlation between the experimental data and calculated values
for earth plaster P1 and compacted earth C1 for the sorption curves at 10 and 40C.
5 Discussion
Both methods (either isosteric or interface) seem to quite well predict the variation of the sorption curve with temperature of the earthen materials tested in this study. However, information which is given by these two methods is intrinsically different. Isosteric method provides the variation of equilibrium relative humidity with temperature at constant water content while interface method gives the variation of water content with temperature at constant relative humidity.
Hygroscopic and hygrothermal models are based on the mass conservation of the in-pore water (both adsorbed, liquid and vapor). Assuming the equilibrium between all the in-pore water phases, and if the mass variation of vapor is strongly negligible towards the mass variation of liquid and adsorbed water, it leads to:
qd
ow
ot ¼ r gLþgv
ð18Þ wheregLis the mass flow vector of liquid water, which depends on liquid pressure gradient and gravity through the Darcy’s law and gv is the mass flow vector of vapor, which is composed by a diffusive term and an advective term, and which depend on gradients of vapor and total gas pressures. The developed equation of this relation can be found in a quite large amount of references, see for example [5, 22, 23]. Since the water content is a function of temperature and relative humidity, the first term of the Eq. (18), can be written as:
qd
ow
ot ¼qd n
ou
ot þ
ow
oT
oT
ot
ð19Þ It follows that, to solve the Eq. (18), the information provided by the interface method is more convenient since it directly gives the term ow=oT, and the combination between (15) and (19) provides:
ow
ot ¼nðT;uÞ
ou
ot þulnu
1
T
d lncL;G dT
oT
ot
ð20Þ Fig. 6 Relation between the water content andXfor the earth
What’s more, the knowledge of the function F ðXÞ, which can be experimentally obtained by plottingxas a function of X¼ ð qLRTÞ=ðcL;GMH2OuÞ, would
allow to assess the expression ofn for each relative humidity and temperature through the Eq. (32) in ‘‘Appendix’’. In consequence, under the assumptions and conditions of this study, only a single sorption curve is required to assess the evolution of water content with both temperature and relative humidity.
However, the interface method is based on the empirical knowledge of thecL;GðTÞfunction. Thus, for each new material, the existence of a functioncL;GðTÞ which allow to reach a singlew¼ F ðXÞcurve must be verified. Along the same line, the assumption that
Dhv¼Dh_ used in the isosteric method must be verified for each new tested material, especially when strong interactions may occurs between the adsorbed layer and the solid particles that forms the material.
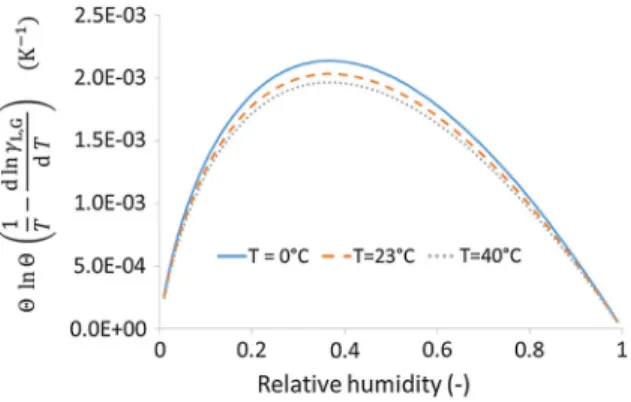
Having said that, if the interface method is validated, the Eq. (20) can be used in order to estimate the impact of the temperature variation of the sorption curve on hygroscopic (and thus hygrothermal) calcu-lations. For that purpose, the data from the Handbook of Chemistry and Physics [19], d lncL;G=dT 2:6 10 3 for temperature ranging from 0 and 50C is considered. This gives values of ulnu 1
T
d lncL;G
dT
which remain at most on the order of 210 3K 1 (cf. Fig.7). As a consequence, a 5C variation in temperature appears to have the same impact on the water content as a 1% variation in relative humidity, which is negligible. On the other side, for temperature variations higher than 25C, the variation of water
content with temperature at constant humidity can become on the same order than a 5% variation in relative humidity, which may become significant.
6 Conclusion
This paper presents a study on the impact of temper-ature on the sorption curves of earth plasters and compacted earth samples. For that purpose, two means of measurement are used, either the DVS (dynamic gravimetric sorption method) or the desiccator and saline solutions method (defined in the international standard ISO 12571 [24]). A good consistency was found between these two methods providing that the sample dry masses were determined using a similar protocol.
The prediction of sorption curves at several temperatures was made following two approaches. The first one, denoted by the ‘‘Isosteric method’’ was based on the well known Clapeyron relation. For that purpose, assuming that entropy of adsorbed water only depends on temperature, a simple expression of the latent heat of desorption was proposed. This method provides the variation of the equilibrium relative humidity with temperature at constant water content.
The second one, denoted by the ‘‘interface method’’, gives variation of water content with temperature at constant relative humidity. It relies on the assumption of existence of a bijective function between the water content and the curvature of liquid– gas interface, which is in turn bijectively linked to the porous network geometry.
The sorption curves estimated with these two methods were quite similar and were consistent with the experimental data in the studied range of temper-ature (between 10 and 40C). This first result is quite interesting since it underlines that it is possible to predict the evolution of water content curve with temperature from the sole knowledge of one isother-mal sorption curve.
Finally, using the interface method, the compara-tive impact assessment of temperature and relacompara-tive humidity on water content have been realized. It follows that if temperature variations are below 25C, the induced variation in water content would be, at maximum, in the same range than the one induced by a 5% variation in relative humidity. Thus even if the choice of taking into account the temperature Fig. 7 Evolution of the factorulnu 1
T
d lncL;G dT
dependency of sorption curves will depend on the required precision, the assumption that w¼wðuÞ seems quite acceptable for moderate variations of temperature. Therefore, this study provides a simple tool which can assist in making that decision.
To conclude, even if the developments of this paper focuses on earthen materials submitted to quite moderate variations of temperature (realistic for the indoor atmosphere), the methodology which is devel-oped may be applied to other materials and/or conditions. In that view, it may be interesting to analyze materials for which the sorption curve exhibits stronger dependency in temperature and/or for larger ranges of temperatures.
Acknowledgements This present work has been supported by the French national research agency ANR, though the project BioTerra (ANR-13-VBDU-0005) and has received funding from the People Program (Marie Curie Actions) of the European Unions Seventh Framework Program (FP7/2007-2013) under REA grant agreement PCOFUND-GA-2013-609102, through the PRESTIGE program coordinated by Campus France. The authors are indebted to Joao Rodrigues Ferreira for its participation in the former experimentations on this subject during its internship at the ENTPE (from March to August 2016).
Compliance with ethical standards
Conflicts of interest The authors declare that they have no conflict of interest.
Appendix
Integral enthalpy
By definition, the specific enthalpies of the adsorbed and vapor phases are equal to:
hL ¼gLþTsL;hv¼gvþTsv ð21Þ wheresLandsvare the specific entropies of adsorbed water and vapor, respectively, expressed as:
sL ¼s0LþCLln
T T0
ð22aÞ
sv ¼s0vþCvln
T T0
R Mv
ln pv
P0G
ð22bÞ The superscript 0 is used to denote the reference state, defined by P0
G¼P 0
L¼Patm and T0¼Te¼
373:15 K, whereTe is the boiling temperature at the atmospheric pressure. In this condition, vapor pressure at saturation is also equal to atmospheric pressure:
psatv ðPatm;TeÞ ¼Patm¼P0G ð23Þ while s0
v s0L, which is the difference in entropy, at
PatmandTebetween pure vapor and liquid water, is directly linked to the latent heat of evaporation atPatm andTeof water, denoted byLe, though the equation:
Le¼Teðs0v s 0
LÞ ð24Þ
The natural definition of the specific enthalpy of desorption is the difference between the specific enthalpies of the vapor and of the adsorbed water, denoted byDhv. Since at equilibrium the specific free enthalpies of liquid water and its vapor are equal (gL¼gv), the combined use of (21) and (22a–22b) makes it possible to writeDhv¼hv hL as:
Dhv¼Tðs0v s 0
LÞ þ ðCv CLÞTln
T T0 RT
Mv ln pv
P0G
ð25Þ At first order, the dependency partial vapor pressure at saturation can be depicted by the relation (see for example [5,25]):
ln p sat v ðTÞ
Patm
¼MH2O RT
Le
Te
ðT TeÞ
þ ðCv CLÞ Tln
T Te
ðT TeÞ
ð26Þ The combined use of this expression with the equa-tions (26), (23), and (24) provides:
Dhv¼Leþ ðCv CLÞðT TeÞ
RT Mv
lnu ð27Þ whereu¼pv=psatv is the relative humidity.
Differential enthalpy
gL ¼u_L Ts_L ð28Þ which, when combined with the chemical equilibrium condition (gL¼gv), finally provides:
Dh_¼hv u_L¼Tðsv s_LÞ ð29Þ
Clapeyron’s equations
An extensive use of the equations that define Dh_
provides:
oDh_
oT
w
T oðsv s_LÞ
oT
w
¼0 ð30Þ
The derivation of (29) with respect of the temperature reciprocal, at constant water content, while using the Eq. (30) eventually provides the following Clausius-Clapeyron-like equation:
Dh_¼ R
MH2O
olnpv
o1=T
w
ð31Þ
Water content and pore size distribution
The partial derivation of the Eq. (13) with respect to the relative humidity (at constant temperature) provides:
ow
ou¼
oF
oX
oX
ou ð32Þ
where
oX
ou¼
qLRT cL;GMH2Ou
ð33Þ
Along the same line, the partial derivation of (13) with respect to the temperature (at constant relative humidity) provides:
ow
oT ¼
oF
oX
oX
oT ð34Þ
where
oX
oT ¼
qLRTlnu cL;GMH2O
1
T
d lncL;G dT
ð35Þ
The combination of (32) and (34) eventually provides the equation:
ow
oT¼ulnu
1
T
d lncL;G dT
ow
L
ou ð36Þ
References
1. Harris D (1999) A quantitative approach to the assessment of the environmental impact of building materials. Build Environ 34:751–758
2. Morel J, Mesbah A, Oggero M, Walker P (2001) Building houses with local materials: means to drastically reduce the environmental impact of construction. Build Environ 36:1119–1126
3. Liuzzi S, Hall M, Stefanizzi PP, Casey S (2013) Hygrothermal behaviour and relative humidity buffering of unfired and hydrated lime-stabilised clay composites in a mediterranean climate. Build Environ 61:82–92
4. McGregor F, Heath A, Shea A (2014) The moisture buffering capacity of unfired clay masonry. Build Environ 82:599–607
5. Soudani L, Fabbri A, Morel J, Woloszyn M, Chabriac P, Wong H, Grillet A (2016) Assessment of the validity of some common assumptions in hygrothermal modeling of earth based materials. Energy Build 116:498–511 6. Woloszyn M, Kalamees T, Abadie M, Steeman M,
Kala-gasidis AS (2009) The effect of combining a relative-hu-midity-sensitive ventilation system with the moisture buffering capacity of materials on indoor climate and energy efficiency of buildings. Build Environ 44:515–524 7. Bui QB, Morel JC (2009) Assessing the anisotropy of
rammed earth. Constr Build Mater 23:3005–3011 8. Champire´ F, Fabbri A, Morel J, Wong H, McGregor F
(2016) Impact of hygrometry on mechanical behavior of compacted earth for building constructions. Constr Build Mater 110:70–78
9. Jaquin P, Augarde C, Gallipoli D, Toll D (2009) The strength of unstabilised rammed earth materials. Ge´otech-nique 59:487–490
10. Carmeliet J, Descamps F, Houvenaghel G (1999) A mut-liscale network model for simulating moisture transfer properties of porous media. Transp Porous Media 35:67–88 11. Coussy O (2004) Poromechanics. Wiley, New York 12. Derluyn H, Derome D, Carmeliet J, Stora E, Barbarulo R
(2012) Hysteretic behavior of concrete: modeling and analysis. Cem Concr Res 42:1379–1388
13. Zhou A (2013) A contact angle-dependent hysteresis model for soil–water retention behaviour. Comput Geotech 49:36–42
14. Poyet S, Charles S (2009) Temperature dependence of the sorption isotherms of cement-based materials: heat of sorption and clausius–clapeyron formula. Cem Concr Res 39:1060–1067
16. Mihoubi D, Bellagi A (2006) Thermodynamic analysis of sorption isotherms of bentonite. J Chem Thermodyn 38:1105–1110
17. Hall M, Krayenhoff M, L R (2012) Modern earth buildings. Woodhead, Cambridge
18. Labat M, Magniont C, Oudhof N, Aubert J (2016) From the experimental characterisation of the hygrothermal proper-ties of straw-cvlay mixtures to the numerical assessment of their buffering potential. Build Environ 97:69–81 19. Lide D (1999) Handbook of chemistry and physics. CRC
Press, Boca Raton
20. Barrett E, Joyner L, Halenda P (1951) The determination of pore volume and area distributions in porous substances. I: computations from nitrogen isotherms. J Am Chem Soc 73:373–380
21. Fabbri A, Fen-Chong T (2013) Indirect measurement of the ice content curve of partially frozen cement based materials. J Cold Reg Eng 90–91:14–21
22. Janssen H, Blocken B, Carmeliet J (2007) Conservative modelling of the moisture and heat transfer in building components under atmospheric excitation. Int J Heat Mass Transf 50:1128–1140
23. Ku¨nzel H (1995) Simultaneous heat and moisture transport in building components. Fraunhofer IRB Verlag, Suttgart 24. ISO 12571:2013 (2013) Hygrothermal performance of
building materials and products—determination of hygro-scopic sorption properties. International Standard, p 18 25. Coussy O (2010) Mechanics and physics of porous solids.