Modification of the NH
2column method for chromium
speciation in surface water and soil water
Auri Koivuhuhta
1)*
, Marja Liisa Räisänen
2), Lea Hämäläinen
3)and
Juha Kekäläinen
4)1) Geological Survey of Finland, Tutkijantie 1, FI-83500 Outokumpu, Finland.
2) Geological Survey of Finland, P.O.Box 1237, FI-70211 Kuopio, Finland.
3) Labtium Oy, P.O.Box 1500, FI-70211 Kuopio, Finland.
4) Outokumpu Tornio Works, FI-95400 Tornio, Finland.
Abstract
A new application of the NH2 column method has been tested for speciation of Cr(VI) in soil water and surface water. Soil water and surface water samples were collected from two sites near the world’s largest stainless steel production plant, Outokumpu Tornio Works, about 10 km south of the City of Tornio, Finland. Dissolved chromium species [Cr(VI) and Cr(III)] were quantified immediately from the water samples with the NH2 (aminopropyl-modified silica) column method and a graphite furnace atomic absorption spectrophotom-eter (GFAAS) and then three months later after the collection. The sum of Cr species con-centration determined by the method was equal to total dissolved Cr concon-centration meas-ured by inductively coupled plasma mass spectrometry (ICP-MS). The method was precise and selective for environmental water samples at low concentrations, and it fractionated Cr species with 100 % specificity without noteworthy interference from other metals. Some difficulties appeared with Cr standard solutions made with deionised water. In addition, the soluble form of Cr(VI) was preserved in a stable form for three months both in the refrig-erator and freezer, and almost all the dissolved Cr was in the Cr(VI) form.
Key words: chemical analysis, chromium, chemical fractionation, concentration, soil water,
surface water, Finland
*Corresponding author e-mail: [email protected]
1. Introduction
The toxicity of chromium depends on its chemical form. In natural waters, chromium mostly occurs in two oxidation states: Cr(III) and Cr(VI). Environ-mental conditions like temperature, chemical com-position, oxidation-reduction and pH control the oc-currence of chromium species. Trivalent chromium is an essential nutrient and relatively non-toxic,
molecules, which obviously results in lower bioavail-ability and therefore in a lower toxicity rating (Bart-lett & James, 1988; Farmer et al., 2002). In contrast, an oxyanion Cr(VI) is highly mobile in soil and wa-ter systems and weakly sorbed to inorganic surfaces (Kotas & Stasicka, 2000; Pantsar-Kallio et al., 2001). Hexavalent Cr is sensitive to reduction in acidic me-dia and supposedly is reduced to Cr(III) by organ-ic matter (Stollenwerk & Grove, 1985; Farmer et al., 2002). However, Cr(III) easily oxidises to Cr(VI) in a strongly alkaline media (Pilley et al., 2003). Thus, a proper identification of Cr species is required to eval-uate the occurrence and toxicity risks of Cr, its chem-ical transformation in water, soil and air, as well as its distribution and transport in the environment.
Current and upcoming legislation in the Euro-pean Union directly and indirectly forces countries to come up with methods to determine the accurate concentration of Cr(VI) in the environment, along with its potential bioavailability and health effects on a case-by-case basis (Zarogiannis, 2005). In most en-vironmental studies, only total Cr has been analysed (Reimann et al., 1998; Salminen et al., 2004; Sal mi-nen et al., 2005; Tenhola et al., 2004). Despite of a number of methods that have been developed for Cr speciation in aquatic environments, one of the most commonly used methods is based on the coloured complex formation of Cr(VI) with diphenylcarbaz-ide (DPC) (Ball & Mc Cleskey, 2003). Nonetheless, when the concentration of Cr is relatively low, the method may have interference effects caused by or-ganic carbon, humic and fulvic substances, and the presence of coloured species or complexes such as iron with DPC. Adsorbing organic ligands and high met-al concentrations, especimet-ally Fe and Mn, are common in the surface water composition of Finnish mine en-vironments (Lahermo et al., 1996).
The main goal of the present study is to modi-fy a column application for Cr(III) and Cr(VI) of low concentrations in water media. The application tested here is the NH2 column method, which selec-tively sorbed Cr(VI) while Cr(III) remains unsorbed. Originally, it was developed to determine Cr(VI) lev-els in infant milk products by Lameiras et al. (1998)
and Soares et al. (2000). They found that the meth-od was precise and accurate with gometh-od sensitivity for low Cr(VI) concentration. Secondly, it is purpose to examine the effect of storage conditions (freezer and refrigerator) on the oxidation states of Cr in labora-tory.
2. Experimental
2.1. Site description
The study site locates in the Kemi-Tornio area, northern Finland, where chromium concentrations are naturally high in subsoil (82 – 95 mg kg-1),
top-soil (76 – 88 mg kg-1) and stream water (0.7 – 1.0
µg l-1, Salminen et al., 2005). Water samples were
col-lected in the surroundings of the Outokumpu Tornio Works, which is the largest stainless steel production site in the world and locates about 10 km south of the City of Tornio. The works consists of units of fer-rochrome production and stainless steel production and the Kemi Cr mine (25 km southeast), where chr-omite is mined and the ore is then shipped to the Tornio works.
2.2. Materials, supplies and reagents
Water samples were collected with a PE(polyethylene)-decanter into the plastic LDPE (Low density polyethylene)-bottles using Nitrilite® Silky Ultra-Clean gloves (Ansell) for a clean environment and carried in the cool boxes with the cool batteries. The volume of the bottles was 100 ml, 250 ml and 500 ml. Bottles were factory-new. Concentrated Suprapur nitric acid (65 % HNO3 by Merck) was used in the acidification of the water samples. Dissolved chromi-um was measured from the water samples, which were filtered through a 0.45 µm pore size filter (GD/XP sy-ringe filter with polypropylene prefilter and PVDF (polyvinylidene fluoride) -membrane by Whatman) with a 50 ml BD (Becton Dickinson) Plastipak™ disposable syringe.
pre-pared 10% nitric acid, soaked for one day in deion-ised water, rinsed a third time with pure laboratory water and dried in a thermo closet at 50˚C. All the digital pipettes (Finnpipette) were calibrated before use. Samples were filtered through the aminopropyl- modified silica ion-exchange columns, Chromabond NH2 (3ml, 500mg) by Macherey-Nagel, with vacu-um equipment (Baker). Filtered Cr(III), and eluted Cr(VI), water samples were collected in glass tubes (Kimax) with the caps.
For the activation and elution phases of the NH2 column method, the following solutions were pre-pared and used: 1 mol l-1 and 2 mol l-1 Suprapur
ni-tric acid (Merck), ultra-pure laboratory water (resis-tivity 18.2 MΩ cm-1, the PURELAB Ultra system
of ELGA). A standard solution of Cr(VI) was pre-pared by dissolving 2.828 g potassium dichromate (K2Cr2O7) in 1 litre of deionised water. Potassium di-chromate was Merck’s reagent for ACS and ISO anal-ysis. A chromium(III) standard solution was prepared from a 1000 mg l-1 reference solution (Romil Ltd) for
AA, ICP and IC calibration (exp. Jan 2007). Work-ing solutions (20, 40, 60 µg l-1) of Cr(III) and Cr(VI)
were made from the standard solutions by dilution on the same day the NH2 column procedure and filter-ing were done. The pH of the deionised water, which went through the column in the activating phase, was measured with colour-fixed indicator sticks (pH 0 – 14).
2.3. Instrumentation
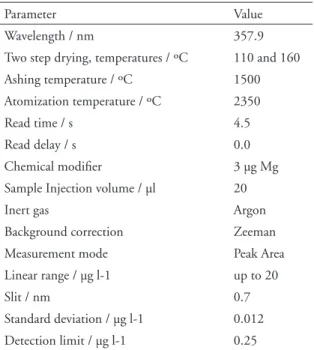
Element concentrations of chromium (dissolved, total) were analysed by inductively coupled plas-ma plas-mass spectrometry (ICP-MS), Thermo Elemen-tal X7, equipped with Collision Cell Technology (CCT/ED). Dissolved chromium and chromium species were quantified by graphite furnace atom-ic absorption spectrometer (GFAAS), Perkin Elm-er SIMAA 6000 with use of end cap transvElm-erse heat-ed graphite tubes (End Cap THGA). The instru-mental conditions of the GFAAS are summarized in Table 1.
2.4. Sampling and field measurements
The sampling sites were selected based on earlier studies by Hookana (2005).At the sites, water soluble Cr(VI) was detected on the surface of lingonberries and lettuces (Hookana, 2005). Fieldwork was carried out at the beginning of May 2005. Soil water and sur-face water samples were collected from two sites near the Outokumpu Tornio Works. The first sampling site was inside the factory area and the other was at the nearest coniferous forest, about 2 km northeast of the works. At the forest site, the snow was melting and in the factory area the snow had already melted away. The ground was thawed and the groundwater level was high.
Soil water samples and the duplicate soil water were taken from 30 cm deep and 40 – 50 cm wide spade-dug pits, which were filled by the soil water within half an hour after digging. Surface water sam-ples were collected in the nearest ditches. Two wa-ter duplicates of 500 ml were taken from both me-dia and at the both sampling sites. The 250 ml sam-ples were pre-treated in the field, while the 500 ml samples were pre-treated later in the laboratory. Wa-ter samples were stored in the refrigerator and freezer
Table 1. Instrumental operating conditions.
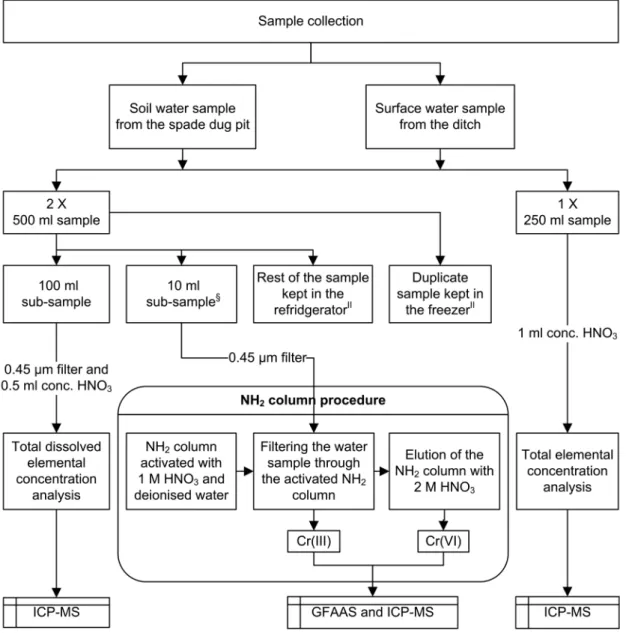
Fig. 1. Schematic presentation of the water samples treatment.
at the Geolaboratory of the Geological Survey of Fin-land (present Labtium Oy) in Kuopio. The schematic presentation of the water sample amounts and treat-ments are in Fig. 1.
After the sampling, pH, oxidation-reduction (re-dox), electric conductivity (EC) and temperature (T)
of the water were measured with the portable field in-struments. The measurements were done in situ from the water in sampling pits and in ditches. A blank sample was not taken during the field experiment.
taken at the same coniferous forest site as the water samples, and the other was taken about 8 km north-east of the plant area. The moist samples were stored in polyethylene bags at 4 °C until the water extrac-tion.
2.5. Sample pre-treatment and element
measurements
After sample collection, the soil water and surface wa-ter samples were immediately pre-treated in the Ou-tokumpu Tornio Works’ laboratory (Fig. 1). At the same time, 50 ml portions of surface water samples were used in the NH2 column procedure. Soil water samples were filtered for Cr(VI) analysis after three days settling because of the large amount of organic material and fine mineral particles. The rest of the soil water samples were left in the refrigerator for three months to settle. In August, the samples of settled soil water, refrigerated soil water and surface water dupli-cates were filtered and acidified similarly to the sam-ples in the Outokumpu laboratory and used for total dissolved Cr analysis.In September, duplicate filter-ing was done to the soil water samples kept in the re-frigerator and freezer and to the surface water sample stored in the freezer.
The 250-ml volume of soil water and surface wa-ter samples were pre-treated in the field in May (Fig. 1). Later, in the geolaboratory of the GTK (present Labtium Oy), these water samples were digested by adding 5-ml volume of Suprapur nitric acid and heat-ed in a water bath at 90 ± 2 ºC for six hours. After heating, the water samples were cooled overnight and the next day centrifuged for element measurement (total concentration). In August and September, the heating treatment with acid was also done to both soil water and surface water samples stored in the refrig-erator and freezer.
The filtrates for total dissolved elemental concen-tration analysis and acid-treated samples for the to-tal elemento-tal concentration analysis were analysed by ICP-MS in the accredited geolaboratory of the GTK (present Labtium Oy) at Espoo.
2.6. NH
2column pre-treatment and chromium
analysis
The NH2 column procedure includes activation, fil-tering and elution (Fig. 1). NH2 columns were acti-vated with 2 x 3 ml 1 M Suprapur HNO3 and washed with 2 x 3 ml ultra pure laboratory water. After acti-vating, the pH of washing deionised water was con-trolled. The filtered (0.45 µm) water samples were poured into the NH2 column and filtered with a vac-uum. In May, the volume of the filtrates was 50 ml of surface water and 30 ml of soil water, and the col-umns were eluted 2 to 3 times with 6 ml of 2 M nitric acid. In August, the volume of the samples of soil wa-ter and surface wawa-ter, and the elution volume of nitric acid was 10 ml. Furthermore, 25 µl of nitric acid was added to the filtrates to ensure that Cr(III) remained in the solution. The chromium concentrations of the filtrates and elutes were measured with GFAAS and, in May, with ICP-MS as a comparative measurement in the accredited geolaboratory of the GTK (present Labtium Oy) at Kuopio.
The selectivity of the NH2 column was tested with the standard working solutions of Cr(III) and Cr(VI) made with deionised water. Concentrations of the so-lutions were 20, 40 and 60 µg l-1. The procedure with
the standards was the same as for the samples: a 10 ml sample was filtered first, and then the column was eluted with 10 ml of 2 M nitric acid. Results are giv-en as means ± standard deviation (SD) of three rep-licates (Table 2). The efficiency of the NH2 column to specify Cr(III) from the Cr(III)-complexes with organic matter was also tested by the standard addi-tion method. A 0.5 ml of 1 mg l-1 standard solution
Table 2. (a) The concentration and recovery of chromium species (µg l-1) in the working standard solutions of
Cr(III) and Cr(VI), and (b) the recovery (%) of Cr(III) obtained from the spiking experiment of aqueous soil ex-tract (LS ratio 4:1) using the NH2 column method (see also the text). Mean recovery is calculated as follow-ing: Standard solution (compared to Cr concentration in standard working solution) = [Filtrate Cr(III) or Eluent Cr(VI)/ standard solution Cr]*100.
Oxidation state of Cr
Working solution of Cr (µg l-1)
Filtrate, mean ±SD (µg l-1)
Eluent, mean ±SD (µg l-1)
Mean recovery (%) n
Cr(III) 20 10.8 ± 0.47 0.50 ± 0.05 53.8 3 40 28.4 ± 0.92 0.20 ± 0.07 71.0 3 60 45.2 ± 0.12 0.14 ± 0.06 75.3 3 Blank 0.10 ± 0.03
Cr(VI) 20 2.8 ± 0.5 13.2 ± 2.7 65.8 3 40 2.8 ± 0.5 29.3 ± 5.2 73.3 3 60 2.8 ± 2.3 40.3 ± 1.6 67.1 3 Blank 1.9 ± 0.4
Sample of the extract Cr(III)-add (µg l-1)
Cr-add in filtrate (µg l-1)
Cr-add in eluent (µg l-1)
Cr recovery in filtrate (%)
Forest 50 46.9 2.5 94
Reference site 50 47.9 4.3 96 Reference site, duplicate 50 47.2 4.5 94
Tap water 50 47.6 0.0 95
3. Results and discussion
3.1. Chromium speciation with standard and
spiked solutions
Results from the test with both Cr(III) and Cr(VI) diluted working standard solutions (20, 40 and 60 µg l-1) showed that the recovery of the standards
var-ied between 53.8 % and 75.3 % for both chromium species (Table 2a). Concentrations of the Cr work-ing solutions were measured before and after filter-ing through the column. However, the concentra-tions of Cr(III) in the unfiltered working soluconcentra-tions were much lower than in the filtrates. Obviously, Cr in the diluted standard solutions of Cr(III) adhered to the sides of the glass container, resulting in a low concentration of Cr. This interpretation is based on the fact that the addition of the Suprapur nitric acid slightly increased the concentration of Cr(III) in the unfiltered working standard solutions. The difference between the Cr(VI) working standard solutions and Cr(VI) concentrations in the eluents was not signifi-cant when considering the standard deviation.
Due to the low recoveries of aquatic working solu-tions of Cr species, the aqueous soil extract from the humus sample was spiked with a standard solution of Cr(III) (50 µg l-1). The recoveries of Cr(III) in the
fil-trates was 94 – 96 % (Table 2b). This indicates that the lack of organic shielding material in the deion-ised water of the standard solutions obviously causes the low recoveries from aquatic working solutions. Cr species from the aquatic working solution may dif-fuse inside the column’s solid stationary phase parti-cle’s pore and are not therefore able to leach out from the column with nitric acid-solvent, unlike those of the spiked soil extracts and environmental water sam-ples with the high organic matter content (see chap-ter 3.2).
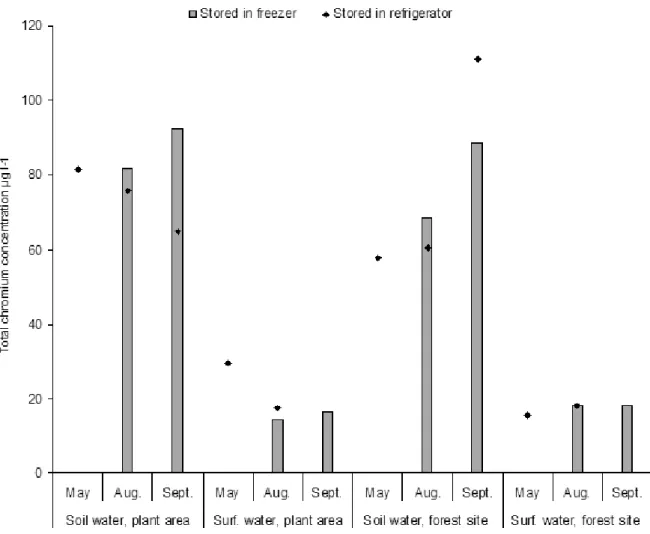
Fig. 2. Total Cr concentration (µg l-1) of the soil water and surface water samples measured in May, August and
Sep-tember 2005, Tornio, Finland. Keys: Plant area refers to the sampling site in the factory area of the Outokumpu Tornio Works and forest site to the sampling site in the forest area about 2 km from the works. The number of samples stored in the fridgerator was 10 and in the freezer 8.
that the use of a Finnish surface water sample as a matrix for spiking may cause interferences due to the variable content of organo-Fe complexes, and frac-tionating problems of the standard solution.
According to the results, the NH2 column sep-arates organically bound Cr(III)-complexes, and Cr(III)-complexes will not significantly replace aquat-ic Cr(VI)-complexes in the elution stage of the meth-od. The results also confirmed that the NH2 column separates Cr(VI) from Cr(III) from water samples of the low Cr concentration.
3.2 .Total and dissolved chromium concentration
of surface water and soil water samples
In the plant area, total Cr concentrations of the soil water were between 65 µg l-1 and 90 µg l-1 and in the
surface water between 15 µg l-1 and 30 µg l-1 (Fig. 2).
At the forest site, the total concentrations were, on average, somewhat lower than in the plant area, and similarly soil water contained more chromium than surface water.
sites. This indicates that Cr in soil water and surface water is predominantly bound in solid particles, as hydrated oxides, complexed by organic matter and/or Fe-precipitates of soils (Farmer et al., 2002; Räisänen et al., 1997). In contrast to the total Cr contents, the concentrations of dissolved Cr in soil water were higher (mean 17 µg l-1) at the forest site than in the
plant area (10 µg l-1, Fig. 3). The same trend was also
seen in the surface water.
The sample preserving time did not show an un-ambiguous effect on the Cr concentrations (Figs. 2 – 3). The variation was within the uncertainty in in-strumental measurement (15 %). In addition, the concentration of dissolved chromium was the same
regardless of the storage method. Moreover, the Cr concentrations were stable during the four months. That was unexpected for the dissolved chromium concentration. Any change in dissolved Cr concen-tration was not observed even after a harsh shaking procedure.
3.3. Chromium speciation in surface water and
soil water samples
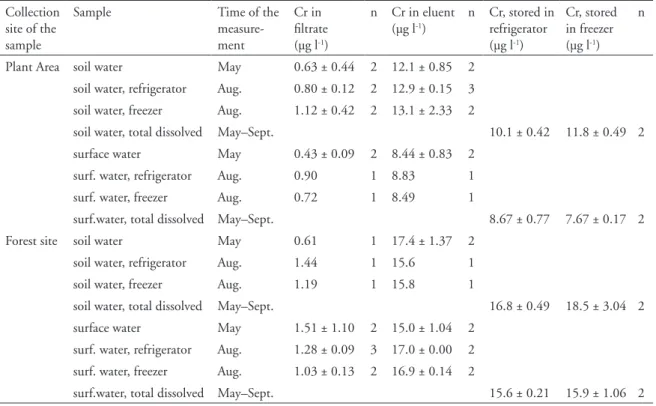
In the plant area, mean dissolved Cr(VI) concentra-tion of soil water was about 12 µg l-1, and in the
sur-face water about 9 µg l-1 (Table 3). At the forest site,
the Cr(VI) concentration in the soil water was about
Fig. 3.Total dissolved Cr concentration (µg l-1) in the soil water and surface water samples measured in May,
16 µg l-1 and in surface water about 15 µg l-1. At both
sites, the mean concentrations of Cr(III) were be-low 2 µg l-1. However, one subsample of soil water
from the forest site gave an anomalously high Cr(III) concentration, 8 µg l-1. With this value, the average
Cr(III) concentration for the soil water of the forest site would be 3.5 mg l-1.
The summed recoveries of the Cr species were equal to the total concentration of dissolved mium (Table 3). The recovery of the dissolved chro-mium measured by ICP-MS was between 95 % and 108 % and by GFAAS between 108 % and 119 %, which can be considered comparable within the un-certainty. Nevertheless, results showed that the dis-solved chromium was almost entirely in the hexava-lent form. After the elution stage, Cr(VI) concentra-tions contained a positive elution error, approximate-ly 2 µg l-1.
Assuming that dissolved Cr in the surface water was almost entirely Cr(VI), measurable
concentra-tions of Cr(VI) in soil water were unexpected. We presumed that the organic carbon in the litter and humus layer would reduce Cr(VI) to Cr(III). Accord-ing to the DPC-method, water samples that contain high levels of organics or sulphides can cause rapid re-duction of soluble Cr(VI) to Cr(III) (US EPA, 1994). Even then, the ratio of Cr(VI) to Cr(III) in dissolved solutions remained unchanged during the preserva-tion time. Similar findings regarding the slow reduc-ing time of Cr(VI) to Cr(III) have been presented in Cr(VI) studies for milk products (reduced in 48 hours) (Soares et al., 2000).
3.4. Suitability of the NH
2column application
for chromium species
The NH2 column was able to separate Cr(III) as [Cr(NO3)3] and Cr(VI) as [K2Cr2O7], but the recov-eries of Cr species (53.8 – 75.3 %) and standard de-viations remained unexplained and exceptionally low.
Table 3. Mean concentrations and standard deviations of the dissolved Cr and Cr species in soil water and
sur-face water samples analysed with the NH2 column method. The concentration of dissolved Cr in water samples was measured during the period from May to September, and Cr(III)-filtrates and Cr(VI)-eluates in May and in August in 2006.
Collection site of the sample
Sample Time of the measure-ment
Cr in filtrate (µg l-1)
n Cr in eluent (µg l-1)
n Cr, stored in refrigerator (µg l-1)
Cr, stored in freezer (µg l-1)
n
Plant Area soil water May 0.63 ± 0.44 2 12.1 ± 0.85 2 soil water, refrigerator Aug. 0.80 ± 0.12 2 12.9 ± 0.15 3 soil water, freezer Aug. 1.12 ± 0.42 2 13.1 ± 2.33 2
soil water, total dissolved May–Sept. 10.1 ± 0.42 11.8 ± 0.49 2 surface water May 0.43 ± 0.09 2 8.44 ± 0.83 2
surf. water, refrigerator Aug. 0.90 1 8.83 1 surf. water, freezer Aug. 0.72 1 8.49 1
surf.water, total dissolved May–Sept. 8.67 ± 0.77 7.67 ± 0.17 2 Forest site soil water May 0.61 1 17.4 ± 1.37 2
soil water, refrigerator Aug. 1.44 1 15.6 1 soil water, freezer Aug. 1.19 1 15.8 1
soil water, total dissolved May–Sept. 16.8 ± 0.49 18.5 ± 3.04 2 surface water May 1.51 ± 1.10 2 15.0 ± 1.04 2
surf. water, refrigerator Aug. 1.28 ± 0.09 3 17.0 ± 0.00 2 surf. water, freezer Aug. 1.03 ± 0.13 2 16.9 ± 0.14 2
In contrast, the recoveries of soil water and surface water samples were comparable to the concentrations of the total dissolved Cr.
Adjustment of the pH during the NH2 procedure with Cr working standard solutions may also be more important than presumed. Deionised water’s acid-ity was measured after the activating. The pH was 4-5, which is somewhat lower than the pH of the soil water and surface water samples. Nevertheless, the NH2 column procedure includes several uncertain-ties. Chromate can be sorbed differently in the NH2 column than dichromate, which results in the low re-coveries of Cr standard solutions. Secondly, the influ-ence of the deionised water on the redox state of the Cr(VI) compounds is not well understood. Another question is connected to the dilution of the Cr stand-ard solutions and the stability of Cr species.
Despite of the abovementioned uncertainty fac-tors, the NH2 column fractionates Cr species with al-most 100 % specificity for the Tornio area environ-mental water samples used in the present study. The elution stage raised the Cr(VI) concentration about 2 µg l-1 in the both environmental water samples and
the deionised working standard solutions. The posi-tive error may be the result of Suprapur nitric acid, which contains a maximum 1.0 µg l-1 Cr, in addition
to dissolving particles from the column material and the instrumental limit of quantification. After the re-duction of the elution stage’s error, the recoveries of Cr species were over 92 % as measured by GFAAS.
Furthermore, other possible factors include where the organic material in water samples (going through the filter) presses too hard, and the overload of the NH2 column, which was seen once as occasional high Cr(III) concentration, 8 µg l-1 after NH
2-filtration.
Also, the duplicate water samples taken from differ-ent bottles than the initial water samples may be a reason for the poor precision of the Cr concentra-tion. The incomplete melting of the duplicate soil water samples frozen occurred in the second meas-urement (in September), can also be a possible error factor. The significance of the errors mentioned above is impossible to statistically quantify due to the small number of samples in the present study.
3.5. Comparison of methods
The DPC-method (USEPA 218.6, for drinking wa-ter, groundwater and industrial wastewater) empha-sizes that samples must be filtered and adjusted to pH 9 – 10 in the field (Ball and Mc Cleskey, 2003), stored at 4 °C and analysed within 24 hours of col-lection (USEPA, 1994) to ensure that the dissolved Cr species remain unchanged. Anionic species such as chloride and sulphate may cause interference in DPC-method (USEPA, 1994), but according to Ball and Izbicki (2004), the most serious interference with USEPA DPC-method is caused by Fe. Concen-trations of Fe(II) and Fe(III) 50 times greater than Cr(VI) dramatically decrease the recovery of Cr(VI) in the DPC-method (Ball and Izbicki, 2004). In the present study, concentrations of dissolved iron in soil water and surface water samples were almost 60-fold at maximum and 8-fold at minimum compared to the concentration of Cr(VI). Therefore, the NH2 col-umn method appears to be less sensitive to the inter-ferences of other metals or sulphates, and easier to use (no pH adjusting) with longer preservation time of water samples (over 24 hours) than the DPC-method commonly used in Finland.
According to the results, the application of the NH2 column method is adequate for identifying Cr(VI), especially at low concentrations and with-out interference from other metals or sulphate. Fur-thermore, the results showed a clear relation between the dissolved chromium and the sum of Cr species, Cr(III) and Cr(VI), measured. This relation allows us to quantify the concentration of Cr(VI) by deduct-ing the concentration of Cr(III) from the total con-centration of the dissolved Cr instead of the elution stage measurement. The deducting will significantly decrease the cost of the Cr speciation and will quick-en the analysis procedure.
interfer-ing agents and the problem with the Cr standard so-lution remained unsolved. The pure deionised water may not be the right matrix for the NH2 column or the pH will need adjusting during procedure.
4. Conclusion
The NH2 column method application was successful for the determination of Cr(VI) and Cr(III) in envi-ronmental water samples. The NH2 column proce-dure is precise and selective for soil water and surface water samples with low concentration of chromium species. Other metals or sulphates, or high dissolved organic material do not interfere with the speciation of Cr species. The sum of Cr species concentrations was approximately equal to the total dissolved Cr concentration. This finding suggests that the concen-tration of Cr(VI) can be quantified by deducting the concentration of Cr(III) from the total concentration of the dissolved Cr instead of the elution stage meas-urement. The fractionation of the Cr species from the standard solutions showed difficulties with the unac-ceptably low recoveries, which will need further ex-perimentation.
The results showed that Cr(VI) is not so sensi-tive to reduce Cr(III) during sampling, transport and storage. Overall, the case study shows that the dis-solved chromium in the environmental water is in the form of Cr(VI). This is true even though the concen-trations in soil and surface waters are small (< 25 µg l-1). The findings reveal a misunderstanding of the Cr
behaviour in the northern hemisphere. Furthermore, the NH2 column application will offer a good possi-bility for the studying the chromium species in the Finnish mining and metal industry environment.
Acknowledgments
The Authors would like to thank Prof. Reijo Salmi-nen and Prof. Sari MakkoSalmi-nen and Mr. Olli Lehto for their guidance. We also want to give thanks to Mrs. Seija Hamström for laboratory assistance in the ex-periment. Furthermore, we acknowledge the support of Dr. J. Ylimaunu from Outokumpu Oyj.
References
Ball, J.W. & Izbicki, J.A., 2004. Applied Geochemistry 19, 1123–1135.
Ball, J.W. & McCleskey, R.B., 2003. A new cation-exchange method for accurate field speciation of hexavalent chro-mium. Water-Resources Investigations, Report 03-4018, USGS, Colorado.
Bartlett, R.J. & B.R. James. 1988. Mobility and bioavail-ability of chromium in soils. Advanced in environmen-tal science and technology 20, 267–304.
Costa, M., 1997. Toxicity and Carsinogenity of Cr(VI) in Animal Models and Humans. Critical Review in Toxi-cology 27 (5), 431–442.
Farmer, J.G., Thomas, R.P., M.C., Graham, J.S., Geelhoed, J.S., Lumsdon, D.G. & Paterson, E., 2002. Chromi-um speciation and fractionation in ground and surface waters in the vicinity of chromite ore processing resi-due disposal sites. Journal of Environmental Monitor-ing 4, 235–243.
Hookana, H., 2005. Chromium in Soil and Food Plants Ad-jacent to a Stainless Steel Works – The Additional Di-etary Intake for Humans. M.Sc. Thesis. Department of Environmental Science, University of Jyväskylä, 89 p. Kotas, J. & Stasicka, Z., 2000. Chromium occurrence in
the environment and methods of its speciation. Envi-ronmental Pollution 107, 263–283.
Lahermo, P., Väänänen, P., Tarvainen, T. & Salminen, R., 1996. Geochemical atlas of Finland. Part 3: Environmen-tal geochemistry – stream waters and sediments. Geolog-ical Survey of Finland, Espoo, 149 p.
Lameiras, J., Soares, M.E., Bastos, M.L. & Ferreira, M., 1998. Quantification of total chromium and hexava-lent chromium in UHT milk by ETAAS. Analyst 123, 2091–2095.
O’Brien, P. & Wang, G., 1989. Coordination chemistry and the carcinogenicity and mutagenicity of chromium(VI). Environmental Geochemistry and Health 11 (3), 77–85.
Pantsar-Kallio, M., Reinikainen, S.-P. & Oksanen, M., 2001. Interactions of soil components and their effects on speciation of chromium in soils. Analytica Chimica Acta 439, 9–17.
Pillay, K., Von Blottnitz, H. & Petersen, J., 2003. Ageing of chromium(III)-bearing slag and its relation to the at-mospheric oxidation aof solid chromium(III)-oxide in the presence of calcium oxide. Chemosphere 52 (10), 1771–1779.
Räisänen, M.L., 1996. Geochemistry of podzolized tills and the implications for aluminium mobility near industri-al sites: A study in Kuopio, eastern Finland. Geologicindustri-al Survey of Finland Bulletin 387, 72 p.
the central Barents region. Geological Survey of Nor-way, NGU-GTK-CKE special publication, Trondheim, 745 p.
Salminen, R. (ed.), Batista, M.J., Bidovec, M., Demetria-des, A., De Vivo, B., De Vos, W., Duris, M., Gilucis, A., Gregorauskiene, V., Halamic, J., Heitzmann, P., Lima, A., Jordan, G., Klaver, G., Klein, P., Lis, J., Locutura, J., Marsina, K., Mazreku, A., O’Connor, P.J., Olsson, S.Å., Ottesen, R.-T., Petersell, V., Plant, J.A., Reeder, S., Sal-peteur, I., Sandström, H., Siewers, U., Steenfelt, A. & Tarvainen, T., 2005. Geochemical Atlas of Europe. Part 1: Background Information, Methodology and Maps. Geological Survey of Finland, FOREGS special publi-cation, Espoo, 526 p.
Salminen, R., Chekushin, V., Tenhola, M., Bogatyrev, I., Glavatskikh, S.P., Fedotova, E., Gregorauskiene, V., Kashulina, G., Niskavaara, H., Polischuok, A., Rissanen, K., Selenok, L., Tomilina, O. & Zhdanova, L., 2004. Geochemical atlas of the eastern Barents region. Elsevi-er, Amsterdam, 548 p.
Soares, M.E., Bastos, M.L. & Ferreira, M., 2000. Selective Determination of Chromium (VI) in Powdered Milk Infant Formulas by Electrothermal Atomization Atom-ic Absorption Spectrometry after Ion Exchange. Journal of AOAC International 83 (1), 220–223.
Stollenwerk, K.G. & Grove, D.B., 1985. Reduction of He-xavalent Chromium in Water Samples Acidified for Pre-servation. Journal of Environmental Quality 14, 396– 399.
Tenhola, M., Lahermo, P, Väänänen, P. & Lehto, O., 2004. Alueellisessa geokemiallisessa purovesikartoituksessa to-dettujen fysikaalisten ominaisuuksien ja alkuainepitoi-suuksien vertailu Suomessa vuosina 1990, 1995 ja 2000. Summary: Comparison of physical properties and ele-ment concentrations in the regional geochemical map-ping of stream water in Finland during 1990, 1995, and 2000. Geological Survey of Finland, Report of Investi-gation 159, 35 p..
US EPA, 1994. Method 218.6. Determination of dissolved hexavalent chromium in drinking water, groundwater, and industrial wastewater effluents by ion chromatogra-phy. Revision 3.3. U.S. Environmental Protection Agen-cy, Cincinnati, Ohio. In: WWW-page: http://www.wcas-lab.com/tech/218_6.pdf