Available online at www.sciencedirect.com
ScienceDirect
Procedia Earth and Planetary Science 00 (2017) 000–000
www.elsevier.com/locate/pr ocedia
1878-5220 © 2017 The Authors. Published by Elsevier B.V.
Peer-review under responsibility of the organizing committee of WRI-15.
15th Water-Rock Interaction International Symposium, WRI-15
North-eastern Morocco: a high geothermal prospect
Antonio Correia
a, Abdelkrim Rimi
b, Yassine Zarhloule
c, Julio Carneiro
aaInstitute of Earth Sciences, University of Evora, R.Romao Ramalho 59, 7000-671 EVORA, Portugal bMohammed V University, Scientific Institute, Ibn Battouta Avenue, B.P. 703, 10106 Rabat, Morocco
cLaboratory of Hydrogeology-Environment, Faculty of Sciences, Oujda, Morocco
Abstract
New temperature data obtained in 2007 in a hydrogeological borehole (1100 m deep) near Berkane have revealed an average geothermal gradient of about 126 ºC/km at depths greater than 300 m. This result confirms the average geothermal gradient estimated in a mining borehole located about 30 km west of the Berkane borehole, in which water with temperatures as high as 96 ºC was reached at a depth of about 700 m. The new geothermal gradient, exceeding by far the ones already determined for this Moroccan area allows thinking about the possibility of programs for using high temperature waters in north-eastern Morocco.
Keywords: Morocco; Geothermal prospect; Heat flow density; Geothermal potential assessment
1. Introduction
In the last decade there has been a renewed interest in the use of geothermal energy for power generation (high enthalpy geothermal resources) and for domestic, industrial and therapeutic uses (low enthalpy geothermal resources). Morocco has followed that same trend and so, since the eighties of the last century, several geothermal campaigns have been organized to collect geothermal data to construct a heat flow density (HFD) map for the territory of the Kingdom of Morocco; the last version of the map can be seen in Fig. 1. From the map it is obvious that the northeast part of Morocco presents the highest heat flow density values for the country. A detailed heat flow density map for that area is shown in Fig. 2 and values higher than 110 mW/m2 were obtained there.
With the objective of obtaining geothermal data to infer the geothermal potential of eastern Morocco, an exploratory geothermal survey was conducted in February of 2007 in north-east Morocco, in the region of Oujda.
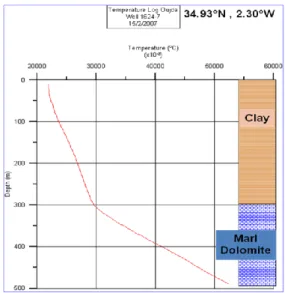
One borehole in particular (borehole 1624-7 (34.93°N, 2.30°W) in the region of Berkane, see Fig. 2 and Fig. 4) shows a high geothermal gradient and a high geothermal prospect. The well is located 30 km west of Berkane (see Fig. 2).
Corresponding author. Tel.: +351 266745322; fax: +351 266745394. E-mail address: [email protected]
Fig. 1. Heat flow density map for Morocco. The map must include a scale and a north arrow. The study site should be identified. Suggestion: the map should show the Morocco’s territorial borders.
Fig. 2. Detail of the heat flow density map for the northeast part of Morocco shown in Fig. 1. Berkane and Kariat Arekman boreholes are also shown. The town of Oujda is located to the east of the Berkane borehole. The map must include a scale and a north arrow. The text within the map must be in English.
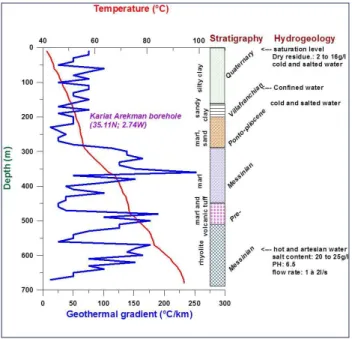
Even though it was not considered for geothermal potential calculation of the area, another borehole measured in the late seventies of the last century is also shown in Fig. 3 (Kariat Arekman borehole (35.11N, 2.74W). See Fig. 2 for location).
As in the Berkane borehole, the Kariat Arekman borehole shows a very high heat flow density and temperatures as high as 93 oC at 650 m depth.
Correia et al./ Procedia Earth and Planetary Science 00 (2017) 000–000 3
borehole because all other boreholes in the area present, on average, the same geothermal characteristics of that borehole.
Fig. 3. Kariat Arekman borehole which location is shown in Fig. 2. The temperature log is the red line; the blue line is the geothermal gradient as a function of depth. Instead of “cold and salted water” the authors should write “cold salt water”. Instead of “PH” the authors should write “pH”.
2. The thermal data
Figure 4 shows the temperature log obtained in borehole 1624-7 in the region of Berkane. The temperature log was obtained with an ANTARES Temperature Datalogger.
In Fig. 4 the geothermal gradient substantially increases at a depth of 300 m and could, to a certain extent, be explained by a change in lithology. However, the interesting fact is that, instead of decreasing (as it should because dolomites have higher thermal conductivity than clay), the geothermal gradient increases. For the moment there are no thermal conductivity measurements and so no heat flow density estimate can be done; however, there are plans to collect rock samples of the geologic formations crossed by the borehole to estimate the heat flow density for the borehole and for the area where it is located.
3. Results for the Berkane borehole
The change in the geothermal gradient in the Berkane borehole (Fig. 4) is not a result of a thermal conductivity change. A simple calculation shows that the average geothermal gradient above 300 m is about 29 ºC/km (0.0293 ºC/m) while the geothermal gradient below 300 m is about 127 ºC/km (0.1275 ºC/m). At a depth of about 470 m the temperature is 50 ºC, and assuming that the same formation reaches depths of 700 m (see lithologic log) this means that an estimated temperature of about 78 ºC is attained at about 700 m.
If a thermal conductivity of 1.5 W/mK is assumed for the clay above 300 m and a thermal conductivity of 4.0 W/mK for the dolomites below 300 the heat flow density along the borehole is not constant and therefore there is geothermal energy trapped for levels below 300 m deep. The estimated heat flow density above 300 m is 43 mW/m2, and below 300 m is 510 mW/m2.
If it is further assumed the borehole is representative of the geologic, hydrogeologic, and thermal status for a relatively large area (tens of square km), an estimate of the heat in place (H0) within the aquifer can be calculated
Fig. 4. Berkane borehole shown in Fig. 2. The temperature log is the red line.
using the following equation:
(1)
A reference regarding this equation is required
where Φ is the effective porosity, C is the mean specific capacity (J/kgK), ρ is the mean density of the rock column (kg/m3), T
t is the temperature at the top of the aquifer (ºC), T0 the average regional temperature at the surface of the
earth (ºC), A is the area of the aquifer, and Δz is the thickness of the aquifer; the subscripts m and w refer to rock matrix and water, respectively.
For the Berkane borehole, if it is assumed that: Φ=0.1, T0 =20 ºC, Tt=30 ºC, ρw=1000 kg/m3, ρm=2600 kg/m3,
Cw=4190 J/kgK, Cm=840 J/kgK, the heat in place per square metre is about 9.5 x 10⁹ J/m2 (~ 9.5 GJ/m2).
It must be said that it was possible to go with the temperature datalogger as deep as 900 m in the borehole; however, we were not expecting that temperatures as high as 50 ºC would be reached at depths of about 500 m and so the temperature datalogger saturated just above 50 ºC. The next temperature log must then be obtained with a temperature datalogger that allows to measure temperatures higher than 50 ºC.
4. Conclusions
1. In the region of Berkane (eastern Morocco) temperatures higher than 50 ºC were measured in a borehole at depths of about 470 m.
2. The estimated heat in place per square metre is about 9.5 GJ. 3. The geothermal prospect for the Berkane area appears to be high.
4. Other boreholes in the region have to be temperature logged so that the evaluation of the geothermal reserve can be more accurately estimated.
C
C
T
T
A
z
Correia et al./ Procedia Earth and Planetary Science 00 (2017) 000–000 5
Acknowledgements
This study was performed under the framework of the bilateral Project CNRST-GRICES SDT/09, funded by FCT (the Portuguese Foundation for Science and Technology) and CNRST (the Moroccan National Centre for Scientific and Technology Research).