Contributo para o estudo da aplicação de probióticos comerciais em aquacultura: sua utilização no cultivo de espécies com interesse comercial
187
0
0
Texto
(2)
(3) Universidade de Trás-os-Montes e Alto Douro. Contributo para o estudo da aplicação de probióticos comerciais em aquacultura. Sua utilização no cultivo de espécies com interesse comercial. Tese de Doutoramento em Ciência Animal. Nome do candidato Maria Amélia Moreira da Silva Diegues Ramos Orientador(es):. Doutor Rodrigo Otávio de Almeida Ozório Doutor Paulo José de Azevedo Pinto Rema. Composição do Júri: Doutor Vicente de Seixas e Sousa Doutor Newton Carlos Marcial Gomes Doutor Rodrigo Otávio de Almeida Ozório Doutora Maria José Marques Gomes Doutor José Júlio Barros Gonçalves Martins. Vila Real, 2017.
(4)
(5) The author of this thesis was involved in all the planning and execution of the experimental work presented (except the DGGE technique). Was the main responsible for the data analysis, interpretation of results, the writing of the thesis and the scientific papers published in international journals.. Publications: M. Amélia Ramos, José F. Gonçalves, Benjamín Costas, Sónia Batista, Rebecca Lochmann, Maria A. Pires, Paulo Rema, Rodrigo Ozório. Commercial Bacillus probiotic supplementation of rainbow trout (Oncorhynchys mykiss) and brown trout (Salmo trutta): growth, immune responses and intestinal morphology. Aquaculture Research, (In press; DOI:10.1111/are.13090). M.A. Ramos, J.F.M. Gonçalves, S. Batista, B. Costas, M.A. Pires, P. Rema, R.O.A. Ozório. 2015. Growth, immune responses and intestinal morphology of rainbow trout (Oncorhynchus mykiss) supplemented with commercial probiotics. Fish & Shellfish Immunology 45 (1), 19-26. Doi: 10.1016/j.fsi.2015.04.001. Ramos, M.A., Weber, B., Gonçalves, J.F., Santos, G.A., Rema, P. & Ozório, R.O.A. 2013. Dietary probiotic supplementation modulated gut microbiota and improved growth of juvenile rainbow trout (Oncorhynchus mykiss). Comparative Biochemistry and Physiology, Part A: Molecular & Integrative Physiology, 166 (2), 302-307. Doi: 10.1016/j.cbpa.2013.06.025. Ramos, M. A., S. Batista, M. A. Pires, A. P. Silva, L. Pereira, M. J. Saavedra, R. Ozório, P. Rema. Dietary probiotic supplementation improves growth and the intestinal morphology of Nile tilapia. Animal, 1-11. Doi: 10.1017/S1751731116002792.. Conferences attended and posters presented: Ramos, M.A., Gonçalves, J.F., Costas B., Marujo, V., Ramos, B., Rema, P., Ozório, R., 2011. Dietary probiotics supplementation on growth performance and immune responses in rainbow trout. IV Fórum Ibero-Americano dos Recursos Marinhos e da Aquacultura, 2729 October 2011, Viana do Castelo, Portugal.. III.
(6) Ramos, M.A., Kopecka-Pilarczyk, J., Gonçalves, J.F., Pires, M.A., Martins, P., Silva, A., Rema, P., Ozório, R., 2012. Growth performance, gut morphology and oxidative stress responses of rainbow trout (Oncorhynchus mykiss) and brown trout (Salmo trutta) fed dietary probiotic supplementation. XV International Symposium on Fish Nutrition and Feeding. 4 - 7 June 2012, Molde, Norway. Ramos, M.A., Gonçalves, J.F., Costas, B., Batista, S., Lochmann, R., Rema, P., Ozório, R., 2012. Immune responses in rainbow trout (Oncorhynchus mykiss) and brown trout (Salmo trutta) fed dietary probiotic supplementation. XV International Symposium on Fish Nutrition and Feeding. 4 - 7 June 2012, Molde, Norway. Ramos, M.A., Gonçalves, J.F., Costas, B., Batista, S., R., Rema, P., Ozório, R., 2013. Rainbow trout (Oncorhynchus mykiss) immune parameters are modulated after dietary probiotic supplementation. First international conference on fish and shellfish immunology, 25 28 June 2013, Vigo, Spain. Maria A. Ramos, Sónia Batista, Cátia Ramos, Rodrigo Ozório, Paulo Rema, 2014. Effect of dietary probiotic dose and duration on immune and oxidative stress parameters in juvenile tilapia (Oreochromis niloticus). International Meeting in Marine Resources, 10-11 July 2014, Peniche, Portugal. M.A. Ramos, C. Ramos, L.F. Pereira, R. Ozório, P. Rema, 2014. Effect of dietary probiotic dose and duration on growth performance and digestibility in juvenile tilapia (Oreochromis niloticus). Aquaculture Europe 2014, 14-17 October 2014, Donostia, San Sebastian, Spain.. IV.
(7) Agradecimentos. Este trabalho não teria sido possível sem o contributo de muitas pessoas. Quero deixar expresso o meu sincero reconhecimento pelo seu envolvimento e agradecer o seu apoio: Os meus orientadores: Dr. Rodrigo Ozório, que numa conversa casual, sabendo da minha necessidade de fazer o doutoramento por motivos profissionais, imediatamente me apoiou e lançou este desafio e o Prof. Paulo Rema, que prontamente embarcou nesta aventura. O seu apoio, orientação, confiança e amizade foram cruciais para concretizar o trabalho. Estou particularmente grata pelo enorme esforço de correção da tese que fizeram em tempo “record”. Os meus orientadores oficiosos: Drs. José Fernando Gonçalves, Maria dos Anjos Pires e Benjamín Costes. O Prof. José Fernando (ICBAS) que depositou uma enorme confiança em mim, disponibilizando todos os seus recursos laboratoriais e fez-me sentir da casa. A Prof. Maria dos Anjos (UTAD) pelo seu papel essencial e activo nas tarefas histológicas, mas sobretudo pela sua energia positiva e encorajadora, que muito me estimulou. O Benjamín, meu mestre nas técnicas imunológicas aqui aplicadas, sempre disponível para ensinar e esclarecer todas as minhas dúvidas, numa altura em que o seu tempo era muito escasso. A Prof. Maria José Saavedra, pelo apoio na microbiologia e pela ajuda preciosa no espalhamento de placas de cultura na UTAD, várias vezes até bem perto da meia-noite. A Dra. Luísa Valente, por ter disponibilizado o laboratório para as análises que precisasse. Mas principalmente por ser encorajadora e sempre me fazer sentir parte da sua equipa, como quando de imediato me incluiu no grupo de alunos a levar à boleia para o congresso AE2014. A Sónia Batista, “companheira de luta” como carinhosamente nos designamos. Não sei como teria feito as amostragens sem ela, particularmente a parte envolvendo o rim anterior. Trabalhadora e generosa, foi um importante pilar neste trabalho. O Miguel Ramos e o Prof. Américo Sousa, da FCUP. O Miguel teve um importante e activo papel em tarefas microbiológicas, que provaram como a ciência pode ser surpreendente e desconcertante. Juntamente com a Joana, e muitas estagiárias, passamos muitas horas à volta de uma enorme pilha de placas de petri que parecia não diminuir. Estou particularmente grata por terem despendido tanto tempo a ajudar-me, numa altura em que o seu tempo também era muito escasso. O Carlos Gravato, mestre das técnicas do stress oxidativo. Foi estimulante trabalhar com um cientista tão experiente e com tanto prazer por trabalhar na bancada e partilhar o seu saber. Os responsáveis pela monitorização diária dos peixes em experiência: o Bruno Ramos e as estagiárias Priscila, Adriana e Vanessa Marujo, que ajudaram nas primeiras e segundas experiências no ICBAS e o António Júlio Pinto (Toni), Cátia Ramos e Carla Tomás na UTAD. Foram uma ajuda indispensável, especialmente nas amostragens: o Bruno paciente e exímio dissecador de peixes, o Toni habilíssimo na retirada de sangue, a Cátia entusiasta e atenta, a Carla, crucial na logística do laboratório,. V.
(8) sempre com um sorriso e uma palavra simpática. A Priscila, Adriana e Vanessa, trabalhadoras e interessadas, partilhando da responsabilidade de cuidar os peixes ao fim-de-semana, “libertaram-me” em vários. Todos eles foram além das suas tarefas diárias por dedicação, generosidade e amizade. Os Drs. Gonçalo Santos, Barbara Weber, Mathieu Castex, Tiago Aires e Eng.º Manuel Ortigão pela disponibilização dos probióticos, dieta, ajuda analítica e discussão de resultados. Os elementos do LANUCE: Vera, Alexandra e Inês, pelo auxílio em algumas análises de dietas e fezes. O Bruno, pela companhia na bancada do laboratório. O Luís e Augusto, pelo auxílio na análise das enzimas digestivas. A Andreia e Maria João pela ajuda com o material e reagentes. O Pedro Reis pelas análises do ítrio e crómio. O Paulo César pela aula de amostragem do rim craneal em assepsia e pelo poema ao macrófago, que sempre recordaremos com um sorriso. A Carla Dias pelo auxílio no laboratório de Microbiologia da UTAD e a Prof. Maria Manuel Oliveira na utilização do espectrofotómetro de placas da UTAD. Os “ex-lanucianos” Pedro, Joana e Cláudia pelo estímulo e discussão científica, mas sobretudo pelas gargalhadas que tanto enriquecem os congressos. À Sofia e família, por todas as vezes que me acolheram em Vila Real. A sua genuinidade e modéstia são inspiradoras. A algumas pessoas da ESAC: a Alexandra, pela partilha do almoço “do costume” mas sobretudo pela partilha do stress e ansiedade que acompanha esta fase. O seu alento e amizade foram muito importantes para prosseguir nos momentos mais difíceis destes últimos anos. A Isabel Herder pela solidariedade. A Dra. Miló, pela boa equipa que fazemos e por ter segurado “as pontas” inúmeras vezes. A D. Adosinda e Ana Paula pela ajuda em algumas análises. A Susana Dias pelo auxílio na microbiologia. Mais do que o trabalho científico, que é o objetivo destes trabalhos, ficarão os contactos e as relações Humanas construídas. Várias das pessoas aqui referidas eram já conhecidas do tempo do mestrado, mas muitas outras tive o prazer de conhecer e o privilégio de trabalhar com elas. Algumas dessas pessoas constituem referências profissionais para mim e outras passaram a estar no grupo de amigos. Principalmente por isso, este trabalho valeu a pena! Foi um período longo e trabalhoso, pela acumulação com as tarefas docentes. Implicou grande sacrifício pessoal, de tempo para mim mas sobretudo para os que mais merecem: a minha família e amigas. A eles dedico esta tese. Só eles para me apoiarem, darem-me a força necessária para prosseguir e aguentarem todas a minhas “negas” a jantares, aniversários, escapadelas….Em particular, o Miguel, o meu “mais-que-tudo”, companheiro de todas as jornadas. Sem o seu apoio incondicional não teria conseguido! Muito obrigada!. VI.
(9) Resumo A administração de probióticos em aquacultura, tal como noutros setores da produção animal, é apontada como uma estratégia nutricional capaz de promover o estado de saúde do hospedeiro, aumentar a sua resistência perante situações causadoras de stress e doença e melhorar as taxas de crescimento e de eficiência alimentar dos animais. Embora o mercado internacional disponibilize algumas formulações probióticas específicas para a aquacultura, não existiam, à data do início deste trabalho experimental, trabalhos científicos relacionados com o assunto que pudessem comprovar os alegados benefícios da maioria dos produtos comerciais utilizados. Desta forma, este trabalho foi desenvolvido com o objetivo de aprofundar o conhecimento relacionado com a administração de probióticos comerciais a espécies de grande importância no panorama aquícola europeu e mundial, concretamente a truta arco-íris (Oncorhynchus mykiss) e a tilápia-do-Nilo (Oreochromis niloticus). Os estudos visaram sobretudo o acompanhamento e análise in vivo de parâmetros zootécnicos, imunológicos e da morfo-histologia intestinal após o fornecimento de dietas experimentais suplementadas com probióticos. No capítulo 1 é feita uma revisão bibliográfica acerca da utilização de probióticos em aquacultura e dos diversos modos de acção dos microorganimos probióticos. Nos capítulos seguintes é desenvolvida a componente prática do trabalho que, de um ponto de vista experimental, foi desenvolvida em 3 etapas. Numa primeira fase começamos por estudar um probiótico composto por Bacillus subtilis e Bacillus cereus, em truta arco-íris e, em paralelo, em truta marisca (Salmo trutta), uma espécie de truta nativa. No capítulo 2 descrevem-se e discutem-se os resultados dessa suplementação. Não tendo sido observados efeitos benéficos em nenhum dos parâmetros avaliados e em nenhuma das doses testadas (0,3 g.kg-1 e 0,6 g.kg1. ), numa segunda fase, estudaram-se dois novos produtos comerciais: um constituído por 4. estirpes bacterianas desconhecidas, conhecendo-se apenas o género (Bacillus sp., Pediococcus sp., Enterococcus sp., e Lactobacillus sp.) sendo que ao longo do trabalho foi designado por A ou multi-espécies e outro constituído apenas por uma só espécie, Pediococcus acidilactici, designado como B ou mono-espécie. Esses produtos foram testados em duas dosagens dentro do intervalo recomendado pelos respetivos fabricantes (A: 1,5 g.kg-1 e 3 g.kg-1; B: 0,1 g.kg-1 e 0,2 g.kg-1) numa experiência apresentada nos capítulos 3 e 4. No capítulo 3 são descritos e discutidos os resultados zootécnicos, imunológicos e histomorfológicos respeitantes a essa suplementação. Após oito semanas de administração, observou-se que a menor dosagem do. VII.
(10) probiótico A promoveu o crescimento e a conversão alimentar dos animais, enquanto a maior dosagem do B, melhorou apenas a conversão alimentar. A imunomodulação foi pouco extensa e limitada apenas às dosagens com efeitos nas taxas zootécnicas. Não foi observada qualquer influência significativa na morfo-histologia intestinal. No capítulo 4 descreve-se o efeito da administração dos probióticos na microbiota intestinal, tendo sido comprovado o aumento da diversidade microbiana no intestino dos animais alimentados com as dieta contendo probióticos, em particular nos indivíduos que receberam a dose mais baixa do probiótico A. Essa observação veio reforçar aquelas do capítulo 3, indicando que a menor dose testada do probiótico A (1,5 g.kg-1) originava superiores benefícios no hospedeiro. Numa última experiência, propusemo-nos avaliar os eventuais efeitos benéficos do probiótico A, por se ter revelado mais promissor, numa outra espécie, a Tilápia-do-Nilo. No capítulo 5 apresentam-se a experiência e os resultados obtidos e faz-se a sua discussão. Após 8 semanas de suplementação, o probiótico A, incorporado em 3 g.kg-1 e 6 g.kg-1 de dieta, originou uma melhoria no crescimento das tilápias (na dosagem mais baixa) e aumentou a resposta imunitária inespecífica (via alternativa do sistema complemento) na dosagem mais elevada. A morfologia intestinal foi melhorada por ambas dosagens do probiótico, dado que o grupo controlo apresentou villi mais curtas e células caliciformes em menor número, responsáveis pela produção de muco, que constituem um importante mecanismo de proteção do epitélio intestinal. No capítulo 6 tecem-se as conclusões e considerações finais. O capítulo 7 reúne a bibliografia referenciada ao longo do trabalho. Os resultados obtidos neste trabalho permitem-nos afirmar que, sob as condições experimentais testadas, as formulações microbianas comerciais A e B apresentam efeito probiótico se administradas durante 8 semanas, em particular a formulação A, actuando como promotor de crescimento nas doses de 1,5 g.kg-1 em truta arco-íris e de 3 g.kg-1 em Tilápia do Nilo. Numa nota final sugere-se a realização de ensaios do tipo desafio “challenge” com agentes patogénicos e/ou causadores de stress para confirmar a hipotética melhoria do estado de saúde dos animais.. Palavras-chave: Probiótico; Aquacultura; Truta Arco-íris; Tilápia-do-Nilo; Crescimento; Morfologia intestinal. VIII.
(11) Abstract The probiotic administration in aquaculture, similarly to terrestrial livestock production, is seen as a nutritional strategy to promote the health of the host, increase his resistance towards stressful and disease conditions and improve growth and feed efficiency rates. At the beginning of this experimental work, some specific probiotic formulations for aquaculture were available in the international market, nevertheless the scientific information to validate their putative probiotic action was very scarce. In this context, this work was conducted to provide additional information about the supplementation of diets with commercial probiotics, optimizing their administration to important European and world aquaculture species as rainbow trout (Oncorhynchus mykiss) and Nile tilapia (Oreochromis niloticus). The studies were based on in vivo evaluations of zootechnical parameters, selected immune responses and intestinal morphohistology after probiotic administration through experimental diets. Chapter 1 reviews the probiotic methods of action and their utilization on aquaculture. Subsequently the practical work developed is presented. The experimental work was run in the 3 steps. In a first phase we began to study to a probiotic composed by Bacillus subtilis and Bacillus cereus in rainbow trout and comparatively in brown trout (Salmo trutta), a native trout species. In chapter 2 we describe and discuss the results of this supplementation. Since no beneficial effects were observed, in any of the evaluated parameters, at either the dosages tested (0.3 g.kg-1 and 0.6 g.kg-1), in a second stage, we investigated two new commercial products. One of the putative probiotics, was named A, or multi-species and consisted of 4 bacterial genera (Bacillus sp., Pediococcus sp., Enterococcus sp., Lactobacillus sp.); the other, was designed by B or mono-species and consisted in Pediococcus acidilactici. These products were tested at two dosages within the range recommended by the respective manufacturers (A: 1.5 g.kg-1 and 3 g.kg-1; B: 0.1 g.kg-1 and 0.2 g.kg-1) in an experiment presented in chapters 3 and 4. Chapter 3 describes and discuss the zootechnical, immunological and histological results of this supplementation. After eight weeks of administration, the lower dose of the probiotic A promoted growth and feed conversion, while the higher dose of B improved feed conversion. The immunomodulation was not extensive and limited to the dosages that influenced zootechnical performance. It was not observed any significant influence on intestine morphology. Chapter 4 describes the effect of probiotic administration in the intestinal microbiota. Overall, the specimens that received the probiotic diets had increased microbial diversity, but that effect was particularly noticed in the individuals that received the lowest dose. IX.
(12) of the probiotic A. This observation reinforce the chapter 3 ones, indicating that the lowest dosage tested of the A probiotic (1.5 g.kg-1) leads to higher benefits in the host. In a last experiment, the probiotic A, that revealed previous superior benefits, was evaluated in another fish species, the Nile tilapia, at 3 g.kg-1and 6g.kg-1 of diet. Chapter 5 presents the experience, the results and their discussion. After 8 weeks of supplementation, the lower dosage of probiotic promoted the growth of tilapia while the highest amount increased the alternative pathway of the complement system, an unspecific immune response. Intestinal morphology was improved by both probiotic dosages, since the control group revealed shorter villi and less goblet cells responsible for producing mucus, an important protection mechanism of the intestinal epithelium. Chapter 6 presents the final conclusions and remarks. Chapter 7 lists the bibliography referred along the thesis. The results of this study suggests that, under the currents experimental conditions, the commercial microbial formulations A and B have a probiotic effect if administered for 8 weeks, in particular A formulation, acting as a growth promoter in doses of 1.5 g.kg-1 for rainbow trout and 3 g.kg-1 in Nile Tilapia. As a final note we suggest the realization of challenge tests with pathogens and/or other stress agents to confirm the hypothetical improvement of the health status of the animals.. Keywords: Probiotic; Aquaculture; Rainbow trout; Nile Tilapia; Growth performance; Intestinal morphology. X.
(13) Contents. Contents ................................................................................................................................... XI List of Tables .......................................................................................................................... XV List of Figures ..................................................................................................................... XVII List of abbreviations and acronyms ..................................................................................... XIX 1. General introduction .......................................................................................................... 1 1.1. Introduction to the study ...................................................................................................... 3. 1.2. Thesis objectives .................................................................................................................... 6. 1.3. Brief introduction to selected fish species culture .............................................................. 8. 1.4. Use of probiotics in aquaculture ........................................................................................ 13. 1.4.1 Definition and concept evolution .................................................................................................... 13 1.4.2 Mechanisms of action...................................................................................................................... 15 1.4.2.1 Competitive exclusion ............................................................................................................. 16 1.4.2.2 Competition for nutrients ....................................................................................................... 17 1.4.2.3 Production of inhibitory compounds ...................................................................................... 17 1.4.2.4 Host protection against pathogen toxins ................................................................................ 18 1.4.2.5 Production of nutrients ........................................................................................................... 19 1.4.2.6 Production and stimulation of digestive enzymes ................................................................... 20 1.4.2.7 Production of metabolites with antioxidant action ................................................................. 21 1.4.2.8 Influence on intestine structure integrity, morphology, functionality ..................................... 24 1.4.2.9 Imunnomodulatory action ...................................................................................................... 26 1.4.3 Possible results of probiotic administration .................................................................................... 29 1.4.3.1 Improvement of zootechnical performances ........................................................................... 29 1.4.3.2 Carcass composition influence ............................................................................................... 31 1.4.3.3 Reduction of malformation incidence ..................................................................................... 36 1.4.3.4 Increased resistance towards disease or stress agents ........................................................... 36 1.4.3.5 Reproduction influence........................................................................................................... 36 1.4.4 Influencing factors .......................................................................................................................... 41 1.4.5 Criteria for selection of probiotics and regulatory considerations ................................................... 43. 2 Commercial Bacillus probiotic supplementation of rainbow trout (Oncorhynchus mykiss) and brown trout (Salmo trutta): growth, immune responses and intestinal morphology .............................................................................................................................. 45 2.1. Abstract ................................................................................................................................ 47. 2.2. Introduction ......................................................................................................................... 47. 2.3. Material and Methods ......................................................................................................... 49. 2.3.1 2.3.2 2.3.3 2.3.4 2.3.5. Experimental design and sampling.................................................................................................. 49 Innate immune parameters .............................................................................................................. 50 Diets and body composition analysis .............................................................................................. 50 Growth performance ....................................................................................................................... 51 Histological analysis ....................................................................................................................... 51. XI.
(14) 2.3.6. 2.4. Statistical analysis ........................................................................................................................... 52. Results and Discussion ........................................................................................................ 52. 2.4.1 2.4.2 2.4.3. Growth performance and whole body composition ........................................................................ 52 Innate immune parameters .............................................................................................................. 53 Intestinal morphology ..................................................................................................................... 55. 3 Growth, immune responses and intestinal morphology of rainbow trout (Oncorhynchus mykiss) supplemented with commercial probiotics ................................................................ 61 3.1. Abstract ................................................................................................................................ 63. 3.2. Introduction ......................................................................................................................... 63. 3.3. Material and Methods ......................................................................................................... 65. 3.3.1 3.3.2 3.3.3 3.3.4 3.3.5 3.3.6 3.3.7 3.3.8 3.3.9 3.3.10 3.3.11 3.3.12 3.3.13. 3.4 3.4.1 3.4.2. Experimental diets preparation ........................................................................................................ 65 Animals and experimental conditions ............................................................................................. 66 Experimental proceeding and sampling .......................................................................................... 66 Probiotic detection in diets .............................................................................................................. 67 Diets and carcass chemical analysis ................................................................................................ 67 Calculations ..................................................................................................................................... 67 Innate immune parameters .............................................................................................................. 68 Plasma alternative haemolytic complement pathway (ACH50), lysozyme and peroxidase activities 68 Respiratory burst activity and nitric oxide production of head-kidney (HK) leucocytes ................ 69 Isolation and culture of HK leucocytes ....................................................................................... 69 Respiratory burst activity and nitric oxide production ................................................................ 69 Histological analysis ................................................................................................................... 69 Statistical analysis ....................................................................................................................... 70. Results .................................................................................................................................. 70 Growth performance and whole body composition ........................................................................ 70 Innate immune parameters .............................................................................................................. 72. 3.5. Intestinal morphology ......................................................................................................... 73. 3.6. Discussion ............................................................................................................................. 74. 4 Dietary probiotic supplementation modulated gut microbiota and improved growth of juvenile rainbow trout (Oncorhynchus mykiss) ..................................................................... 77 4.1. Abstract ................................................................................................................................ 79. 4.2. Introduction ......................................................................................................................... 79. 4.3. Material and Methods ......................................................................................................... 81. 4.3.1 4.3.2 4.3.3 4.3.4 4.3.5 4.3.6 4.3.7. 4.4 4.4.1 4.4.2. XII. Fish and husbandry conditions ........................................................................................................ 81 Diet preparation and feeding trial .................................................................................................... 81 Experimental design, sampling and growth performance ............................................................... 81 DNA extraction from trout intestines .............................................................................................. 82 Amplification of bacterial 16S rDNA V3 regions ........................................................................... 82 Denaturing gradient gel electrophoresis (DGGE) and cluster analysis ........................................... 83 Statistical analysis ........................................................................................................................... 83. Results and Discussion ........................................................................................................ 84 Growth performance ....................................................................................................................... 84 DGGE analysis of intestinal microbiota .......................................................................................... 87.
(15) 5 Dietary probiotic supplementation improves growth and the intestinal morphology of Nile tilapia (Oreochromis niloticus) ....................................................................................... 91 5.1. Abstract ................................................................................................................................ 93. 5.2. Introduction ......................................................................................................................... 93. 5.3. Material and Methods ......................................................................................................... 95. 5.3.1 Experimental diets ........................................................................................................................... 95 5.3.2 Animals and experimental conditions ............................................................................................. 96 5.3.3 Sampling procedures ....................................................................................................................... 96 5.3.4 Probiotic detection in diets .............................................................................................................. 97 5.3.5 Chemical analysis of diets, faeces and body composition ............................................................... 97 5.3.6 Growth performance and somatic indices ....................................................................................... 98 5.3.7 Health and innate immune parameters ............................................................................................ 99 5.3.7.1 Haematological parameters ................................................................................................... 99 5.3.7.2 Plasma alternative complement pathway (ACH50), lysozyme and peroxidase activities....... 99 5.3.7.3 Respiratory burst activity and nitric oxide (NO) production of head-kidney (HK) leucocytes99 5.3.8 Liver oxidative stress parameters .................................................................................................. 100 5.3.9 Intestine histological examination ................................................................................................. 101 5.3.10 Digestive enzymes .................................................................................................................... 101 5.3.11 Statistical analysis ..................................................................................................................... 102. 5.4 5.4.1 5.4.2 5.4.3 5.4.4 5.4.5. 5.5. 6. 7. Results ................................................................................................................................ 103 Growth performance and carcass composition .............................................................................. 103 Haematological and innate immune status .................................................................................... 104 Oxidative stress indicators ............................................................................................................ 105 Intestinal histomorphology ............................................................................................................ 106 Apparent digestibility coefficients (ADC) and digestive enzymes ............................................... 107. Discussion ........................................................................................................................... 108. General discussion, conclusions and future perspectives ............................................ 113 6.1. General discussion ............................................................................................................. 115. 6.2. Conclusions ........................................................................................................................ 124. 6.3. Future perspectives ........................................................................................................... 126. References ...................................................................................................................... 129. XIII.
(16)
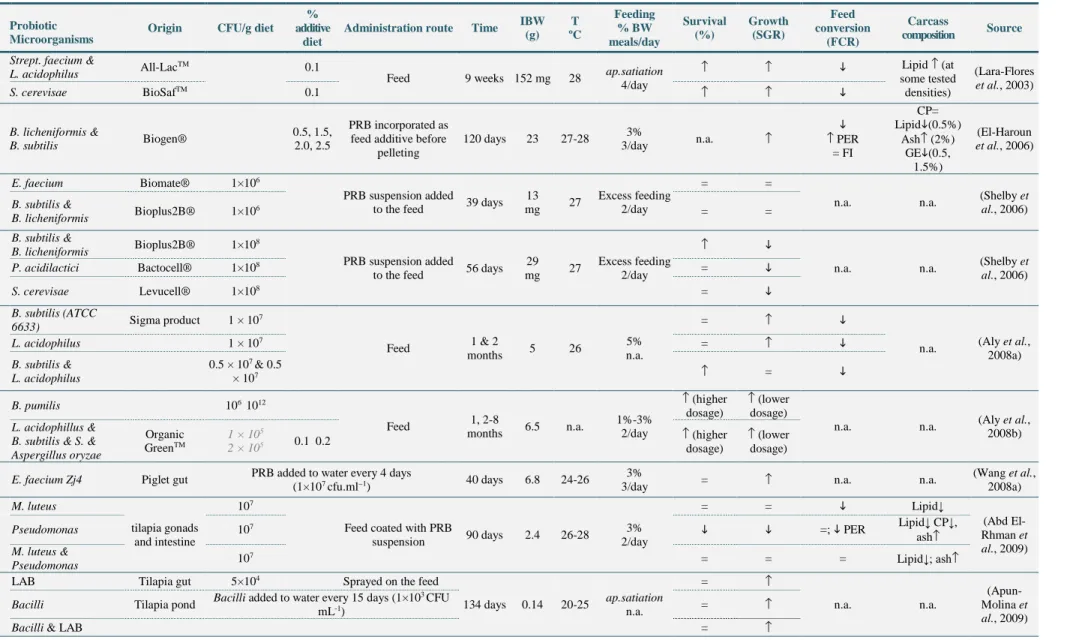
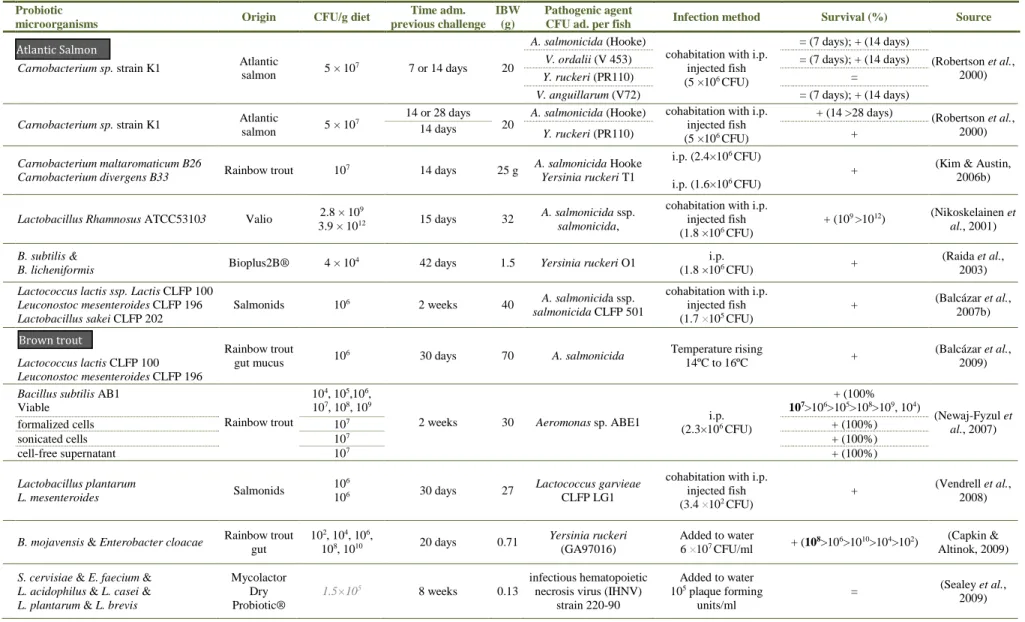
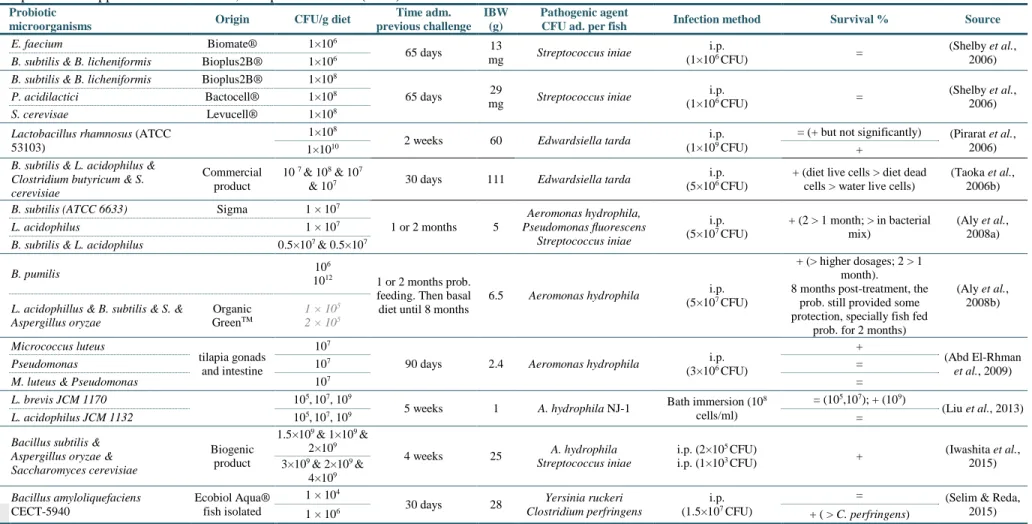
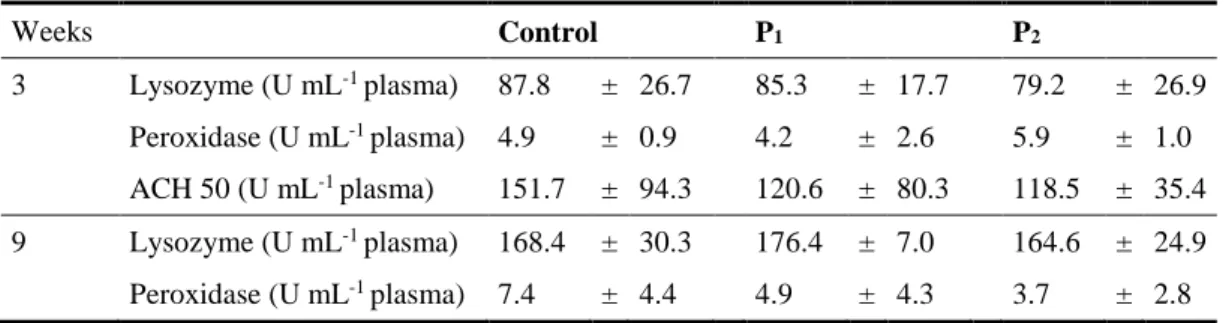
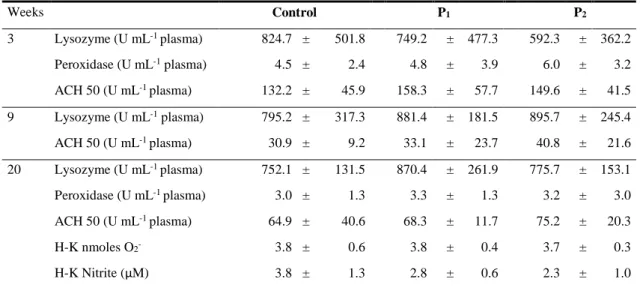
(17) List of Tables Table 1-1 Taxonomic classification and designation of the model fish species..................................................... 8 Table 1-2 Nutrient requirements of freshwater fish species (dry-matter basis). .................................................. 10 Table 1-3 Mineral and vitamins requirements (dry-matter basis). ....................................................................... 11 Table 1-4 Feeding rates and frequencies for growing tilapia at 28ºC. ................................................................. 12 Table 1-5 Recommended amount of feed per day to rainbow trout raised at different temperatures. ................. 12 Table 1-6 Summary of zootechnical results of previous probiotic supplementation trials in rainbow trout. ....... 32 Table 1-7 Summary of zootechnical results of previous supplementation trials in Nile tilapia. .......................... 34 Table 1-8 Summary of challenge trials after probiotic supplementation in rainbow trout. .................................. 38 Table 1-9 Summary of challenge trials after probiotic supplementation in Nile tilapia. ...................................... 40 Table 2-1 Ingredients and proximate composition of the experimental diets ...................................................... 50 Table 2-2 Growth performance and nutrient utilization of brown trout and rainbow trout after 7 weeks of feeding probiotic-supplemented diets. .................................................................................................................. 53 Table 2-3 Immune parameters of brown trout after 3 and 9 weeks of feeding on experimental diets. ................ 54 Table 2-4 Immune parameters of rainbow trout after 3, 9 and 20 weeks of feeding on experimental diets......... 55 Table 3-1 Probiotics composition, inclusion level and proximate composition of the experimental diets .......... 65 Table 3-2 Growth performance of rainbow trout fed the experimental diets for 8 weeks.................................... 71 Table 3-3 Body composition (%), hepatossomatic and viscerosomatic indexes (%) and condition factor (K) of rainbow trout fed the experimental diets for 8 weeks ........................................................................................... 71 Table 3-4 Nutrient and energy intake and retention of rainbow trout fed the experimental diets for 8 weeks. ... 72 Table 3-5 Innate immune parameters analysed over the experience. ................................................................... 73 Table 3-6 Intestinal histological parameters after 8 weeks of feeding the experimental diets ............................. 73 Table 4-1 Composition of the commercial probiotics, the dietary inclusion level in tested diets and CFU counts per gram of diet. .................................................................................................................................................... 84 Table 5-1 Feed ingredients and proximate composition of the experimental diet................................................ 95 Table 5-2 Probiotic counting of experimental diets (CFU.g-1) ............................................................................. 97 Table 5-3 Growth performance of Nile tilapia fed the experimental diets for 8 weeks ..................................... 103 Table 5-4 Organosomatic indices and carcass proximate composition after 8 weeks of probiotic administration ............................................................................................................................................................................ 104 Table 5-5 Haematological parameters of Nile tilapia after 8 weeks of probiotic administration ....................... 104 Table 5-6 Intestinal histological parameters after 8 weeks of feeding the experimental diets, by gut part (Iproximal, I-medial, III-distal) ............................................................................................................................. 107. XV.
(18)
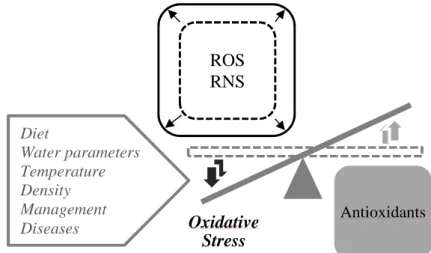
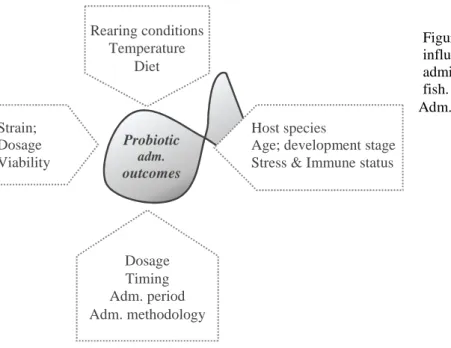
(19) List of Figures Figure 1-1 Probiotics major mechanisms of action. ............................................................................................. 15 Figure 1-2 Microbiota balance positive (eubiosis) or negative to host (dysbiosis). ............................................. 16 Figure 1-3 Simple representation of competitive exclusion by probiotics. .......................................................... 16 Figure 1-4 Unbalance between reactive species and antioxidant defences leads to a state of oxidative stress. ... 22 Figure 1-5 Routes of production of main reactive species and antioxidant enzymes........................................... 22 Figure 1-6 Factors that may influence the outcome of probiotic administration to aquaculture reared fish. ....... 41 Figure 2-1 Intestinal morphology parameters of brown and rainbow trout after 9 weeks of feeding trial. .......... 56 Figure 2-2 Representative images of proximal intestine section from brown trout fed control diet (A) and P1 diet (B, C & D) for 9 weeks. C and D are magnifications of image B. ........................................................................ 57 Figure 4-1 Weight gain of juvenile rainbow trout (IBW= 16.4 ± 0.5 g) fed for 56 days with diets containing probiotics............................................................................................................................................................... 85 Figure 4-2 Specific growth rate (SGR) of juvenile rainbow trout fed for 56 days with diets containing probiotics. .............................................................................................................................................................................. 85 Figure 4-3 Cluster analysis and 16S rDNA PCR-DGGE profiles of hindgut in juvenile rainbow trout fed for 96 days with diets containing probiotics. ................................................................................................................... 88 Figure 4-4 Number of OTUs (R) of the intestinal bacterial community in juvenile rainbow trout fed for 96 days with diets containing probiotics. ........................................................................................................................... 88 Figure 4-5 Shannon index H´ of the intestinal bacterial community in juvenile rainbow trout fed for 96 days with diets containing probiotics. ........................................................................................................................... 90 Figure 5-1 Lysozyme, alternative complement (ACH50) and peroxidase activities in plasma and respiratory burst and nitric oxide production by head-kidney (HK) leucocytes measured in Nile tilapia ............................. 105 Figure 5-2 Liver oxidative stress indicators of Nile tilapia along the growth trial. ............................................ 106 Figure 5-3 Top: Digestive enzymes specific activity after 5 months/20 weeks of probiotic supplementation. . 108. XVII.
(20)
(21) List of abbreviations and acronyms 16S rDNA ABW ACH50 ADC Adm. AFN ANCOVA ANOVA AOAC ap. BEAA BHT BS EN BSA BW CAT CECAV CFU CIIMAR COM CP CTAB DDGS DGGE DGI DGV DM DNA DTNB EATiP EC EC EFSA ESAC EU FAO FBS FBW FCR FDA FI G/C GALT GE GI GIALT GIT GnRH GPx GR GRAS GSH GSSG GST H´ HE HIS. 16S ribosomal DNA (prokaryotic DNA gene that codes for 16S ribosomal subunit) Average body weight Alternative haemolytic complement pathway Apparent digestibility coefficients Administration Autoridade Florestal Nacional (National Conservation Center) Analysis of co-variance Analysis of variance Association of Official Agricultural Chemists Apparent Bile Aesculin Azide Agar Butylated hydroxytoluene British Standard European Norm Bovine serum albumin Body weight Catalases Centro de Ciência Animal e Veterinária (Animal and Veterinary research Centre) Colony forming unit Centro Interdisciplinar de Investigação Marinha e Ambiental Commission of the European Communities Crude protein Cetyltrimethylammonium bromide; hexadecyltrimethylammonium bromide Dried Distillers Grains with Solubles Denaturing gradient gel electrophoresis Daily growth index Direcção-Geral de Veterinária (Portuguese Veterinary Authority) Dry matter Deoxyribonucleic acid 5,5′-dithiobis-(2-nitrobenzoic acid) European aquaculture technology and innovation platform European Commission Enzyme Commission (number) European Food Safety Authority Escola Superior Agrária de Coimbra European Union Food and Agriculture Organization Fetal bovine serum Final body weight Feed conversion ratio Food and Drug Administration Feed intake Guanine-cytosine Gut-associated lymphoid tissue Gross energy Gastrointestinal Gill-associated lymphoid tissue Gastro-intestinal tract Gonadotropin releasing hormone Glutathione peroxidases Glutathione reductases Generally Recognized as Safe Glutathione Glutathione disulphide Glutathione S-transferases Shannon diversity index Haematoxylin and eosin Hepatosomatic index. XIX.
(22) HK i.m. i.p. IBW ICBAS Ig IGF IL ISAPP ISI ISO IU K LAB LP LPO LPS MALT MAMPs MRS MUC MYP n.a. NADPH NALT NOD NRC OD OIE OS OTUs PAMPs PAS PBS PCR PCV PER PRB PRRs QPS R RaRBC RLP RNA RNaseA RNS ROS SALT Sb Sc SCFA SD SGR SOD SSI ssp. T TAE TBARS. XX. Head-kidney Intramuscular Intraperitoneal Initial body weight Instituto de Ciências Biomedicas Abel Salazar Immunoglobulin Insulin-like growth factor Interleukin International Scientific Association for Probiotics and Prebiotics Intestine somatic index International Organization for Standardization International unit Condition factor Lactic acid bacteria Lamina propria Lipid peroxidation Lipopolysaccharides Mucosa-associated lymphoid tissues Microbe-associated molecular patterns, Man, Rogosa, Sharpe Mucin Mannitol egg yolk polymyxin Not available Reduced nicotinamide adenine dinucleotide phosphate Nasopharynx-associated lymphoid tissue Nucleotide oligomerization domain Nation Research Council Optical densities Office International des Epizooties (World Organization for Animal Health) Oxidative stress Operational taxonomic units Pathogen-associated molecular patterns Periodic acid-Schiff reagent Phosphate buffered saline Polymerase chain reaction Packed cell volume Protein efficiency ratio Probiotic Pathogen pattern recognition receptors Qualified Presumption of Safety Richness (of OTUs) Rabbit red blood cells Relative level of protection Ribonucleic acid Ribonuclease A Reactive nitrogen species Reactive oxygen species Skin-associated lymphoid tissue Submucosa Stractum compactum Short-chain fatty acids Standard deviation Specific growth rate Superoxide dismutases Spleen somatic index Subspecies Temperature Tris-acetate-EDTA (Ethylenediamine tetraacetic acid) Thiobarbituric acid reactive substances.
(23) TG TGFβ TLR TNFα TSA U UP UPGMA USA UTAD VFI VSI WHO. Total glutathione Transforming growth factor beta Toll-like receptors Tumour necrosis factor alpha Tryptone Soy Agar Units Universidade do Porto Unweight Pair Group Method with Arithmetic Mean United States of America Universidade de Trás-os-Montes e Alto-Douro Voluntary feed intake Viscerosomatic index World Health Organization. Bacteria genera abbreviations A. B. E. Ed. L. Lacto. M. P. S. Strept. V. Y.. Aeromonas Bacillus Enterococcus Edwardsiella Lactobacillus Lactococcus Micrococcus Pediococcus Saccharomyces Streptococcus Vibrio Yersinia. XXI.
(24) XXII.
(25) 1. General introduction.
(26)
(27) General Introduction. 1.1. INTRODUCTION TO THE STUDY The latest available data about the state of the world fisheries and aquaculture sectors. annually provided by FAO, states that we have never consumed so much fish, or this sectors have impacted so much in the wellbeing of population, as these days (FAO, 2014). The same source highlights the role played by the sectors Fisheries and Aquaculture in the health promotion and on the mitigation of poverty and malnourishment. The worldwide fish consumption per capita increased from 9.9 kg in 1960, to 19.2 kg in 2012 (FAO, 2014). According to the latest statistics, aquaculture continues to expand more rapidly than any other food production sector (FAO, 2015). Fish capture is stagnant since 1980s (FAO, 2009), whereas aquaculture contribution to the total consumed fish has increased from 6% in 1970, to 50% in 2013, with an estimate contribution of 62% by 2030 (FAO, 2014). However, the overall analysis of the global aquaculture growth rate in recent years indicates a slowdown in the growth worldwide, apart from specific accelerations for certain species and regions. It seems certain that this trend will continue in the near future. But it is also true that aquaculture will continue to grow in response to increasing demand of fish for human consumption. It is expected that the increase of population, higher incomes, urban lifestyle and dietary diversification, will increase the demand and shift the food consumption habits towards higher consumption of animal protein in developing countries. However, in industrialized countries, and particularly in Europe, given the (slow) reduction of the population, it is expected that the demand for food will increase only moderately and that issues as food safety, nutritional quality of products, environmental concerns and the animal welfare will become increasingly more important to consumers (FAO, 2009). In fact, in the recent years, the collective consciousness on the agricultural practices and their environmental consequences, along with food safety issues, has increased. In 2009, the Commission of the European Communities (COM 162, 2009), promoting the development of a sustainable European aquaculture, communicated that “Environmental sustainability is a necessity and consumers want to be assured that aquaculture products are produced and transported taking account of high standard environmental requirements. Applying high standards will eventually also improve the image of the aquaculture industry and facilitate its access to the markets. The Community shall ensure that the EU aquaculture industry develops in a way which is compatible with a high level of protection of the natural environment. On the same lines, aquatic food products that are manufactured in or imported to the EU shall comply with. 3.
(28) Chapter 1. high protection standards of consumer health and safety. The Community should also pursue its objectives for a high level of protection of health and welfare in farmed aquatic animals.” More recently, the European Commission, recognizing the contribution of aquaculture for the food basket, economy and employment and facing the stagnation of its aquaculture production in the last decade, reinforced the need to develop and diverse the aquaculture sector, while maintaining high safety and environmental standards (COM 229, 2013; Lane et al., 2014). Worldwide, the intensification of the animal production in the recent decades allowed the increase of the production while decreased the costs. Such positive aspects were associated, however, with the pollution of natural resources and the spread of antibiotic resistance due to the indiscriminate use of antibiotics. The selective breeding of high productive animals and their farming at high densities contributed to the observed efficiency. However, also contributed to less robust animals with increasing susceptibility to diseases. Antibiotics were used extensively to treat and/or prevent bacterial disease outbreaks. In recent years, the presence of antibiotic residues in food, faeces and water and the antibiotic resistant bacteria, forced to rethink the use of antibiotics in animal production and to their prudent utilization. The prophylactic use of antibiotic agents was banned in EU countries since 1 January 2006 (Regulation (EC) 1831/2003) and the rules are strict concerning the use of therapeutic agents for food safety safeguard (Council Directive 96/23/EC; Council Directive 2006/88/EC). Within fish farms and surroundings, a high bacterial resistance to antibiotics has been observed, mainly in the effluent samples, and in periods not corretaled with antibiotic therapy, indicating fish as reservoirs of antibiotic resistance bacteria (Alcaide et al., 2005; Miranda & Zemelman, 2002). The evidences concerning the transference of resistant bacteria and antibiotic resistance factors from aquatic to terrestrial environments are increasing (Cabello, 2006; Rhodes et al., 2000), including pathogenic bacteria for animals and man (Rhodes et al., 2000). According to Cabello (2006), current data suggests that the indiscriminate use of antibiotics in aquaculture, has the potential to affect the Human and animal health on a global scale. The frequent use of antibiotics is, therefore, a practice to avoid. However, if infectious diseases cause significant economic impact in all livestock sectors, in aquaculture the problem is even more severe. The water supports an important pathogen density and their effortless dispersion (Verschuere et al., 2000). Intensive aquaculture fish experience situations of confinement, handling, transport and high densities, which are known stress factors (Arends. 4.
(29) General Introduction. et al., 1999; Barton & Iwama, 1991; Wuertz et al., 2006). The surrounding aquatic environment (e.g. temperature, salinity, dissolved oxygen, pH, pollutants) can cause environmental stress per se (Peters et al., 1991; Reiser et al., 2010; Reiser et al., 2011). Stress increases fish susceptibility to infectious disease (Barton & Iwama, 1991; Crumlish et al., 2003) since it affects immune responses (Costas et al., 2011; Mock & Peters, 1990; Peters et al., 1991), integrity (Olsen et al., 2002) and intestinal functions (Olsen et al., 2005). Those animals become more susceptible to opportunistic microbial infections (Sweetman et al., 2010; Verschuere et al., 2000), that may cause reduction of performance, quality of fish food and increase mortality rates. Thus, the application of prophylactic strategies is of best interest to producers in order to increase fish resistance to diseases. More than a decade ago, the recommendations of FAO concerning the areas to research and developed for disease control in aquaculture included i) good nutrition to promote health, ii) affordable and effective vaccines, iii) immunostimulants and nonspecific immune enhancers, iv) probiotics (Subasinghe, 1997). The vaccination against some specific pathogens has contributed to reduce the use of antibiotics, mainly in salmon culture (Markestad & Grave, 1997). Nevertheless, vaccines are restricted to finfish and to a limit number of diseases and aquatic species (Subasinghe, 2009). At 2012, the European aquaculture technology and innovation platform (EATiP) considered the necessity to increase the use of alternative remedies and methods of biological control, such as probiotics (EATiP, 2012). The use of probiotics, “Live microorganisms that, when administered in adequate amounts, confer a health benefit on the host (FAO/WHO, 2001; Hill et al., 2014)” has been identified as an interesting solution to reduce the use of antimicrobials in all sectors of animal production and to promote livestock health. Aquaculture is one of the production sectors where the research on prophylactic practices has grown rapidly. Several review articles on the use of probiotics in aquaculture have been published recently (Akhter et al., 2015; Balcázar et al., 2006a; Bidhan et al., 2014; Hai, 2015; Kesarcodi-Watson et al., 2008; Merrifield et al., 2010c; Merrifield & Ringø, 2014; Nayak, 2010; Newaj-Fyzul et al., 2014; Wang et al., 2008b) revealing the interest, dynamism and potential of this field. The evidences of probiotics application for immune and microbiota modulation, disease control and zootechnical benefits are accumulating.. 5.
(30) Chapter 1. 1.2. THESIS OBJECTIVES At the beginning of the current study, the international market provide some. formulations of microbial additives with alleged probiotic action for aquaculture. The products were not very specific regarding fish hosts, dosage levels or the supplementation period. In the EU only one probiotic was authorized for aquaculture - Pediococcus acidilactici MA 18/5M - for salmonids and shrimps, increasing respectively, the number of animals with proper conformation (prevention of Vertebral Compression Syndrome) and improving survival rate, growth and resistance against infections caused by Vibrio sp. (Regulation (EC) 911/2009). Later on, this additive, marketed under the name Bactocell®, would obtain EU authorization to be use in all fish species (Regulation (EU) 95/2013). Although we assumed that manufacturers have tried and tested their microbial additives, the scientific information on the outcomes of these products was limited or unavailable. Most studies published in scientific journals testing commercial probiotics in fish farming referred to products developed for terrestrial animals such as Bioplus2B® (Bacillus subtilis + B. licheniformis), Biomate SF-20® (Enterococcus faecium), ALL-LAC® (Lactobacillus acidophilus + Streptococcus faecium), Mycolactor® (Saccharomyces cerevisiae, E. faecium, L. acidophilus, L. casei, L. plantarum, L. brevis) and Bactocell®. Even concerning this last product, the one authorized in EU aquaculture, the available scientific information was scarce. In this context, the current PhD study was designed to carry out in vivo feeding trials in rainbow trout (Oncorhynchus mykiss) and Nile tilapia (Oreochromis niloticus), testing three commercial probiotic products. The commercial probiotics were: a Bacillus mixture (PAS TR®), originally developed for terrestrial livestock species, a bacterial mixture (Aquastar®), consisting in four distinct genera, and a monospecies probiotic (Bactocell®), the only probiotic product authorized in the EU to fish species. Trout and tilapia were chosen given their importance in European and World aquaculture, respectively. The selected products were supplemented to the experimental diets at concentrations within the range recommended by the manufacturers. The general thesis objective was to contribute to the application of commercial probiotics in aquaculture, in order to promote prophylactic nutritional strategies, towards a safer and sustainable aquaculture with improved fish welfare. The specific objectives were to evaluate the effects of the type of probiotics and their dosage level on the growth performance, dietary nutrient utilization, innate immune responses and intestinal morphology in trout and tilapia. To do so, the following parameters were determined: 6.
(31) General Introduction. • Zootechnical parameters as mortality, growth rates, feed conversion, ingestion and retention of nutrients, apparent digestibility of diets; organosomatic indexes; • Carcass composition (moisture, ash, protein and lipid contents); • Immune indicators in plasma (lysozyme, alternative complement pathway and peroxidase) and head kidney respiratory burst; • Intestine morphometric influence; • Intestinal microbiota modulation, mainly by molecular means.. 7.
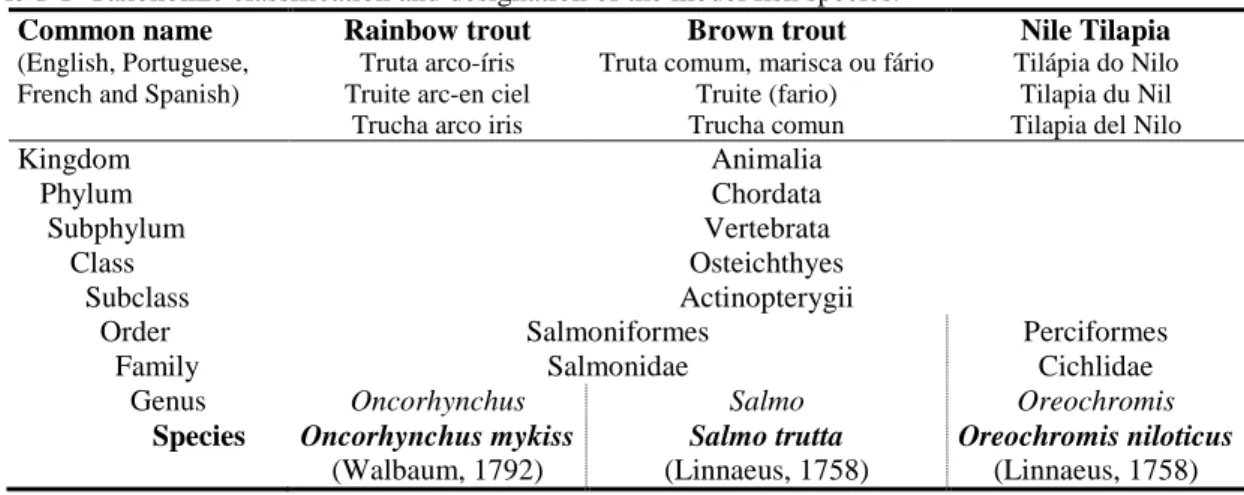
(32) Chapter 1. 1.3. BRIEF INTRODUCTION TO SELECTED FISH SPECIES CULTURE In the experimental work leading to this thesis, three fish species were used: rainbow. trout (Oncorhynchus mykiss), brown trout (Salmo trutta) and Nile tilapia (Oreochromis niloticus). Table 1-1 present their taxonomic classification and common designation in several languages.. Table 1-1 Taxonomic classification and designation of the model fish species. Common name Rainbow trout Brown trout (English, Portuguese, French and Spanish). Kingdom Phylum Subphylum Class Subclass Order Family Genus Species. Truta arco-íris Truite arc-en ciel Trucha arco iris. Truta comum, marisca ou fário Truite (fario) Trucha comun. Animalia Chordata Vertebrata Osteichthyes Actinopterygii Salmoniformes Salmonidae Oncorhynchus Salmo Oncorhynchus mykiss Salmo trutta (Walbaum, 1792) (Linnaeus, 1758) Source: (Fernandes, 1998; Gonçalves, 1998).. Nile Tilapia Tilápia do Nilo Tilapia du Nil Tilapia del Nilo. Perciformes Cichlidae Oreochromis Oreochromis niloticus (Linnaeus, 1758). These species were chosen because of their importance to Portuguese, European and world aquaculture. Rainbow trout is a salmonid native from the Pacific coast of North America; by the end of 19th century was introduced to regions of all over the world, due to the properties of fast growth rates and tolerance to wide range of temperatures (Gonçalves, 1998). Survives at near freezing temperatures to 27ºC. For spawning and growth, trout require a narrower temperature range, between 9-18°C, whereas 21ºC is considered as the upper limit (FAO, 2005-2016). Gonçalves (1998) recommend temperatures of 9-12ºC on incubation and fry stages, and 13 to 18ºC for the juvenile and grow-out stages. Rainbow trout is the main trout farmed worldwide with total global production of about 0.8 million tonnes and Portuguese production of 751 tonnes in 2014 (FAO, 2011-2016). Brown trout or European trout, is a Eurasian and North African indigenous species (MacCrimmon & Marshall, 1968) that can adapt to diverse environments with a worldwide distribution (Klemetsen et al., 2003). Brown trout is not especially important for food fish, being generally used for recreational fisheries (Merrifield et al., 2010c). The Portuguese and global production in 2014 was about 1.1 and 4388 tonnes, respectively (FAO, 2011-2016). Brown trout withstands temperatures ranging from 3ºC to 26ºC, with optimum range between 13-18ºC (Klemetsen et al., 2003).. 8.
(33) General Introduction. Both salmonids are believed to be essentially freshwater species, but they can be also reared in seawater, when properly adapted. Some wild populations of rainbow and brown trout are found permanently in freshwater environment, while other have a migratory (anadromous) behaviour (Klemetsen et al., 2003). Salmo trutta trutta is the subspecies with anadromous behaviour, also named as sea trout and Salmo trutta fario is the non-migratory subspecies. Tilapia is a common designation of species from three genera of the Cichlidae family: Oreochromis, Sarotherodon, and Tilapia. The most important aquaculture species belong to genus Oreochromis and include the Nile tilapia, O. niloticus, the Mozambique tilapia, O. mossambicus, the blue tilapia, O. aureus, and O. urolepis hornorum (Watanabe et al., 2002). Nile tilapia is the most produced (El-Sayed, 2006), with a total production exceeding 3.6 million tonnes in 2014 (FAO, 2011-2016). Tilapias are tropical fishes native to Africa and the Middle East, but are currently globally distributed (FAO, 2012; Watanabe et al., 2002). Their success lies on their resistance to diseases, adaptability to large aquatic conditions, production systems and diet formulations (El-Sayed, 2006; Fitzsimmons et al., 2011; Watanabe et al., 2002). Tilapias are freshwater species, but they can be also cope with increased salinities (ElSayed, 2006; Fernandes, 1998). They tolerate temperatures of 8 to 42ºC (Fernandes, 1998), but the optimum temperature range between 24-32ºC (El-Sayed & Kawanna, 2008). Rainbow trout sexually mature between 15-18 months old for males and after two years old for females (FAO, 2005-2016). Brown trout mature between 1-2 years old for males and 2-3 years of age old for females (FAO, 2012-2016). Tilapia sexually mature significantly earlier than trout, between 3 to 6 months old (El-Sayed, 2006). To avoid sexual maturation, inconvenient for grow-out fish, monosex populations are frequently used in commercial production; female gender in the trout species and male in tilapia (El-Sayed, 2006). Frequently female triploid trout are also used (FAO, 2012-2016; Gonçalves, 1998).. Feeding habits and nutrient requirements Rainbow and brown trout have predominantly carnivorous feeding habits while tilapia are generally omnivorous. Wild adult trout feed on aquatic and terrestrial insects, molluscs, crustaceans, fish eggs, small fishes, and freshwater shrimp (FAO, 2005-2016; Klemetsen et al., 2003). Tilapias feed on algae, aquatic plants, small invertebrates, detritus and associated bacterial films and diverse feeds of animal origin (Fitzsimmons et al., 2011; Watanabe et al.,. 9.
(34) Chapter 1. 2002). The relative position in trophic hierarchy and protein requirements is higher for salmonids and lower for tilapias (Huntington & Hasan, 2009). Tables 1-2 and 1-3 presents the nutrient requirements for rainbow trout, tilapias (Oreochromis spp.) and Atlantic salmon (NRC, 2011). No data was assembled for brown trout so data from Atlantic salmon (Salmo salar), closest species to brown trout, are presented.. Table 1-2 Nutrient requirements of freshwater fish species (dry-matter basis). Rainbow trout Atlantic salmon Tilapia a Typical energy and protein concentrations Digestible energy (kcal/kg diet) 4200 4400 3400 Digestible protein (%) 38 36 29 Amino acids (%) Arginine 1.5 1.8 1.2 Histidine 0.8 0.8 b 1 Isoleucine 1.1 1.1 1 Leucine 1.5 1.5 1.9 Lysine 2.4 2.4 1.6 Methionine 0.7 0.7 0.7 Methionine + cysteine 1.1 1.1 1 Phenylalanine 0.9 0.9 1.1 Phenylalanine + tyrosine 1.8 1.8 1.6 Threonine 1.1 1.1 1.1 Tryptophan 0.3 0.3 0.3 Valine 1.2 1.2 1.5 Taurine c NR c NR NT Fatty acids (%) 18:3 n-3 0.7-1 1 NT n-3 LC-PUFA d 0.4-0.5 0.5-1 R 18:2 n-6 1 NT 0.5-1 NT NT NT Cholesterol (%) NT (4-14) e NT (4-6) e NT Phospholipids (%) Source: NRC (2011). According to the authors the values represent near 100% bioavailability, due the determination of requirements with purified ingredients with highly digestible nutrients. R, required in diet but quantity not determined; NR, not required under practical conditions (diets containing ingredients from marine and terrestrial animal proteins and fish oil and water of at least medium hardness); and NT, not tested a – Usual digestible energy and digestible crude protein levels (digestible N x 6.25) in commercial diets. b – Young Atlantic salmon undergoing rapid growth after transfer to seawater appear to require up to 1.4% dietary histidine to prevent ocular pathology (bilateral cataracts). c – Taurine (an amino-sulfonic acid that is a derivative of cysteine) was included. One study reported taurine requirement by rainbow-trout fry fed all-vegetable diets. d – 20:5 n-3 and/or 22:6 n-3 e – Values in parentheses represent requirements reported for larval/early juvenile stages.. As mentioned by the authors, the values represent minimum requirements for maximum performance under optimal experimental conditions and with ingredients with high bioavailability. Practical diets may contain a safety margin, to compensate processing or storage losses, variation in composition or digestibility of ingredients and higher requirements due to environmental effects (NRC, 2011).. 10.
(35) General Introduction. Table 1-3 Mineral and vitamins requirements (dry-matter basis). Rainbow trout Atlantic salmon Tilapia NUTRIENT REQUIREMENTS (Oncorhynchus mykiss) (Salmo salar) Oreochromis spp. Macrominerals (%) Calcium NR NR R/0,7f Chlorine NT NT 0.15 Magnesium 0.05 0.04 0.06 Phosphorus 0.7 0.8 0.4 Potassium NT NT 0.2-0.3 Sodium NR NR 0.15 Microminerals (mg/kg) Copper 3 5 5 Iodine 1.1 R NT Iron NT 30-60 85 Manganese 12 10 7 Selenium 0.15 NT NT Zinc 15 37 20 Fat-soluble vitamins g A (mg/kg) 0.75 NT 1.8 D (µg/kg) 40 NT 9 E (mg/kg) 50 60 60 K (mg/kg) R <10 NT Water-soluble vitamins (mg/kg) Thiamin 1 NT NT Riboflavin 4 NT 6 Vitamin B6 3 5 15 Pantothenic Acid 20 NT 10 Niacin 10 NT 26 Biotin 0.15 NT 0.06 Vitamin B12 R NT NR Folacin 1 NT 1 Choline h 800 NT 1000 Myoinositol h 300 NT 400 Vitamin C i 20 20 20 Source: NRC (2011). According to the authors the values represent near 100% bioavailability, due the determination of requirements with purified ingredients with highly digestible nutrients. R, required in diet but quantity not determined; NR, not required under practical conditions (diets containing ingredients from marine and terrestrial animal proteins and fish oil and water of at least medium hardness); and NT, not tested f – Dietary requirement in the absence of waterborne calcium. g – Conversion factors: 10000 IU ≈ 3000 µg vitamin A (retinol), 1 IU=0.025 µg vitamin D (cholecalciferol). h- Diet without phospholipids. i- As L-ascorbyl-2-monophosphate or L-ascorbyl-2-polyphosfate.. According to Lovell (2002) the diets for rainbow trout in North America usually have 36% of crude protein (CP) and 4 Kcal per g, while in Europe is frequently used more dense diets with 50% crude protein (CP) and 5 to 6 Kcal per g, and higher lipid contents (20 to 30%). El-Sayed (2006) recommends 30 to 40% of CP for young tilapias and 20-30% of CP for adult fish; accordingly to the author the lipid levels for maximum growth should be between 1015% but are frequently lower (6-8%).. 11.
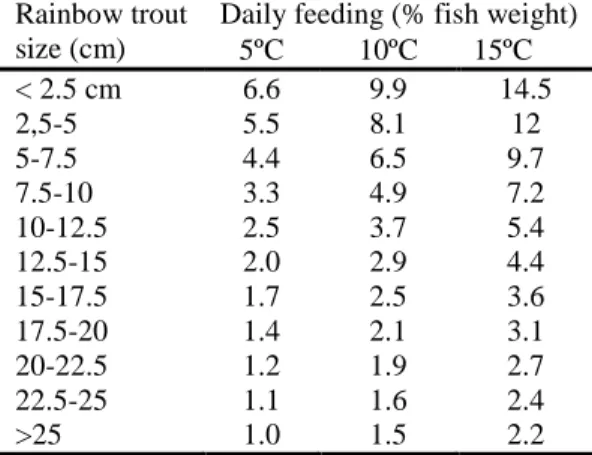
(36) Chapter 1. The feeding frequency (number of meals per day) and feeding level are inversely related to fish size. At early life stage, fish need to be fed several times a day (table 1-4) and then feeding frequency gradually decrease with increase in fish size (Lovell, 2002). Feeding level is usually expressed as a percentage of body weight (may vary from 5 to 15% and to 0.8 to 2.3 % for fry and juvenile, respectively), decreasing as the fish grows. Moreover, the feeding levels is related to the water temperature (table 1-5); quoting Tacon and Cowey (1985) “an increase in water temperature (up to an optimum level) is accompanied by an increased feed intake (Brett et al., 1969; Choubert et al. , 1982), increased growth rate and metabolic rate (Jobling, 1983b) and a faster gastro-intestinal transit time (Fauconneau et al., 1983)”.. Table 1-4 Feeding rates and frequencies for growing tilapia at 28ºC. Tilapia size (g) Daily feeding Meals (% fish weight) per day 2 days old to 1 g 30-10 8 1-5g 10-6 6 5-20g 6-4 4 20-100g 4-3 3 or 4 >100 g 3 3 Source: Lovell (2002).. 12. Table 1-5 Recommended amount of feed per day to rainbow trout raised at different temperatures. Rainbow trout Daily feeding (% fish weight) size (cm) 5ºC 10ºC 15ºC < 2.5 cm 6.6 9.9 14.5 2,5-5 5.5 8.1 12 5-7.5 4.4 6.5 9.7 7.5-10 3.3 4.9 7.2 10-12.5 2.5 3.7 5.4 12.5-15 2.0 2.9 4.4 15-17.5 1.7 2.5 3.6 17.5-20 1.4 2.1 3.1 20-22.5 1.2 1.9 2.7 22.5-25 1.1 1.6 2.4 >25 1.0 1.5 2.2 Adapted from Halver and Hardy (2002)..
(37) General Introduction. 1.4. 1.4.1. USE OF PROBIOTICS IN AQUACULTURE. Definition and concept evolution The term probiotic currently is used for beneficial microorganism for men and animals.. There is not a unique and universal definition and over time the concept has evolved. Lilly and Stillwell, in 1965, used the term to name substances produced by one microorganism that stimulate the growth of another, in opposition to antibiotic. That authors are frequently proposed as the first that used the term (FAO/WHO, 2001; Salminen et al., 1999), but not according to Lauzon et al. (2014) in a detailed historic review of the concept. Parker, in 1974, considered probiotics as the organisms and substances which contribute to the intestinal microbial balance (Lauzon et al., 2014). Latter, Fuller (1989) propose the following definition: “live microbial feed supplement which beneficially affects the host animal by improving its microbial balance”. If initially the benefits where attributed to gastrointestinal tract (Madsen et al., 2001; Marteau et al., 2002), latter the actions were realized to be extended far beyond it (LenoirWijnkoop et al., 2007). There have been reports of benefits in skin and fur, in atopic dermatitis (Erdman & Poutahidis, 2014; Michail et al., 2008), in reproduction (Erdman & Poutahidis, 2014), on urogenital (Reid, 2001) and rheumatic disorders (Sheil et al., 2004; Yeoh et al., 2013) and in the diminishing of cardiovascular disease risk (De Smet et al., 1998). More recently the implications of gut microbiota and probiotics at neurological and behaviour level have been revealed (Bourassa et al., 2016; Cryan & Dinan, 2012; Jiang et al., 2015). In this context, the term was redefined by Guarner and Schaafsma (1998, quoted in FAO/WHO, 2001) as live microorganisms which when consumed in adequate amounts confer a health benefit on the host. Based on that definition, a joint specialist panel from FAO/WHO redefined as: “live microorganisms which when administered in adequate amounts confer a health benefit on the host, changing deliberately the term consumed to administered (FAO/WHO, 2001). That is one of the most consensual definitions and probably the most referred on literature. In 2013, the International Scientific Association for Probiotics and Prebiotics (ISAPP) retain that definition (small grammatical change1) considering it “inclusive. 1. “Live microorganisms that, when administered in adequate amounts, confer a health benefit on the host”. 13.
(38) Chapter 1. of a wide range of microbes and applications, while comprising the core features of probiotics: microbial, viable and beneficial to health” (Hill et al., 2014). The aquatic environment is more favourable to microbial growth compared to air (Gomez et al., 2013; Hansen & Olafsen, 1999). The digestive tract of aquatic animals is an open system in continuous contact with the surrounding aquatic environment (Lazado & Caipang, 2014). Comparatively to the aquatic environment, the intestine is richer in nutrients, favouring microbial growth (Cahill, 1990; Wang et al., 2008b). In this way, the surrounding microorganisms can exert more influence in the health of aquatic species than in terrestrial counterparts (Balcázar et al., 2006a; Verschuere et al., 2000). Moriaty (1998) proposed that the term probiotic in aquaculture should be extended to water microbial additives. Verschuere and co-authors (2000), accordingly, proposed the following definition: “a live microbial adjunct which has a beneficial effect on the host by modifying the host-associated or ambient microbial community, by ensuring improved use of the feed or enhancing its nutritional value, by enhancing the host response towards disease, or by improving the quality of its ambient environment”. Merrifield and co-authors (2010c) extended even more the concept “any microbial cell provided via the diet or rearing water that benefits the host fish, fish farmer or fish consumer”, allowing the inclusion of viable or not viable cells in the definition. Although conceptually is more usual the characterization of probiotics as viable (live) cells, some studies indicate that dead (not viable) microorganisms have probiotics effects, so giving scientific justification for expanding the concept (Caselli et al., 2011; Lahtinen, 2012). In that context, Salminen and co-authors (1999) defined probiotics as “microbial cell preparations or components of microbial cells that have a beneficial effect on the health and well-being of the host”. In fact, cell wall components or DNA sequences of dead microorganisms exert benefits through immune stimulation, toxin sequester or connection to mucosal epithelia. Rachmilewitz et al., (2004) observed similar results, using live or inactivated cells, concluding that microbial DNA was the responsible for the Tool-like receptors stimulation. Diaz-Rosales and co-authors (2006) observed enhanced immune responses after heat-inactivated probiotic administration to gilthead sea bream. Abbass et al, (2010) reported higher survival of rainbow trout infected with Yersiniosis, after intraperitoneal or intramuscular injection of several subcellular components of the probiotics Aeromonas sobria GC2 and Bacillus subtilis JB-1. These studies are valuable contributors for the understanding of probiotic modes of action, and open interesting possibilities for the industry of immunestimulant additives (Adams, 2010). Nevertheless, it remains more suitable. 14.
Imagem
+7
Documentos relacionados
Esta hipotética iniciativa, para além da proximidade e coabitação entre o sistema educativo e outras entidades afins e, dos benefícios e apoios complementares (financeiros,
The data revealed that the informal caregivers presented higher levels of emotional distress, feelings of sadness and daily working hours (19.8 hours) compared to the
o Guia não explica com clareza a classificação de certos alimentos em determinados grupos, a exemplo do leite; nesse caso, tanto o pasteuri- zado, como o ultrapasteurizado
During the development of the second edition of the Dietary Guidelines, this classification was improved; then were presented four groups: in natura or minimally processed
O objetivo desse artigo é apontar o funcionamento de alguns métodos de análise a sistemas críticos e propor um guia denominado G2S , mostran- do quais passos se fazem necessários
Prevalência de violência sexual entre escolares do 9º ano do ensino fundamental e OR bruto, segundo aspectos sociodemográficos e variáveis do contexto familiar, saúde
Prevalence of sexual violence among students of the 9th year of primary school and raw OR, according to sociodemographic aspects and variables of family context, mental health,
In this context of structural and technical changes is important to think about the future, trying to understand the main trends and possible paths of work and
