STUDMAP 3.0 -
AN INTEROPERABLE WEB-BASED PLATFORM FOR
GEOSPATIAL DATA OFFERS IN ACADEMIC LIFE
i
STUDMAP 3.0 - AN INTEROPERABLE WEB-BASED
PLATFORM FOR GEOSPATIAL DATA OFFERS IN
ACADEMIC LIFE
Dissertation supervised by
Prof. Doutor Vitor Manuel Pereira Duarte dos Santos, Information
Management School, NOVA Lisbon
Dr. Torsten Prinz, Institute for Geoinformatics, WWU Münster
Dr. Andrés Muñoz, Geotech Institute, UJI, Castelló
ii
ACKNOWLEDGEMENTS
I would first like to thank all my supervisors for their continuous support and guidance. It
was a real pleasure to work with you and to learn from your critique. Thank you, Dr. Torsten
Prinz, for enabling me to think out of my old box and for giving me an insight into the
beauty of daring! Thank you, Prof. Vitor Santos, for always pushing this thesis closer to
successful research! And, thank you, Dr. Andrés Muñoz for allowing me to test all my ideas
on a working environment!
I would like to thank all my colleagues from the Geospatial Technologies Masters for your
expertise always inspired me. You are truly professional, and your advice was a good
contribution to the output of my research.
A special word goes for Diamantino Correia, from the ESRI remote support team of Lisbon,
and for Sven Oliver Pagel, from the IVV department in the Institute for Geoinformatics,
WWU Münster, for analyzing all technical problems so meticulously and helping me to
bring this project to reality.
I would also like to acknowledge all experts and students involved in the validation process
of my research. Without your passionate participation and comments, the final evaluation of
the portal could not have been successfully conducted.
Finally, I must express my gratitude to my partner and my family for their support, patience
and restless encouragement.
iii
STUDMAP 3.0 - AN INTEROPERABLE WEB-BASED
PLATFORM FOR GEOSPATIAL DATA OFFERS IN
ACADEMIC LIFE
ABSTRACT
Geographic Information Systems has now entered the realm of web and yields for feasible solutions to balance the technology offers with the users’ needs to share, access and explore the massive amounts of geodata available. Challenges occur when moving forward from old 2D platforms towards innovative and integrated webGIS systems that align functionality with the necessity to grant a complete understanding of the surrounding reality. 3D space responds to this but, however, stands only at the beginning of its era and cannot yet reach the development of 2D web integration. Research is now aiming at possible webGIS solutions to adapt to the special structure imposed by 3D data. In this context, this thesis focuses on designing an architecture for 2D and 3D geospatial data integration on a student-oriented web platform. This concept was further delivered and validated through a real case scenario – Studmap 3.0, a webGIS platform to serve the students of the University of Muenster in their academical life. The portal currently grants availability of geospatial data and web services of regional interest in a smart GIS environment that allows access and comparison of official services with own data. The implementation of Studmap 3.0 aided in the continuous improvement of the proposed architecture model and developed under a design science research cycle that reached its end once the final approval of its users was attained via a usability evaluation. Final strengths and drawbacks of the proposed architecture were ultimately identified together with an expert usability evaluation and a lab-based usability test of the resulting portal interface suitability for academic use. The results fall under the acceptable range with an 83.75 score for the System Usability Scale standardized questions when addressed to experts and a score of 83.87 when addressed to students. For the open-ended questions, the interface received an overall positive critique. A summary of future participants’ opinion on the benefits, drawbacks and proposed improvements was also delivered. Peers interested in similar concepts can use both this model and its final remarks as a reference for their work.
KEYWORDS
iv
ACRONYMS
2D – Two Dimensional3D – Three Dimensional
API – Application Program Interface db – Database
DBMS – Database Management System DEM – Digital Elevation Models ds – Data Store
DSM – Digital Surface Models
EPSG – European Petroleum Survey Group ESRI – Environmental Systems Research Institute GIS – Geographic Information System
GPS – Global Positioning System HTTP – Hypertext Transfer Protocol
HTTPS – Hypertext Transfer Protocol Secure ISO – International Standards Organization I3S – Indexed 3D Scene Layers
JSON – JavaScript Object Notation LAS – Log-ASCII-Standard
LiDAR – Light Detection and Ranging NRW – North Rhine-Westphalia OGC – Open Geospatial Consortium REST – Representational State Transfer
RDBMS – Relational Database Management System SQL – Standardized Query Language
v
SDK – Software Development Kit SLPK – Scene Layer Package SUS – System Usability Scale UAS – Unmanned Aerial Systems UAV – Unmanned Aerial Vehicle URL – Uniform Resource Locators WAB – Web Appbuilder
WCS – Web Coverage Service WFS – Web Feature Service WMS – Web Map Service WMTS – Web Map Tiling Service
WWU – University of Münster (Westfälische Wilhelms-Universität) XML – Extensible Markup Language
vi
INDEX OF TEXT
ACKNOWLEDGEMENTS ... ii
ACRONYMS ... iv
TABLE OF CONTENTS ... vi
INDEX OF FIGURES ... viii
INDEX OF TABLES ... ix
1. INTRODUCTION ... 1
BACKGROUND ... 1
MOTIVATION ... 1
AIMS AND OBJECTIVES ... 2
2. THEORETICAL BACKGROUND ... 3
GEOSPATIAL CONTEXT AND WEBGIS... 3
BIG 3D DATA AND GEOSPATIAL SCIENCES ... 4
2.2.1 3D geospatial data ... 4
2.2.2 3D geospatial data management ... 5
GISSERVERS ... 6
2.3.1 Defining concepts ... 6
2.3.2 Classification... 6
WEB MAPPING APIS ... 8
GEOSPATIAL WEB SERVICES ... 9
WEBGISAPPLICATIONS ... 10
WEBGIS SERVER ARCHITECTURE ... 11
3. METHODOLOGY ... 14
DESIGN-SCIENCE RESEARCH ... 14
STRATEGY IMPLEMENTATION ... 15
4. PROPOSAL ... 17
ASSUMPTIONS ... 17
4.1.1 Software decision ... 17
4.1.2 Third party services ... 17
4.1.3 Architecture decision... 18
ARCHITECTURE ... 18
CASE STUDY AND APPLICATIONS ... 20
4.3.1 Studmap 3.0 ... 21
vii
4.3.3 Data of interest ... 22
4.3.4 Architecture Implementation ... 26
4.3.5 User roles and privileges ... 36
5. DISCUSSION ... 39 DATA... 39 SYSTEM FUNCTIONALITY ... 40 SYSTEM USABILITY ... 43 5.3.1 Expert evaluation ... 43 5.3.2 User testing ... 44 EASE OF IMPLEMENTATION ... 47 FUTURE DEVELOPMENTS ... 48 6. CONCLUSION ... 50 BIBLIOGRAPHIC REFERENCES ... 52 APPENDIX ... 60
viii
INDEX OF FIGURES
Figure 1 ArcGIS Server site architecture adapted from (ESRI, 2018b)... 12
Figure 2 ArcGIS Enterprise multi-machine model adapted from (ESRI, 2018f) ... 13
Figure 3 Design research process adapted from (Kanellis & Papadopoulos, 2009) ... 14
Figure 4. Design-science research framework implementation ... 15
Figure 5 Conceptual architecture for the integration of geodata on a web-GIS platform – general diagram ... 19
Figure 6. Area of interest. ... 22
Figure 7 LAS File properties and statistics ... 25
Figure 8 General diagram of the architecture implementation for Studmap 3.0 ... 26
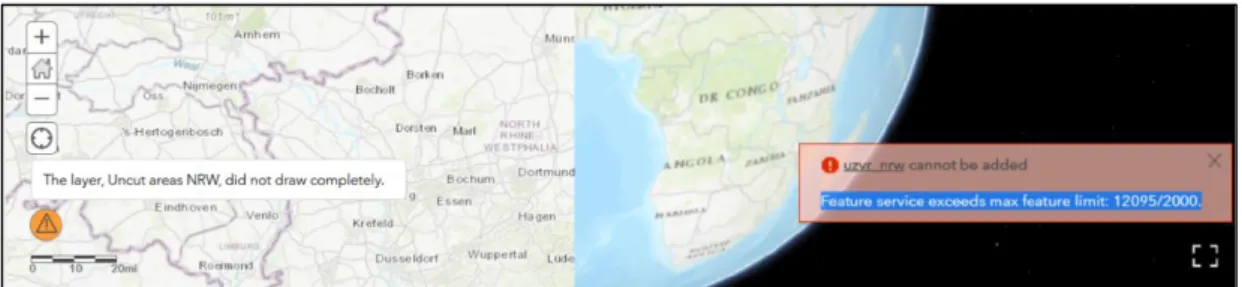
Figure 9 Feature service error when exceeding feature limit on a web map (left) or web scene (right) ... 28
Figure 10 Studmap 3.0 Portal interface - Find data section ... 30
Figure 11 Studmap 3.0 Portal interface - Applications section ... 30
Figure 12 Studmap 3.0 Portal interface – Data categories section ... 31
Figure 13 Studmap 3.0 Portal interface - Results by tag filter ... 31
Figure 14 Accessing the geospatial services from IVVGEO Server using ArcGIS Pro ... 32
Figure 15 Creating the studmap_prod enterprise geodatabase ... 34
Figure 16 Create a connection to the production database using ArcGIS Pro (left) and PostgreSQL (right) ... 34
Figure 17 The ArcGIS Data Store configuration wizard - installed databases ... 35
Figure 18 Creation of the studmap_creator user role using the Create Database User tool ... 37
Figure 19 Boxplot to measure the effectiveness of the user study ... 46
Figure 20 Boxplot to measure the efficiency of the user study ... 46
ix
INDEX OF TABLES
Table 1 Updated table of selected GIS web mapping APIs (Liu, Li, Huang, & Gong, 2015) (sites last
accessed on November 5, 2018) ... 8
Table 2 Data of interest ... 24
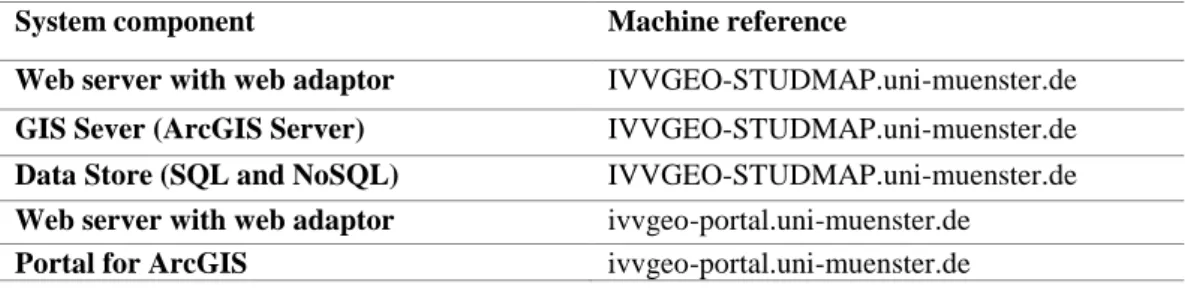
Table 3 Components’ distribution ... 27
Table 4 Web layers types and distribution ... 28
Table 5 Widgets configured for each web application of the Studmap 3.0 portal ... 29
Table 6 Listed GIS web services on the IVVGEO Server ... 33
Table 7 Functionality table for the enterprise database access ... 36
Table 8 Functionality of Studmap 1.4 and Studmap 3.0 ... 41
Table 9 Description of each expert chosen for the usability evaluation ... 44
Table 10 Responses to the open-ended questions of the expert questionnaire ... 44
1
1. INTRODUCTION
This chapter raises the awareness of a problem in the Geospatial Technologies realm, namely the need for a client-server architecture for an interoperable webGIS platform for the integration of geospatial data to serve students for educational purposes. The problem’s background and the research motivation are first introduced, followed by the aim and the main objectives of this thesis.
B
ACKGROUNDThe information age we are living in stretches the limits of Geographic Information Science. We are now facing an increasing demand for integrated solutions to handle geospatial data due to an increasing number of users, a heavy load of geodata generated daily and a limited number of resources to cope with them. In academia, such serious problems are now making the call for innovative ways for students to effectively share and handle data, address it to a particular problem and refer to it when needed. In this way, conventional Geographic Information Systems (GIS) are being pushed towards the web and yield more sophisticated approaches to integrate data into new web dedicated systems.
Moreover, these new directions in GIS are moving from conventional 2D to innovative 3D data integration on the web as aligned with the offers of the latest technologies and the positive impact of 3D space on how the user understands the surrounding space. However, this process is still facing the problem of discrepancy between the development of the two data types as a 3D data structure imposes a greater complexity that still lays behind the current web availability of 2D data.
M
OTIVATIONTo synchronize with the current tendencies in GIS and geodata offers across the web, students crosscutting with this realm now require a smart, 3D-friendly web environment to respond to their practical needs: to allow the access of public and official data and to upload and share own data with the others. In this scenario, the motivation of this thesis steps in the lack of scientific solutions to balance both 2D and 3D functionality in an integrated webGIS system dedicated to academical use.
The proposed approach in this paper offers a new architecture for complex 2D and 3D data and web services integration to a common web platform to grant GIS functionality for academical use. The platform is intended to ultimately allow students to download, exploit and upload datasets of regional interest in a webGIS environment. This approach has further been evaluated and validated by a case study platform, Studmap 3.0 based on a design science research process. Studmap 3.0 is hence intended to replace the currently unfunctional and outdated geoportal, Studmap 1.4 with a new application of the concept of a smart architecture. The implemented architecture will serve as a good reference tool for all peers interested in similar problems regarding complex 3D data integration and web-based services importation on a GIS Server.
2
• The need to find the optimal client-server architecture based on a design science researchprocess to implement an integrated GIS web platform;
• The need to validate the architecture through a real implementation of a new GIS platform according to the theoretical model that would replace its outdated version;
• The need to find the strengths and limitations of the architecture and to provide a useful resource for peers interested in similar issues.
As Gaghegan (2018) was stating, “we should not expect a third party to take responsibility for validating
and delivering our ideas into a GISystem that is focused on research”. Researchers in the GIS field is
delivering innovative ideas to promote progress usually in written forms such as journal publications. However, these ideas tend to remain only written and not applied to real-world practices. The present research, therefore, responds to this call as it ultimately resulted in a practical approach. The new architecture has been implemented and validated and resulted in a platform designed to support students in real life altogether with a framework that can always be adapted according to specific needs and improved upon feedback.
A
IMS AND OBJECTIVESThis research aims to contribute for a better understanding of the complexity of the geodatabase integration of data coming from different sources and new web services of regional interest to serve the students’ current needs. To attain this, we propose, implement and validate a viable client-server architecture for the complex 2D and 3D data and web services integration to a GIS Server. The aim will be achievable throughout a series of technical and personal objectives. In terms of technical objectives: 1. Proposing a conceptual client-server architecture for a webGIS platform that offers a smart data concept and functionality aligned to the current needs of the students to have it ready for evaluation;
2. Implementation and evaluation of the proposed architecture through a case study to prove the new conceptional setup and to generate conclusions for future optimization, to generate the thesis’ final assumptions;
As for the personal objectives:
3. Writing on the master thesis and presentation, to have it finished for the thesis defense; 4. Completing five courses on ESRI’s online learning platform, to develop the skills for the
3
2. THEORETICAL BACKGROUND
The focus of this chapter is the research and description of the existing GIS integration solutions offered by researchers up to the present.
G
EOSPATIAL CONTEXT ANDW
EBGIS
As the name implies, geospatial data are information specific to the position on the globe where the data were collected, distinguished by two main types: raster and vector, depending on their structure. A discrete regular grid of cells representative for each spatial location is specific for raster data, while vector consists of mathematical functions materialized by geometric shapes (Shekhar, Xiong, & Zhou, 2018).
New tendencies of GIS integration with Internet technologies enable geospatial data to move towards a new accessibility and interoperability culmination. The accessibility aims to grant the public access of geospatial data through the so-called webGIS, offering interactive and real-time integration and transmission of both data and GIS tools to a worldwide audience (Agrawal & Gupta, 2017). On the other hand, interoperability refers to the geospatial data resource synthesis to offer a better organization and understanding of geographic information (Cannata, Antonovic, Molinari, & Pozzoni, 2015).
WebGIS, which is sometimes referred to as web mapping, represents the integration of GIS on the web to allow the efficiently sharing of the geospatial data among its users around the world. With the rise of technological development nowadays, we situate ourselves in the transition between Web 1.0 and Web 3.0. WebGIS is continuously adapting to this growth of the web, altogether with its subsequent architecture to comply with the current needs and technologies. Agrawal & Gupta (2017) offer an insight into how webGIS has evolved from simple web mapping websites to the current complex webGIS architectures, giving a comparison between different types of architectures. They conclude that any webGIS structure is primary depending on the user’s necessities.
Veenendaal, Brovelli, Li, & Ivánová (2017) make a distinction between the two concepts, web mapping, and webGIS, providing an overview of the terms and terminology around them. They argue that mapping and GIS have started to migrate towards the online environment altogether, suffering a huge impact from the fast developments of the web, which in turn has caused confusion between the two. We now take advantage of these developments which give us an easy interaction with the maps that allow a stronger collaboration with GIS. Developing web services allow these communications and give access to geospatial data in the online environment as components with an application programming interface.
However, such developments come with different drawbacks. There are a series of limitations that can impact GIS nowadays regarding the computational shortcomings and community. Gaghegan (2018) gives a listing of the issues of GIS science and suggestions on how to overcome them.
4
Altogether with the expansion of webGIS, recent research has started to emphasize the importance of its functionality and to offer different frameworks to review and assess it. New directions now focus on the data, users and functionality of the system (Veenendaal, Brovelli, & Li, 2017). Hence, the front-end mapping functionalities, and the back-end database management system should work together to offer the end user the amount of information and flexibility addressed by its purpose. Kong, Zhang, & Stonebraker (2015) propose that the functionality of a webGIS system can be assessed using eight common GIS functions: basemap availability, legend customization, map elements, map products, information query, location search, reporting, and spatial analysis.To ultimately evaluate the users’ appreciation of a webGIS platform, standard meeting criteria for usability (International Organization for Standardization, 2018) should emerge to a design an evaluation methodology dedicated to its domain-specific context. An evaluation addressed real users of the platform where they are given specific tasks is encouraged by the literature (Kong, Zhang, & Stonebraker, 2015) and should result in qualitative feedback for the further improvements of the webGIS design.
B
IG3D
DATA AND GEOSPATIAL SCIENCESBig data refers to the abundance of digital data collected throughout different sources: Earth Sciences, Internet of Things, Social sciences, Astronomy, Business or Industry (Yang, Huang, Li, Liu, & Hu, 2017). Nowadays, we confront with a “flood of digital data”, directly or indirectly involving information about space. Altogether with the processing advancements and data availability, big data forces geospatial sciences to turn to a new perspective. This comes with both advantages and challenges as it yields for great changes in the way the data are understood, stored, handled and delivered (Yang, Huang, Li, Liu, & Hu, 2017).
Shekhar, Xiong, & Zhou (2018) estimate an increase in the number of digital earth sensors in the following 5 years which is approximated to 50 billion. Not only does this boom impact the volumes of geocoded data, but it also brings a new challenge to the table: managing the temporal dimension. This forces the processing capabilities to turn to new data distribution methods to adapt to the computing capacity of a single or a set of machines. Horizontal scaling is preferred to vertical systems in terms of rapidly computing large amounts of data. However, their performance is still disputed, and the focus turns to find` the distributed computing solutions to handle both the quality of the big data processing and the security of the data in terms of control and privacy (Shekhar, Xiong, & Zhou, 2018).
2.2.1 3D geospatial data
Tendencies in the geospatial realm nowadays focus around the capturing and applications of one specific type of big data: 3D data. 3D data gives GIS a real-world image of the surroundings in terms of visualization. This data normally derives either from aerial captures with the help of LiDAR (Light Detection and Ranging) or UAS (Unmanned Aerial Systems) techniques, or from terrestrial LiDAR capturing systems, represented by TLS (Terrestrial Laser Scanning). These approaches are used to grant
5
people a better understanding of the main characteristics of the environment. However, due to the size of the dataset and the resources required by it, the geodatabases are facing a real management issue (Shekhar, Xiong, & Zhou, 2018).LiDAR is one of the most common sources of qualitative 3D products such as classified point clouds, digital elevation and surface models (DEMs and DSMs). Li, Hodgson, & Li (2018) bring a review of the recent literature regarding LiDAR and point cloud processing. Similarly, Walsh, Page, McKnight, Yao, & Morrissey (2015) offer an insight into the applications of LiDAR generated geodata, altogether with a review of the most recent applications in the research area. These researches now address the integration of terrain analysis with software engineering in order to offer an appropriate solution for a web-based GIS.
2.2.2 3D geospatial data management
3D world benefits of massive amounts of 3D geodata available which come into different forms: 3D textured or untextured city models, surface or terrain models derived from triangular irregular networks (TINs) or 3D point clouds which usually consist of billions of points. WebGIS developers seek for solutions to distribute these large volumes of data throughout integrated platforms to serve for the consumption and delivery of 3D data around the world (ESRI, 2016b).
Data model serves as a solution to better manage massive 3D geocoded data as part of a spatial database management system (DBMS). The aim is to distribute the data as records stored in the rows of an integrated system that would easily allow the query of the data and hence, a better analysis of the information (Shekhar, Xiong, & Zhou, 2018).
Even if big data distributed in a database offers an easy manipulation of the data on the web, this structure imposes a series of challenges (Shekhar, Xiong, & Zhou, 2018). Storing space and disk size is one of the main. For instance, LiDAR produces billions of points into massive volumes beyond the storing limit and computing capacity of a single machine as its purpose is to bring a higher geometric detail to data.
What is more, the delivery of 3D final products depends on a series of workflows varying from pre-processing of the point cloud to the final delivery of a digital elevation model. Not only does such a workflow demand high computing efficiency in the offline environment, but it also challenges the real-time processing on the web. All these processes require special storage and computing capacities and hence, a more complex approach when retrieved from a database and processed in the online environment. Li, Hodgson, & Li (2018) and van Oosterom, et al. (2015) propose different solutions for the LiDAR data integration process in a geodatabase.
When using a data model, each record of the geodatabase is being managed individually. Working with large volumes of data influences the performance of each query and hence, can result in long-lasting retrievals of data. As a solution, Shekhar, Xiong, & Zhou (2018) discuss using a spatial indexing
6
technique in order to avoid the examination of every row and record. However, 3D data imposes a special data structure and relationships between entities, which, in turn, challenges the spatial indexing system whose solution is still under research.In their research, van Oosterom, et al. (2015) discuss the capabilities and limitations of diverse infrastructure solutions available for the manipulation of massive 3D point clouds within a Database Management System (DBMS). Their research reveals that the best implementation strategy depends on the file size, hardware and software solutions available and the required functionality.
On the other hand, solutions for converting complex 3D data formats into easily manageable structures are being researched. The concept to compress the entire content of a dataset allows working with great volumes of data while being able to access each individual resource. Indexed 3D Scene layers (I3S) and, respectively, Scene Layer Packages (.SLPK) have been adopted as an OGC community standard for storing and managing 3D geographic data such as 3D objects, integrated meshes and point features (OGC, 2017). This solution focuses on converting the original dataset into a node-based hierarchical spatial index structure to allow the packaging for local storage, in the case of .SLPK package and consumption as a web service, in the case of the I3S layers (ESRI, 2017b). Hence, no DBMS approach is required, nor currently available in this case.
GIS
S
ERVERS2.3.1 Defining concepts
GIS data is handled on the web through different applications or programs depending on web browsers, web servers, and map servers to perform certain tasks over the internet. The web browser is the client as it is the one to make a request translated into an URL, while the web server gives the response to that request through the HTTP protocol. The geospatial component is handled by the map or GIS server which provides the core GIS functionality of the application and supports the derived web maps (Agrawal & Gupta, 2017). The link between the web server and map server is done by the application server (Shekhar, Xiong, & Zhou, 2018).
2.3.2 Classification
GIS servers are handled with the help of different software options available. In terms of acquisition costs, they can be either open or closed. Idrizi (2014) offers an analysis of the comparison between the two types of software for GIS practices.
A. Open source software servers
Open source movement in GIScience gathers a valuable community of dedicated peers that contribute with solutions to so-called “fee of costs” platforms. The efforts have gained value among the research area as Gaghegan (2018) argues that GIS platforms can develop in a healthy way if people contribute
7
freely. However, open source software comes with a series of drawbacks and are free only to a certain extent, even though the price cannot compare with the commercial options on the market (Idrizi, 2014). Agrawal & Gupta (2017) offer a review of the open source software options and their impact. Among the open source software options, the ones that are gaining popularity nowadays are GeoServer (2019) and MapServer (MapServer, 2018). An example of an entirely open source geoportal is istSOS (Cannata, Antonovic, Molinari, & Pozzoni, 2015), which combines free software solutions into a web map mashup to serve for flood protection.B. Closed source software servers
Commercial software is intended to be user-friendly, requiring little development knowledge and training, while offering good infrastructure support for the client. Usually, closed source software options can be adapted to the users’ specific needs and require fewer maintenance efforts (Idrizi, 2014). What is more, Gaghegan (2018) argues that commercial software is bringing the GIS community one step closer to contributing to a common platform for research in the realm, as producers are nowadays giving the users the opportunity to develop or improve missing functions of the available systems. However, all these benefits come in the exchange of a considerable price and such compromises as adapting to the producer’s specifications and constraints (Idrizi, 2014).
A recent review of the options of software available on the market is given by Idrizi (2014). They also offer a comparison between the open source and commercial software options for GIS servers, providing a list of examples of implemented GIS platforms for each case. Among the most popular options of commercial GIS software stands ArcGIS, produced by ESRI. ArcGIS is a GIS dedicated software platform composed of four elements: a geographic information model, storage and management component, disseminating geoinformation, GIS applications, and related web services. The platform allows personalization and development of the built-in features or the creation of new applications or components (Shekhar, Xiong, & Zhou, 2018). ArcGIS Server is a web mapping and geoprocessing software of this platform, which enables the availability of spatial information through the communication between a server computer and other devices established by different web services. This communication is standardized by two protocols: HTTP and HTTPS. The server consists of two servers, a map and a web one, which is connected via APIs (ESRI, 2018b).
An example of an ArcGIS driven webGIS platform is given by Walsh, Page, McKnight, Yao, & Morrissey (2015) which have implemented a solution to offer the availability of the LiDAR driven digital terrain model of North Carolina. Chen, He, Zhang, & Nover (2016) have also used the option of ArcGIS Server to combine the 2D and 3D data on the same webGIS platform to ease the management of landslide hazards. More popular examples consist of the National Atlas of the United States (USGS, 2018), the Canadian GeoData Infrastructure (Canada, 2017) and the National Geographic Website (Society, 2017).
8
W
EBM
APPINGAPI
SApplication Program Interfaces or APIs are software interfaces that specify how pieces of software interact with each other. They can be either consumed or provided as services and they come in two main categories: server-side APIs and client-side APIs. For the communication with the HTTP web server, the web APIs usually use JSON or XML standard formats. For communication with the web browser, the APIs use standard JavaScript formats (Liu, Li, Huang, & Gong, 2015).
Web mapping APIs are dedicated to mapping as they are used to establish the communication and integration of web map services through classes of maps and layers. Currently, there are over 20405 web APIs, which include 1112 web mapping APIs, according to ProgrammableWeb (2018). Among the most popular, stands Google Maps, which holds the 8th position among all types of APIs. In their study, Liu, Li, Huang, & Gong (2015) give a review of the popular GIS mapping API choices. Slight changes have been made since which are reflected in the updated version of the selected GIS web mapping APIs in Table 1:
Provider URL Authentication
Google Maps https://cloud.google.com/maps-platform/ No ESRI ArcGIS https://developers.arcgis.com/ No Microsoft Bing
Maps
https://www.microsoft.com/en-us/maps/choose-your-bing-maps-api Yes
Here Maps https://developer.here.com/ Yes MapQuest https://business.mapquest.com/products/ No OpenLayers http://openlayers.org/ No Yandex https://tech.yandex.com/maps/ Yes OS OpenSpace
https://www.ordnancesurvey.co.uk/business-and-government/products/os-openspace/api/ Yes
GeoServer https://docs.geoserver.org/latest/en/user/rest/api/index.html No GeoTools http://docs.geotools.org/stable/userguide/library/api/ No Table 1 Updated table of selected GIS web mapping APIs (Liu, Li, Huang, & Gong, 2015) (sites last
accessed on November 5, 2018)
All these web APIs are dedicated to allowing developers to create or customize built-in location-based applications for modern platforms. ESRI’s ArcGIS web APIs are offered for a wide variety of programming languages, including JavaScript, Flex, Silverlight/WPF, .NET and Java (Liu, Li, Huang, & Gong, 2015). The ArcGIS API for JavaScript is now enabling users to integrate 2D and 3D functionality in their webGIS based applications and deploy them on the web browser (ESRI, 2018j). The 3D functionality on the web was given with the release of the 4.0 version of the API through the Indexed 3D scene layers (I3S) capable to support large volumes of 3D geospatial data (ESRI, 2016b). For non-developers, the ArcGIS API for JavaScript is integrated with the Web AppBuilder (WAB) software development kit (SDK), which requires minimal coding and allows easy creation of GIS web applications. This SDK comes with two versions, one for 2D applications and one for 3D, which are based on the two versions of the API, 3.x and 4.x (ESRI, 2018j).
9
The representational state transfer or REST API that uses HTTP requests in a common architecture for web services development (Rouse, 2016). ArcGIS Online and Server use this type of API for the management of web services, system properties and user roles (ESRI, 2017d).G
EOSPATIAL WEB SERVICESWhile APIs represent the interface between two applications, the web services grant the communication between two machines. Web services are software or pieces of software that facilitate the availability of data the Internet through a standardized Extensible Markup Language (XML) which encodes the messages between the users and the services. Web services can be compatible with the characteristics of geospatial data and can hence, allow the access and server-side processing of such data via the Internet. In this way, geospatial technologies can take advantage of the capabilities of web services to offer accessibility of large volumes of multi-dimensional geodata to clients varying from human to application end-users focused on geospatial services (Veenendaal, Brovelli, Li, & Ivánová, 2017). Web geospatial services enable the distribution and real-time processing of big geospatial data to reduce time, costs, duplicated data and required computing capacity. In this context, geospatial data analysts can now take a step forward from the traditional GIS workflows to efficiently explore geospatial information directly on the web without such dependencies as storage space and computing capabilities (Wagemann, Clements, Figuera, Rossi, & Mantovani, 2018).
A. OGC-specific web services
New directions in the realm are now focused on finding the best techniques to combine data access and analysis throughout web-based services. In this context, the integration of multi-source web services is a great challenge which comes with a series of disadvantages (Chen, He, Zhang, & Nover, 2016) (ESRI, 2018i). Agrawal & Gupta (2017) refer to the need to effectively implement these services as the need for a “revolution”. The Open Geospatial Consortium (OGC) responds to this urgency by being dedicated to initiating the standardization of the geospatial data sharing and interoperability (OGC, 2016b). According to GeoSeer (2018), at 2018-07-18 there were 1224379 OGC layers available. Their standard classifies the web services in web map services (WMS), web map tiling services (WMTS), web feature services (WFS) and web coverage service (WCS).
OGC describes the web map service (WMS) as a standard to share maps as georeferenced digital images in different formats (Agrawal & Gupta, 2017). OCS’s definition of WMSs (OGC, 2016a) covers the standards of requesting and retrieving online maps from existing geodatabases to allow the dynamic consuming of multiple maps or layers coming from multiple sources and allowing different styling schemes. The service uses the GetCapabilities and GetMap API calls at a basic level. ESRI (2014c) specifies that WMSs don’t expose actual data while allowing attribute requests throughout other operations.
10
According to the OGC standards, a web map tiling service (WMTS) is a complement for the WMS as it again represents an image covering a map extent for different scales. The difference is that the image is composed of multiple predefined tiles that ease the load of computation needed for large images (OGC, 2010b). An example of WMTS is the basemaps provided by ESRI are tiled map services (ESRI, 2018a).Web feature services (WFS) allows the access of data by its feature and not via an image. Hence, this offers more capabilities together with a rich experience as a client can retrieve or modify features and their properties on the web directly. However, this comes with a considerable cost in terms of response time as the rendering is done at the client-side (OGC, 2010a).
A. ESRI-specific web services
ArcGIS Server is compatible with many web services, including the OGC compliant ones mentioned earlier. There are 7 services managed by the GIS Server in particular: geocode, geodata, geoprocessing, image, map, scene, and vector tile services. These services can be consumed either by using a web browser or a web mapping application or using a GIS desktop application (ESRI, 2018d).
Raster data or mosaics can be published via image services. In an Enterprise setting, these will generate either image or elevation layers depending on the settings of the source. Map services allow the publishing of maps over the Internet and it creates the map image layers. These layers are normally rendered on the server-side generating a low response size. Map services also allow enabling WMS, WMTS or WFs and hence allow the publishing of OGC specific layers (ESRI, 2018e).
Feature data is normally published as a feature service which is a feature-enabled map service. Once published, these services will generate feature layers that offer enhanced capabilities and an interactive experience compared to the map image but at a higher response size (ESRI, 2018e).
Scene services allow the publishing of complex 3D data structures or scenes. For example, scene layer packages can be consumed via these services (ESRI, Indexed 3D Scene Layers, 2015). These services can only be published as hosted layers as their content is stored in the NoSQL database of ArcGIS Data Store (ESRI, 2018e).
W
EBGIS
A
PPLICATIONSAltogether with the growth of webGIS, the diversity of web mapping APIs and standardization of geospatial web services approaches to integrate emerging technologies into web mapping applications are setting the base for a new mashup paradigm. Data coming from different sources are being waved into modern, light-weighted web applications to offer their users a more interactive mapping experience (Liu, Li, Huang, & Gong, 2015).
As users tend to integrate web programming technologies into their maps, web developers are offering more intuitive ways to build web mapping applications. Configuring applications now becomes easier
11
not only for developers but for non-programming peers as well. Among the plethora of tools, APIs and libraries, Buczkowski (2016) bring forward a classification of the most popular choices for web mapping.A good example of an easy-to-use web application building software is given by ESRI’s WAB for ArcGIS. WAB allows both developers and non-developers to create interactive mobile or desktop web mapping applications. The application can either be deployed using ArcGIS Online or Enterprise platforms or using a Developer Edition dedicated for customization (ESRI, 2014b). What is more, WAB can also integrate 3D data via the newest version of the ArcGIS API for JavaScript (ESRI, 2014a). Stepping forward into the developments of web maps and applications realm also brings important issues to the surface. As tendencies are moving around 3D data, a current concern among web mapping developers is how 3D features can reach the same level of integration as 2D web maps in order to be used together for an enhanced webGIS environment (Chen, He, Zhang, & Nover, 2016).
W
EBGIS
SERVER ARCHITECTUREGIS client-server architectures are network architectures dedicated to spatial data in which a web server works altogether with a map server to exchange geographic and non-geographic information with remote clients. Agrawal & Gupta (2017) discuss the multiple possible options for a webGIS architecture, which can vary between multi-layered, plug-and-play, service-oriented or cloud-based.
In general, an internet GIS architecture tends for a three-tiered system consisting of a presentation, an application and a database tier (Shekhar, Xiong, & Zhou, 2018). The presentation layer is the web browser that grants the exchange of information between the client and the web server. The application tier holds the logic of the entire system, ensuring the exchange of information between the client and the database. In the case of webGIS, this is done by the web and the GIS servers via the Internet. The database tier handles the storage and management of the geospatial data in order to return the requested data to the web server (Agrawal & Gupta, 2017).
In a three-tiered architecture, each component can physically reside on a different machine. This brings, therefore, both complexity and valuable gains over the traditional approaches, such as increased efficiency, security, scalability and flexibility as the workload is distributed between the different components and hence, between different computers. Such systems can access the database directly, without the need to locally store the data, providing the client with fast responses of complex features and even geospatial analysis tools residing on other systems (Shekhar, Xiong, & Zhou, 2018).
Some examples of applied three-tiered architectures are given by Chen, He, Zhang, & Nover (2016), Liu, Li, Huang, & Gong (2015) and Shekhar, Xiong, & Zhou (2018).
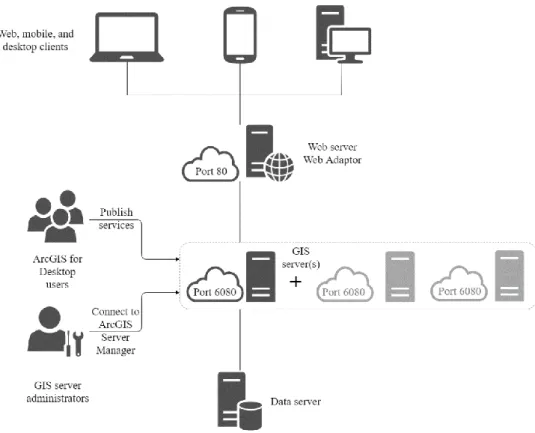
ESRI’s ArcGIS Server can also be deployed as a multi-layered system, where the web browsers that offer access to the clients and administrators form the presentation tier, the web adaptor, and web and
12
GIS servers represent the application or middleware tier and the database layer is represented by the data server (Figure 1). In this case, the web adaptor is the application which links the GIS server or servers with the web server, by forwarding the requests to the machines where the GIS servers reside (ESRI, 2018b).The data structure for GIS data management that powers web services and allows web editing on the ArcGIS Server is represented by the enterprise geodatabase. It is a relational database management system (RDBMS) with special characteristics destined for a large-scale GIS system: increased efficiency, data integrity, scalability, concurrent access, security and flexibility (ESRI, 2016a). Once registered with the GIS server, this structure allows referencing the source path of the data that is being published and turned into web services (ESRI, 2018c).
Figure 1 ArcGIS Server site architecture adapted from (ESRI, 2018b)
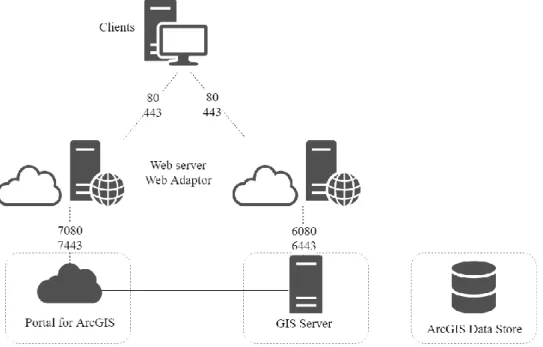
An advanced deployment is represented by the ArcGIS Enterprise multi-machine system (ESRI, 2018f) which offers a configuration of three main components that can reside on different machines: the ArcGIS Server, the Portal for ArcGIS and the ArcGIS Data Store (Figure 2) to grant the feature service data management. The system requires that all three components work together. The ArcGIS Server Site is federated and integrated with the portal. This system is configured with two data stores which deploy the hosting server: the relational and the non-relational or tile cache data store. While the relational database handles the hosted feature services managed in the portal, the non-relational manages hosted scene services. This configuration offers the highest level of integration of the system
13
components and, hence, the most capabilities availability, at the moment being the only means of publishing complex 3D features via the I3S standard layer (ESRI, 2018g).Figure 2 ArcGIS Enterprise multi-machine model adapted from (ESRI, 2018f)
In this architecture model (Figure 2) the communication between the portal and the GIS server is done via the HTTP and HTTPS protocols or can be restricted to HTTPS only. As Figure 2 displays, the portal communicates with the 7080 port for the HTTP protocol and with the 7443 port for the HTTPS (ESRI, 2018l). The GIS server, on the other hand, uses the HTTP port 6080 and the HTTPS port 6443 to communicate with the other machines via the Internet (ESRI, 2016c). The Web Adaptor manages the requests via the 80 and the 443 ports.
14
3. METHODOLOGY
The goal of the research is to integrate complex geospatial data and web-based services on an interoperable web platform by proposing and evaluating a GIS client-server architecture. In other words, the proposed approach refers to the creation of an artefact aiming to solve a problem. In this context, a design science research framework (Kanellis & Papadopoulos, 2009) is chosen from the existing research methodologies as the proposed approach intends to build knowledge through the creation of reality. This chapter focuses on describing the concept of design science research and its application to the current research.
D
ESIGN-
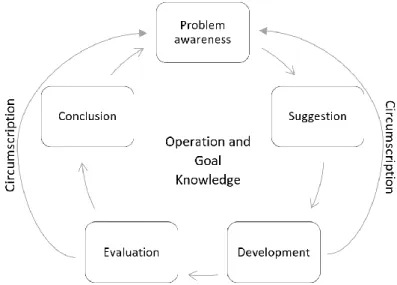
SCIENCE RESEARCHThe paradigm of Design-Science is a research instrument commonly used in Information Sciences to solve problems by creating an artefact. Design-Science Research proposes a framework adapted by the researcher’s aims to shape the artefact according to the results of a series of iterations of five processes as seen in Figure 3: the problem’s awareness, the suggestion, the development, the evaluation and the conclusion (Kanellis & Papadopoulos, 2009).
Figure 3 Design research process adapted from (Kanellis & Papadopoulos, 2009)
First, the problem (Figure 3) is shaped and addressed by the researcher. Based on empirical knowledge and accumulated experience, solutions to the problem are proposed in the suggestion phase. The suggestions are being pushed forward to the development process when an artefact is created according to the theory. The developed artefact is evaluated according to the suggestions proposed and all findings are cycled back to the problem’s awareness and suggestion, to re-develop and re-evaluate the artefact. The process terminates with the conclusion and the knowledge is built through the two flows: Circumscription and Operation and Goal Knowledge (Kanellis & Papadopoulos, 2009).
15
S
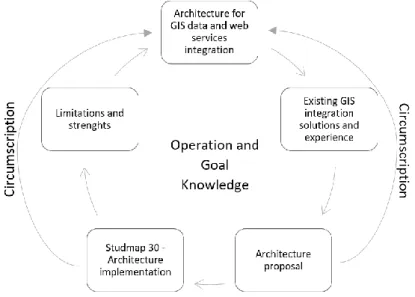
TRATEGY IMPLEMENTATIONAccording to the design science research paradigm theorized previously, the methodology of the current research adopts the five phases of the framework proposed by Kanellis & Papadopoulos (2009) and adapts them to the main objectives: proposing, implementing and evaluating of a new client-server architecture for complex GIS data integration on a common, student-specific web platform (Figure 4).
Figure 4. Design-science research framework implementation
As Figure 4 implies, each phase of the design-science research framework reflects one implementation step:
1. The awareness of the problem phase is presented at the beginning of the paper, by stating the two main objectives of the research: the proposal and implementation of a client-server architecture for complex GIS data and web services integration.
2. The suggestion phase reflects in the solutions proposed by the existing GIS integration solutions and the empirical experience gained through the operation and goal knowledge discovery.
3. The development phase is the construction of the artefact based on the theories condensed by the suggestion phase. In the current research, the artefact is represented by the proposal and design of a client-server architecture to serve for the integration of the motivated data and services in a common webGIS platform.
4. The evaluation consists of the practical implementation of the proposed architecture and validation of its functionality throughout the student dedicated platform. Studmap 3.0. A study case emerges at this point to test the theoretical concepts attained and the feasibility of the conceptual architecture proposed previously. The outcome of this phase is feed back to the
16
previous one and hence, the conceptual architecture is reshaped accordingly. The process flows back to the first phase and iterates through phases 2, 3 and 4 as experience is accumulated and new theories emerge.5. The conclusion is drawn from the evaluation of the created artefact. Once the implemented architecture is adjusted to a final form according to the knowledge gained through the partial and complete cycles. The process iterates itself according to the feedback once again and it only terminates when it reaches the approval of the end-user. As a measure for the ultimate approval, a customized usability evaluation is designed.
17
4. PROPOSAL
This chapter describes the development of an artefact, namely a client-server architecture, according to the solutions reviewed in the recent literature findings. The proposed architecture is also validated at this stage by a real case application, hence by the implementation of Studmap 3.0 web platform.
A
SSUMPTIONS4.1.1 Software decision
Among the open and closed source software options available, ArcGIS Server was chosen as it comes with powerful geoprocessing functions appropriate for the needs and challenges of this project. Enhanced functionality is given to the system once the ArcGIS Server Site is federated with the Portal for ArcGIS and is configured as a hosted server. In this way, the system allows the publication of cached maps, feature and scene layers as hosted services on the portal (ESRI, 2018k). This configuration was chosen as it provides extra functionality to the system, namely: adding of zipped shapefiles, .csv or .gpx files to the map, feature and raster analysis and adding of geocoded data from .csv files or tables. Therefore, the software choice for the portal interface component is the Portal for ArcGIS, which is connected to the GIS Server and the ArcGIS registered Data Stores through a federation configuration (ESRI, 2018g).
The PostgreSQL open source database management system (DMBS) was chosen to function together with the ArcGIS registered data stores. This software was chosen for the storage and query of the locally stored geographical data because it has extended spatial functionality compared to standard SQL DBMS and because of its ease of administration. The support of spatial objects is supported by the PostGIS extensions which enable the GIS functionality according to the needs of the proposed platform. For the web applications configuration, WAB SDK (ESRI, 2014b) was chosen as it offers an intuitive way of creating interactive mapping applications on top of the ArcGIS server without requiring enhanced programming skills. Another reason for this choice is that the JavaScript API standing at the base of this application can integrate 2D and 3D functionality.
4.1.2 Third party services
Among the variety of existent types of web-based services, the aimed services to fit the purpose of the research and the compatibility with the software choice, are OGC compliant web map services (WMS), web feature services (WFS) and web map tiling services (WMTS). All these web-based services are provided by third party servers or clouds, reducing the need to store the data locally and taking the workload off the GIS server to finally give fast responses to the users’ requests.
The communication between compliant WMS, WFS and WMTS servers and the Portal for ArcGIS is done via the HTTP or HTTPS protocols, depending on each provider.
18
The administration of the web services’ requests is done via the REST API and is handled by two web applications, the ArcGIS Server Administrator Directory or the ArcGIS Server Manager (ESRI, 2018b).4.1.3 Architecture decision
The most fitted client-server architecture for the purpose of this research is multilayered, respectively the three-tier architecture consisting of the presentation, middleware and database tiers, each working as an individual component and residing on a different machine. In this way, the workload is divided, and better overall functionality of the platform is given.
To go along with the software choice, the most feasible approach for the publishing of the complex 3D layers is via the 3D indexed scene layers (I3S). A smart approach of publishing complex 2D layers is via the feature layers. These types of layers are stored on the web portal as hosted services and they are managed by the relational and tile cache data stores configured with the federated GIS Server. This structure allows the server to host thousands of scene services and all services published directly on the portal are hosted services. However, all hosted layers are only copied layers to the portal and cannot be managed by the user in real time. To allow this functionality, a registered user-managed database can work in parallel with the ArcGIS managed. However, this only allows the management of limited types of 3D layers, while offering a good functionality of complex 2D layers or registered features.
For secure communication between the components of this architecture, all communications are restricted to HTTPS-only. Hence, the port used for the communication for the portal is 7443 and for the server 6443, each communication being handled by a Web Adaptor managing requests via the 443 port.
A
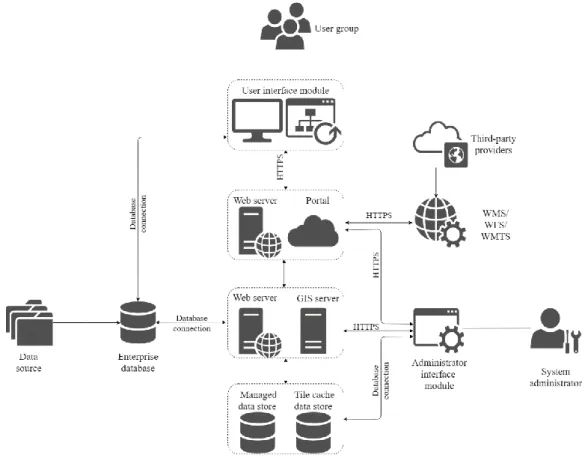
RCHITECTUREThe artefact created within the proposed methodology of the research is represented by a client-server architecture (Figure 5). The architecture is designed to respond to the need of finding the optimal system
19
to integrate and handle different datasets and web-services coming from diverse sources to satisfy the needs of the targeted user groups, namely the needs of local students.Figure 5 Conceptual architecture for the integration of geodata on a web-GIS platform – general diagram
At a basic level, the schema in Figure 5 is conceived according to the three-tiered conceptual Internet GIS architecture, consisting of the following levels:
• The presentation tier represented by the web browsers which allow the user groups and administrators to interact with the GIS server and the portal;
• The application or middleware tier represented by the web servers and the GIS server that is holding the logic of the system;
• The database tier represented by the Relational Data Store, where the data is stored and managed according to three different storage systems: the enterprise database, the ArcGIS managed data store and the ArcGIS tile cache data store.
The presentation layer is the one to receive the input from the client and display the output according to the request. The client is represented by the web browsers accessed by either administrators or targeted user groups. The GIS server administrator has access to the entire system, either by accessing the GIS Server or Portal, all accesses being done via the corresponding HTTPS uniform resource locators (URLs), or by a direct connection to the database tier. Depending on his role, each user group is given
20
different privileges by the administrator. Every member of the user group can also have different roles: publisher, user or viewer, depending on the privileges granted by the administrator of the system. A publisher can directly publish services on the portal or edit the production database and synchronize the edits with the GIS server and hence, with the portal. Other users, with more limited privileges, are only allowed to access or view the items via the web applications published on the portal.Each server presented in the architecture (Figure 5) is dedicated to a process. Each web server serves for hosting a web application. The GIS server is in charge of the GIS functionality of the system, handling the geospatial data from the Data Store and the web services. The portal is connected to the hosting server and hence, all items are automatically shared between the GIS server and the portal, except the web services which are only hosted by the portal.
The database layer consists of two relational database management systems (RDBMS) and one non-relational (NoSQL DBMS), synchronizing their activity. Each of these systems is dedicated to the management of a certain type of data. While the relational databases hold the GIS function of handling 2D and basic 3D features, the tile cache the manages hosted scene layers which allow storage and manipulation of the complex 3D data. Moreover, only the enterprise database allows real-time updates and is fully managed by the system administrator. In this context, the ArcGIS-specific data stores are making a copy of the layers on the database and hence, all edits done by the publisher in his desktop GIS environment require republishing or overwriting of the services. However, once published, all hosted layers are automatically handled by ArcGIS without the implication of user-management. The architecture is conceived to integrate a broad series of data formats and functionalities to fit the needs of local students. The data varies from web-services such as WMS, WFS and WMTS services, to locally stored 2D and 3D data, user-specific temporary uploads or cloud-stored base maps. The web-based services are all OGC compliant and are granted by government-owned servers. Once connected to the portal interface, they are stored as hosted services. The locally stored 2D and 3D data comes in various formats, namely .shp, .tif and .las and is first stored in a development database, which, once ready for production, is cloned and connected to the GIS Server’s relational data store. Throughout the user interface module, the user groups can have access to different web map applications which enable them to temporary upload diverse products such as .shp or .gpx files. Users also dispose of a collection of satellite imagery base maps hosted on the portal as map services.
C
ASE STUDY AND APPLICATIONSEven though this conceptual architecture appears to easily integrate all components necessary to the portal, the real implementation is expected to be followed by diverse technical and non-technical difficulties. Taking into consideration that the integration of 2D and 3D data is still at the beginning of its era, a complex map mashup to satisfy both the proposed approach and the available tools on the market would inevitably impact the implemented schema. Validation of the conceptual model is required and followed by a final decision on the extents of its implementation.
21
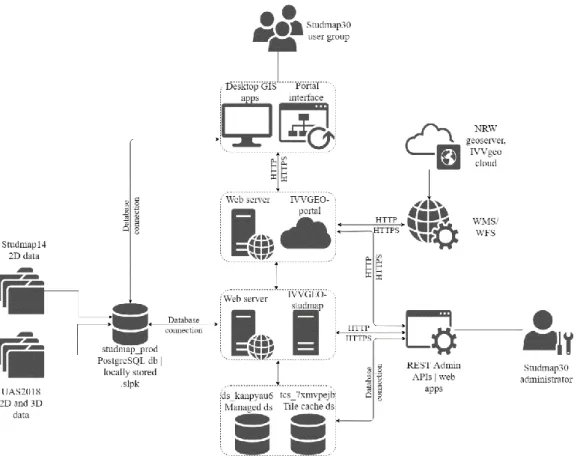
This section is dedicated to the evaluation of the proposed client-server architecture through a case study implementation. First, an overview of the implemented portal is given. The following sections refer to the focus area of the study and the data of interest to the students of the WWU to be included on the portal. The implemented architecture is then discussed and followed by the description of the access to the portal, namely the user roles and privileges set for the platform.4.3.1 Studmap 3.0
Studmap 3.0 represents the actual webGIS platform dedicated for students, that encompasses geographical data and web services of regional interest. This platform comes as a replacement for the old Studmap 1.4 portal, providing students with both the functionality that the older version had as well as enhanced features dedicated for both 2D and 3D data. The current version runs on a virtual machine belonging to WWU University and allows the download and temporary upload of spatial data for educational purposes. Its role is to guarantee the efficient use of the University's available software and personnel to avoid duplicated work and server maintenance difficulties.
4.3.2 Area of interest
The area of interest of the project is represented by the North Rhine-Westphalia state, located in the western hemisphere of Germany (Figure 6). Therefore, the selected data for the students of WWU university focuses on regional map services and project deliverables from this state. The purpose is to provide the main users of the proposed platform with datasets of educational interest.
22
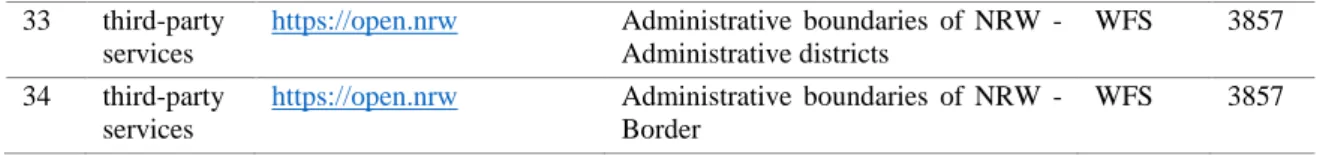
Figure 6. Area of interest.4.3.3 Data of interest
The data of interest (Table 2) for the implementation of Studmap 3.0 comes from three main sources: the Studmap 1.4 Portal, the newly generated data from the students’ UAS2018 projects and the third-party services (OpenNRW, 2017) (IVVgeo, 2018). The data comes in four different coordinate systems: 25832 (ETRS 1989 UTM Zone 32N), 32632 (WGS 1984 UTM Zone 32N), 4326 (GCS WGS 1984) and 3857 (WGS 1984 Web Mercator Auxiliary Sphere). While all items were stored with their original reference system, all projections were handled on-the-fly, while using ArcGIS Pro for the publication of the web services. Moreover, there are six different format types: .shp, .tif, .slpk, WMTS, WFS and WMS.
23
No. Source Reference Name Format EPSG 1 Studmap 14 studmap_prod.sde Uncut areas NRW Studmap 14 .shp 25832 2 UAS2018 studmap_prod.sde Centerline UAS2018 .shp 32632 3 UAS2018 studmap_prod.sde Flight path UAS2018 .shp 32632 4 UAS2018 studmap_prod.sde Flight path points UAS2018 .shp 32632 5 UAS2018 studmap_prod.sde Land cover CORINE dissolveUAS2018
.tif 32632 6 UAS2018 studmap_prod.sde Land cover dissolve UAS2018 .tif 32632 7 UAS2018 studmap_prod.sde Land cover UAS2018 .tif 32632 8 UAS2018 studmap_prod.sde DEM UAS 2018 .tif 32632 9 UAS2018 studmap_prod.sde Elevation UAS2018 .tif 32632 10 UAS2018 studmap_prod.sde LiDAR stations UAS2018 .shp 32632 11 UAS2018 studmap_prod.sde Sensebox Stations UAS2018 .shp 32632 12 UAS2018 studmap_prod.sde Air Quality UAS2018 .shp 4326 13 UAS2018 studmap_prod.sde Study area UAS2018 .shp 32632 14 UAS2018 pc.slpk Point cloud UAS2018 .slpk 32632 15 UAS2018 http://ivv6.maps.arcgis.com NDVI UAS2018 WMTS 32632 16 third-party
services
http://ivv6.maps.arcgis.com Image composition UAS2018 WMTS 3857 17 third-party
services
http://ivv6.maps.arcgis.com Orthophoto Multispectral UAS2018 WMTS 3857 18 third-party
services
http://ivv6.maps.arcgis.com Orthophoto RGB UAS2018 WMTS 3857 19 third-party
services
http://ivv6.maps.arcgis.com Aspect UAS2018 WMTS 3857 20 third-party
services
http://ivv6.maps.arcgis.com Slope UAS2018 WMTS 3857 21 third-party
services
http://ivv6.maps.arcgis.com Hillshade UAS2018 WMTS 3857 22 third-party
services
https://open.nrw Official German basemap of NRW 1:5000
WMS 3857 23 third-party
services
https://open.nrw Digital Orthophotos NRW 10cm (Metadata, RGB, CIR, NIR)
WMS 3857 24 third-party
services
https://open.nrw Landscape Information Collection of NRW
WMS 3857 25 third-party
services
https://open.nrw Regional plan of NRW WMS 3857
26 third-party services
https://open.nrw Topographical basemap of NRW 1:5000
WMS 3857 27 third-party
services
https://open.nrw Topographical map of NRW 1:25000 WMS 3857 28 third-party services https://open.nrw DTM Relief of NRW WMS 3857 29 third-party services https://open.nrw DTM Slope of NRW WMS 3857 30 third-party services https://open.nrw DTM Isolines of NRW WMS 3857 31 third-party services
https://open.nrw Administrative boundaries of NRW -
District municipalities &… WFS 3857 32 third-party
services
https://open.nrw Administrative boundaries of NRW - Districts & country-level cities
24
33 third-partyservices
https://open.nrw Administrative boundaries of NRW - Administrative districts
WFS 3857 34 third-party
services
https://open.nrw Administrative boundaries of NRW - Border
WFS 3857
Table 2 Data of interest
4.3.3.1 Studmap 1.4 data
Studmap 1.4 Portal is the former and currently unfunctional GIS platform of the University of Münster. The portal used to encompass data of regional interest to the students, such as web-based map services and geographic data mostly in the common .tif and .shp formats. The structure of the geoportal is described by the Studmap 1.4’s wiki page (IVVGeo-Team, 2018), which offers details related to the functionalities, external WMS services, post-installed packages, server configuration and web client communication.
Some of the main features of the Studmap 1.4 portal was to allow the upload of .gpx and .kml file formats and the download of the .tif, .shp and .kml file formats. Besides these, it included a tool to restore the application state and a search button. For the user interface, the map included a measuring tool, the context menu and a viewport layout, altogether with a built-in list of external web map services. Among the classic functions, it included the zoom slider, a graticule tool, a maximum extent button, the layer list, and the select feature tool. Prinz (2014) gives a visual insight into the Studmap 1.4 portal, through a series of screenshots and explanations on the workflow of the GPS (global positioning system) data transfer to a GIS.
The data and functionalities of the old Studmap 1.4 platform were investigated in order to offer a selection of relevant data and tools to be included on the newly implemented portal. As any backup files to restore the old database into a new one was lacking, no data migration from one system to another was possible. Hence, all selected data were first organized in a new geodatabase consisting of six feature datasets: biotope cadaster, fauna-flora-habitat, legally protected biotope, nature conservation area, composite surfaces, borders, and activity areas. Each dataset was analyzed for its corresponding online source, using the available list of web servers and their updated versions. One feature that had no online correspondent was found and stored in the initial development geodatabase: the uncut areas of North Rhine-Westphalia, representing the valuable ecological areas uncut by any form of infrastructure.
4.3.3.2 New 3D data of TLS and/or UAV
The new data is represented by the recent project deliverables of the students of the WWU university during the 2018 Unmanned Aerial Systems (UAS) class. The class objective is to process and analyze data captured via UAVs (Unmanned Aerial Vehicles) or TLS (Terrestrial Laser Scanning) techniques which always comes in 3D. In this time these data are produced in large amounts every year and lack an efficient way of storage, sharing, and presentation. The data consists of mostly raster and vector datasets, in three main formats .shp, .tif and the newly included file format for the LIDAR data captured
25
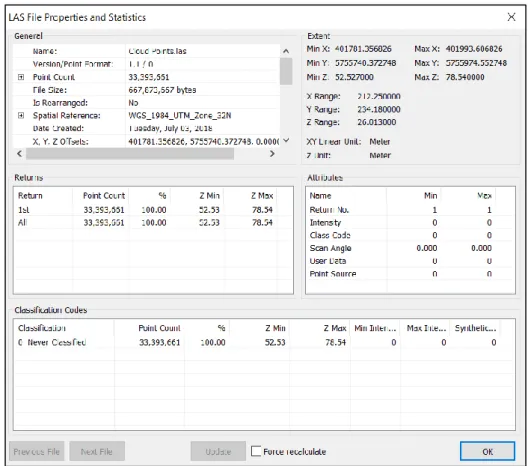
via TLS, .las. Moreover, the new data that was already published online by the students of the university comes in the format of tiled map services.The most challenging dataset included in the project consists of a small-size point cloud file in the standard .las format. The file properties and statistics of the file are presented in Figure 7. As observed in the figure, the file consists of approximately 33.5 million points, with a size of 667 MB. For easier processing, the point cloud was converted in a Scene Layer Package (.slpk) using the Create Scene Layer Package Geoprocessing Tool, resulting in a light file of only 61,4 MB. The pc_uas2018.slpk file was locally stored on the same machine that holds the databases as this type of file currently doesn’t allow storage in a database.
Figure 7 LAS File properties and statistics
4.3.3.3 Third party services
The data coming from the third-party servers is represented by the web services of regional interest to the students of the WWU University of Muenster, to which the portal is dedicated. Hence, the web services selected for this study come from two sources: the official GIS servers of the state of North Rhine-Westphalia (OpenNRW, 2017) and the